


 |
市场调查报告书
商品编码
1911495
硬碟机 (HDD) - 市场占有率分析、产业趋势与统计资料、成长预测 (2026-2031)Hard Disk Drive (HDD) - Market Share Analysis, Industry Trends & Statistics, Growth Forecasts (2026 - 2031) |
||||||
※ 本网页内容可能与最新版本有所差异。详细情况请与我们联繫。
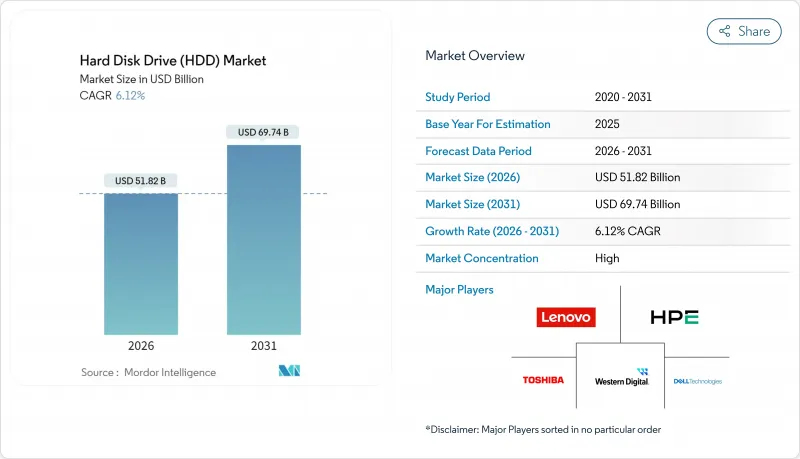
预计到 2026 年,硬碟 (HDD) 市值将达到 518.2 亿美元,从 2025 年的 488.3 亿美元成长到 2031 年的 697.4 亿美元。
预计2026年至2031年年复合成长率(CAGR)为6.12%。
硬碟仍然是超大规模储存策略的核心,这主要得益于每Terabyte的成本优势、HAMR技术推动的100TB以上容量蓝图,以及人工智慧产生的冷资料的快速成长。随着云端服务供应商将2025年创纪录的3,150亿美元资本预算中的约15-20%分配给储存基础设备,近线企业部署正在不断扩展。同时,每Terabyte的能耗指标也支撑了电力受限的资料中心市场的需求。介面趋势证实了SATA的广泛应用,而SAS和新兴的NVMe介面在高频宽至关重要的领域正获得发展动力。供应动态依然脆弱。由于几乎所有生产都由三家供应商控制,任何中断,从贸易摩擦到自然灾害,都可能迅速影响硬碟(HDD)市场。 [WESTERN DIGITAL.COM] 同时,亚太和北美地区的製造业激励措施正在推动生产结构调整,并支持关键企业订单的最终组装流程近岸外包。
全球硬碟市场趋势与洞察
对超大规模和云端储存容量的需求不断增长
预计到2024年底,超大规模资料中心的数量将达到1,136个,到2030年将成长三倍,因为人工智慧加速器正在重塑运算格局。储存约占主要云端服务供应商2025年资本支出计画的五分之一,数十亿美元将用于超高容量机架。这将主导冷层部署的硬碟(HDD)市场。西部数据预测,2024年至2028年间,HDD Exabyte货量将成长23%,主要驱动力是HAMR技术带来的密度提升。美国占超大规模容量的54%,但当地的电力限制促使人们选择每Terabyte功耗效能更高的硬碟。分散式架构将运算和储存分离,HDD处理大量冷数据,而SSD则管理热数据存取。
对于近线工作负载,固态硬碟相比固态硬碟具有每TB成本优势
希捷报告称,2024财年出货量达到Exabyte时,其每Terabyte成本将达到15美元,与企业级固态硬碟(SSD)相比,成本优势约为2.5倍。在30TB容量级别,此价格优势扩大到约3-4倍,进一步巩固了硬碟(HDD)在成本敏感型连续式资料储存领域的市场主导地位。儘管快闪记忆体製造商透过3D NAND快闪记忆体的小型化技术不断降低每Terabyte成本,但耐用性和写入成本的限制意味着,对于顺序密集型工作负载,硬碟仍然具有总体拥有成本(TCO)优势。企业买家正越来越多地采用混合策略,将高效能SSD与大规模容量HDD结合,以优化支出并实现服务水准目标。
SSD 每 TB 成本快速下降以及快闪记忆体对企业的整体拥有成本优势
目前,快闪记忆体厂商正在生产232层3D NAND快闪记忆体,并且每季都在降低每位元成本。 Pure Storage的超大规模资料中心业者设计采用案例表明,快闪记忆体结合功耗、散热和面积的节省,能够提供极具吸引力的整体成本优势。 61.44TB企业级固态硬碟的出现标誌着容量趋于融合,儘管价格不菲。 QLC NAND快闪记忆体有望进一步降低每个位元成本,但其耐久性限制了这些产品在读取密集型工作负载中的应用。随着企业买家采用整体采购观点,硬碟容量的提升速度必须超过快闪记忆体缩小成本差距的速度。
细分市场分析
预计到2025年,3.5吋硬碟产品将占总营收的65.62%,并在2031年之前以9.29%的复合年增长率超越整个硬碟市场。高容量盘片能够显着提高每机架千兆位元组的储存效率,这对于每平方英尺价值数千美元的超占地面积营运商至关重要。预计到2031年,3.5吋硬碟市场规模将超过452亿美元。磁热旋转记录(HAMR)和超高密度磁记录(UltraSMR)技术的进步,使得厂商能够实现在同一机壳内达到40TB的蓝图,从而提升该领域的规模经济效益。
较小的 2.5 吋硬碟主要面向笔记型电脑和小型伺服器,但逐渐被固态硬碟 (SSD) 取代,限制了其成长前景。 1.8 吋及更小的硬碟尺寸则应用于小众消费性电子产品和工业设备领域。基于 3.5 吋平台的高密度 JBOD底盘,透过减少硬碟数量即可实现Exabyte级容量,从而在冷端架构中保持成本优势。希捷近期在日本发布了面向消费者的 20TB 和 24TB BarraCuda 硬碟,凸显了其对 3.5 吋大容量蓝图的持续投入。
到2025年,近线企业环境将占到总出货量的44.10%,在主要工作负载中以9.52%的复合年增长率(CAGR)实现最快成长。云端架构师会将不断扩展的AI训练集整合到成本更低、密度更高的储存层上,从而巩固硬碟(HDD)作为Petabyte级丛集核心的地位。麦肯锡预测冷数据将出现爆炸性成长,而硬碟的顺序写入效能和经济的储存特性也与此相契合,这将进一步提升硬碟在近线应用中的市场占有率。
消费性桌上型电脑和游戏PC正稳定转向固态硬碟(SSD),1TB以下入门硬碟的需求量正在下降。监控阵列和NAS设备的需求仍然强劲,因为它们的写入模式和容量需求更适合磁介质。虽然企业资料中心团队仍在采用SSD和HDD共存的分散式模型,但未来十年,近线储存层(nearline layer)的绝对Exabyte成长将最为显着。
区域分析
亚太地区将在2025年占全球营收的36.10%,并在2031年之前以6.84%的复合年增长率成长。中国和日本将透过超大规模资料中心扩张和国内OEM出货量来支撑区域需求,而泰国则凭藉西部数据公司于2024年8月核准的6.93亿美元扩张计划,继续保持製造地。受电子商务和在家工作趋势持续的影响,印度零售驱动的出货量在2024年第二季较上季成长了12%。东南亚各地的智慧城市预算,包括马来西亚170亿美元的数据中心监控项目,正在推动该地区对Exabyte的需求。
北美是第二大市场,这主要得益于美国超大规模营运商的推动,它们占据了全球54%的云端容量。贸易政策的不利因素造成了成本的不确定性,但提案的激励措施可能会鼓励国内组装,从而缩短供应链。维吉尼亚州资料中心走廊週边日益增长的电网压力促使设计人员更加重视Terabyte的能源效率,这使得硬碟(HDD)市场比全Flash阵列更具优势。加拿大和墨西哥则发挥辅助作用,提供了土地、再生能源和跨境物流的优势。
在欧洲,严格的资料主权法规确保了企业稳定的资料更换週期。德国和英国正在部署冷储存丛集以满足合规的资料保留期限要求,而法国则在扩大公共部门的云端工作负载。该地区对循环经济的重视与供应商的回收计划相契合;例如,西部数据计划在2024年从价值5万英镑的废弃硬碟中回收稀土元素。长期的碳排放税讨论可能会影响储存技术的选择。硬碟製造商表示,其产品生命週期内的二氧化碳排放低于其他储存媒体。
其他福利
- Excel格式的市场预测(ME)表
- 分析师支持(3个月)
目录
第一章 引言
- 研究假设和市场定义
- 调查范围
第二章调查方法
第三章执行摘要
第四章 市场情势
- 市场概览
- 市场驱动因素
- 对超大规模和云端储存容量的需求不断增长
- 对于近线工作负载,固态硬碟相比固态硬碟具有每TB成本优势
- 智慧城市发展导致视讯监控数据增加
- 引入人工智慧驱动的冷数据分层
- 高容量HAMR蓝图(最高可达50TB硬碟)
- 透过循环经济回收计画减少物料清单 (BOM)
- 市场限制
- SSD 每 TB 价格大幅下降,企业级快闪记忆体整体拥有成本降低。
- 供应商高度集中和供应链中断
- 对高能耗硬碟生产征收潜在的碳排放税
- 机架密度限制有利于基于快闪记忆体的架构
- 价值/供应链分析
- 监管环境
- 技术展望
- 波特五力分析
- 新进入者的威胁
- 买方的议价能力
- 供应商的议价能力
- 替代品的威胁
- 竞争对手之间的竞争
- 宏观经济影响评估
第五章 市场规模与成长预测
- 按外形尺寸
- 2.5英寸
- 3.5英寸
- 其他(1.8 吋或更小,企业级 JBOD)
- 透过使用
- 行动/可携式
- 消费性桌上型电脑和游戏
- NAS 和 SOHO
- 企业和资料中心
- 近线/冷数据
- 监测与智慧城市
- 按储存容量
- 1TB 或更少
- 1~3TB
- 3~5TB
- 超过5TB
- 透过介面
- SATA
- SAS
- PCIe/NVMe(U.2、U.3)
- 按最终用户行业划分
- 资讯科技/通讯
- 家用电器製造商
- 云端和超大规模提供者
- 工业和视讯监控
- 政府/国防
- 透过记录技术
- CMR/PMR
- SMR
- HAMR 和能量辅助
- 按地区
- 北美洲
- 美国
- 加拿大
- 墨西哥
- 欧洲
- 德国
- 英国
- 法国
- 俄罗斯
- 其他欧洲
- 亚太地区
- 中国
- 日本
- 印度
- 韩国
- 澳洲
- 亚太其他地区
- 中东和非洲
- 中东
- 沙乌地阿拉伯
- 阿拉伯聯合大公国
- 其他中东地区
- 非洲
- 南非
- 埃及
- 其他非洲地区
- 中东
- 南美洲
- 巴西
- 阿根廷
- 南美洲其他地区
- 北美洲
第六章 竞争情势
- 市场集中度
- 策略趋势
- 市占率分析
- 公司简介
- Western Digital Corporation
- Toshiba Electronic Devices & Storage Corporation
- Hewlett Packard Enterprise Company
- Dell Technologies Inc.
- Lenovo Group Limited
- Huawei Technologies Co., Ltd.
- Transcend Information Inc.
- ADATA Technology Co., Ltd.
- Buffalo Inc.
- Nidec Corporation
- Showa Denko KK
- Hoya Corporation
- NetApp Inc.
- Pure Storage Inc.
- Samsung Electronics Co., Ltd.(external HDD brand)
- Micron Technology Inc.(external storage systems)
- Violin Systems LLC
- Synology Inc.
- QNAP Systems Inc.
- LaCie SAS(Seagate brand)
第七章 市场机会与未来展望
Hard Disk Drive market size in 2026 is estimated at USD 51.82 billion, growing from 2025 value of USD 48.83 billion with 2031 projections showing USD 69.74 billion, growing at 6.12% CAGR over 2026-2031.
Cost-per-terabyte advantages, HAMR-driven capacity roadmaps that point to 100 TB and beyond, and the explosion of AI-generated cold data keep hard drives central to hyperscale storage strategies. Near-line enterprise deployments expand as cloud providers allocate roughly 15-20% of their record USD 315 billion 2025 capital budgets to storage infrastructure, while energy-per-terabyte metrics sustain demand in power-constrained data-center markets. Interface trends reveal SATA's broad installed base, yet SAS and emerging NVMe pathways gain momentum where higher bandwidth is essential. Supply dynamics remain delicate because three suppliers control nearly all output; any disruption, from trade friction to natural disasters, propagates quickly through the Hard Disk Drive market [WESTERN DIGITAL.COM]. At the same time, regional manufacturing incentives in Asia-Pacific and North America are rewriting production footprints and favoring near-shoring of final assembly for mission-critical enterprise orders.
Global Hard Disk Drive (HDD) Market Trends and Insights
Rising Demand for Hyperscale and Cloud Storage Capacity
Hyperscale data-center count reached 1,136 at year-end 2024 and is projected to triple by 2030 as AI accelerators reshape computing footprints. Storage represents roughly one-fifth of the 2025 capex plans of major cloud operators, channeling billions into very-large-capacity racks that favor the Hard Disk Drive market for cold-tier deployments. Exabyte shipments of HDDs are forecast by Western Digital to grow at 23% between 2024 and 2028, driven primarily by HAMR-enabled density gains. The United States holds 54% of installed hyperscale capacity, yet local power constraints reward drives that deliver superior watts-per-terabyte performance. Disaggregated architectures now separate compute from storage, letting HDDs handle vast cold data pools while SSDs manage hot data access.
Cost/TB Advantage Over SSDs in Near-line Workloads
Seagate reported achieving USD 15 per terabyte across 398 exabytes shipped in fiscal 2024, preserving an estimated 2.5X cost gap against enterprise SSDs. At 30 TB capacity points, the price delta widens to roughly 3-4X, reinforcing the Hard Disk Drive market in cost-sensitive cold-data tiers. Flash manufacturers continue lowering dollars-per-terabyte through 3D NAND scaling, yet endurance and write-cost constraints keep total-cost-of-ownership favorable to drives for sequential-heavy workloads. Enterprise buyers increasingly articulate hybrid strategies that blend high-performance SSD tiers with large pools of HDD capacity to optimize spend and service-level objectives.
Rapid SSD $/TB Declines and Enterprise Flash TCO Gains
Flash vendors now produce 232-layer 3D NAND, pushing bit costs lower each quarter. Pure Storage's design wins at hyperscalers highlight scenarios where flash achieves compelling total cost when energy, cooling, and floor space savings are lumped into the equation. The arrival of 61.44 TB enterprise SSDs signals capacity convergence, albeit at a premium price. QLC NAND promises further dollar-per-bit gains, yet endurance constraints confine such products to read-heavy workloads. As corporate buyers increasingly adopt a holistic procurement lens, HDDs must continue to elevate capacity faster than flash narrows its cost gap.
Other drivers and restraints analyzed in the detailed report include:
- Growth of Video-Surveillance Data for Smart-City Roll-outs
- AI-Driven Cold-Data Tiering Adoption
- Extreme Supplier Concentration and Supply-Chain Shocks
For complete list of drivers and restraints, kindly check the Table Of Contents.
Segment Analysis
3.5-inch units delivered 65.62% revenue in 2025, outpacing the overall Hard Disk Drive market with a 9.29% CAGR to 2031. Their large platters enable superior gigabytes-per-rack metrics, critical for hyperscale operators that price floor space in thousands of dollars per square foot. The Hard Disk Drive market size for 3.5-inch products is projected to eclipse USD 45.2 billion by 2031. HAMR and UltraSMR advances let vendors roadmap 40 TB on the same envelope, reinforcing the segment's scale economics.
Smaller 2.5-inch drives cater to notebooks and compact servers but face SSD substitution, limiting growth prospects. Sub-1.8-inch form factors occupy niche consumer electronics and industrial gear. High-density JBOD chassis relying on 3.5-inch platforms retain cost leadership in cold-tier architectures because fewer spindles meet exabyte targets. Seagate's recent Japan launch of 20 TB and 24 TB BarraCuda SKUs at consumer-friendly pricing underscores continued investment in the high-capacity 3.5-inch roadmap.
Near-line enterprise environments garnered 44.10% of 2025 shipments and will grow at a 9.52% CAGR, the fastest among major workloads. Cloud architects funnel expanding AI training sets onto low-cost, high-density tiers, keeping the Hard Disk Drive market central to petabyte-scale clusters. The Hard Disk Drive market share for near-line roles benefits from the cold-data swell forecast by McKinsey, which aligns with drives' sequential write and economical retention strengths.
Consumer desktop and gaming PCs move steadily to SSD, trimming unit demand for entry drives below 1 TB. Surveillance arrays and NAS devices remain resilient because write patterns and capacity needs suit magnetic media. Enterprise data-center teams continue adopting disaggregated models where SSD and HDD coexist, but the near-line layer commands the highest absolute exabyte growth through the decade.
The Hard Disk Drive Market Report is Segmented by Form Factor (2. 5-Inch, 3. 5-Inch, Others), Application (Mobile/Portable, Consumer Desktop and Gaming, and More), Storage Capacity (<1TB, 1-3TB, 3-5TB, >5TB), Interface (SATA, SAS, PCIe/NVMe), End-User Industry (IT and Telecommunications, and More), Recording Technology (CMR/PMR, SMR, HAMR and Energy-Assisted), and Geography. The Market Forecasts are Provided in Terms of Value (USD).
Geography Analysis
Asia-Pacific commanded 36.10% of global revenue in 2025 and is growing at a 6.84% CAGR through 2031. China and Japan anchor regional demand through hyperscale build-outs and domestic OEM shipments, while Thailand continues as a manufacturing hub with Western Digital's USD 693 million expansion approved in August 2024. India's retail drive volumes expanded 12% quarter-over-quarter in Q2 2024 as e-commerce and home-office trends persisted. Smart-city budgets across Southeast Asia, including Malaysia's USD 17 billion data-center and surveillance programs, intensify regional exabyte uptake.
North America is the second-largest territory, propelled by U.S. hyperscale operators that hold 54% of installed cloud capacity. Trade-policy headwinds inject cost uncertainty, though proposed incentives encourage domestic assembly that could shorten supply chains. Growing power-grid constraints around Virginia's data-center corridor steer architects toward watts-per-terabyte efficiencies that favor the Hard Disk Drive market versus all-flash arrays. Canada and Mexico play supportive roles by providing land, renewable electricity, and cross-border logistics advantages.
Europe maintains consistent enterprise replacement cycles amid stringent data-sovereignty mandates. Germany and the United Kingdom deploy cold-tier clusters to meet compliance retention windows, while France expands public-sector cloud workloads. The region's circular-economy focus dovetails with vendor recycling programs, such as Western Digital's recovery of rare-earth elements from 50,000 pounds of retired drives in 2024. Long-term carbon tax discussions may influence recording-technology choices as HDD makers showcase lower lifecycle CO2 than competing storage media.
- Western Digital Corporation
- Toshiba Electronic Devices & Storage Corporation
- Hewlett Packard Enterprise Company
- Dell Technologies Inc.
- Lenovo Group Limited
- Huawei Technologies Co., Ltd.
- Transcend Information Inc.
- ADATA Technology Co., Ltd.
- Buffalo Inc.
- Nidec Corporation
- Showa Denko K.K.
- Hoya Corporation
- NetApp Inc.
- Pure Storage Inc.
- Samsung Electronics Co., Ltd. (external HDD brand)
- Micron Technology Inc. (external storage systems)
- Violin Systems LLC
- Synology Inc.
- QNAP Systems Inc.
- LaCie S.A.S. (Seagate brand)
Additional Benefits:
- The market estimate (ME) sheet in Excel format
- 3 months of analyst support
TABLE OF CONTENTS
1 INTRODUCTION
- 1.1 Study Assumptions and Market Definition
- 1.2 Scope of the Study
2 RESEARCH METHODOLOGY
3 EXECUTIVE SUMMARY
4 MARKET LANDSCAPE
- 4.1 Market Overview
- 4.2 Market Drivers
- 4.2.1 Rising demand for hyperscale and cloud storage capacity
- 4.2.2 Cost/TB advantage over SSDs in near-line workloads
- 4.2.3 Growth of video-surveillance data for smart-city roll-outs
- 4.2.4 AI-driven cold-data tiering adoption
- 4.2.5 Large-capacity HAMR roadmap up to 50 TB drives
- 4.2.6 Circular-economy recycling programs lowering BOM costs
- 4.3 Market Restraints
- 4.3.1 Rapid SSD $/TB declines and enterprise flash TCO gains
- 4.3.2 Extreme supplier concentration and supply-chain shocks
- 4.3.3 Prospective carbon taxes on energy-intensive HDD output
- 4.3.4 Rack-density limits favouring flash-based architectures
- 4.4 Value / Supply-Chain Analysis
- 4.5 Regulatory Landscape
- 4.6 Technological Outlook
- 4.7 Porter's Five Forces Analysis
- 4.7.1 Threat of New Entrants
- 4.7.2 Bargaining Power of Buyers
- 4.7.3 Bargaining Power of Suppliers
- 4.7.4 Threat of Substitutes
- 4.7.5 Intensity of Competitive Rivalry
- 4.8 Macroeconomic Impact Assessment
5 MARKET SIZE AND GROWTH FORECASTS (VALUE)
- 5.1 By Form Factor
- 5.1.1 2.5-inch
- 5.1.2 3.5-inch
- 5.1.3 Others (<1.8-inch, Enterprise JBOD)
- 5.2 By Application
- 5.2.1 Mobile/Portable
- 5.2.2 Consumer Desktop and Gaming
- 5.2.3 NAS and SOHO
- 5.2.4 Enterprise and Data-Center
- 5.2.5 Near-line / Cold-Data
- 5.2.6 Surveillance and Smart-City
- 5.3 By Storage Capacity
- 5.3.1 <1 TB
- 5.3.2 1 - 3 TB
- 5.3.3 3 - 5 TB
- 5.3.4 >5 TB
- 5.4 By Interface
- 5.4.1 SATA
- 5.4.2 SAS
- 5.4.3 PCIe / NVMe (U.2, U.3)
- 5.5 By End-User Industry
- 5.5.1 IT and Telecommunications
- 5.5.2 Consumer Electronics OEMs
- 5.5.3 Cloud and Hyperscale Providers
- 5.5.4 Industrial and Video-Surveillance
- 5.5.5 Government and Defence
- 5.6 By Recording Technology
- 5.6.1 CMR / PMR
- 5.6.2 SMR
- 5.6.3 HAMR and Energy-Assisted
- 5.7 By Geography
- 5.7.1 North America
- 5.7.1.1 United States
- 5.7.1.2 Canada
- 5.7.1.3 Mexico
- 5.7.2 Europe
- 5.7.2.1 Germany
- 5.7.2.2 United Kingdom
- 5.7.2.3 France
- 5.7.2.4 Russia
- 5.7.2.5 Rest of Europe
- 5.7.3 Asia-Pacific
- 5.7.3.1 China
- 5.7.3.2 Japan
- 5.7.3.3 India
- 5.7.3.4 South Korea
- 5.7.3.5 Australia
- 5.7.3.6 Rest of Asia-Pacific
- 5.7.4 Middle East and Africa
- 5.7.4.1 Middle East
- 5.7.4.1.1 Saudi Arabia
- 5.7.4.1.2 United Arab Emirates
- 5.7.4.1.3 Rest of Middle East
- 5.7.4.2 Africa
- 5.7.4.2.1 South Africa
- 5.7.4.2.2 Egypt
- 5.7.4.2.3 Rest of Africa
- 5.7.4.1 Middle East
- 5.7.5 South America
- 5.7.5.1 Brazil
- 5.7.5.2 Argentina
- 5.7.5.3 Rest of South America
- 5.7.1 North America
6 COMPETITIVE LANDSCAPE
- 6.1 Market Concentration
- 6.2 Strategic Moves
- 6.3 Market Share Analysis
- 6.4 Company Profiles (includes Global level Overview, Market level overview, Core Segments, Financials as available, Strategic Information, Market Rank/Share, Products and Services, Recent Developments)
- 6.4.1 Western Digital Corporation
- 6.4.2 Toshiba Electronic Devices & Storage Corporation
- 6.4.3 Hewlett Packard Enterprise Company
- 6.4.4 Dell Technologies Inc.
- 6.4.5 Lenovo Group Limited
- 6.4.6 Huawei Technologies Co., Ltd.
- 6.4.7 Transcend Information Inc.
- 6.4.8 ADATA Technology Co., Ltd.
- 6.4.9 Buffalo Inc.
- 6.4.10 Nidec Corporation
- 6.4.11 Showa Denko K.K.
- 6.4.12 Hoya Corporation
- 6.4.13 NetApp Inc.
- 6.4.14 Pure Storage Inc.
- 6.4.15 Samsung Electronics Co., Ltd. (external HDD brand)
- 6.4.16 Micron Technology Inc. (external storage systems)
- 6.4.17 Violin Systems LLC
- 6.4.18 Synology Inc.
- 6.4.19 QNAP Systems Inc.
- 6.4.20 LaCie S.A.S. (Seagate brand)
7 Market Opportunities & Future Outlook
- 7.1 White-space & Unmet-need Assessment
 硬碟机 (HDD) 和固态硬碟 (SSD) 产业:市场分析与加工趋势
 硬碟市场:2026-2032年全球市场预测(依容量、外形规格、介面类型、应用程式和部署模式划分)
 2026年全球外置磁碟系统市场报告
 全球硬碟市场-策略分析与预测(2026-2031)
 可刻录光碟市场分析及预测(至2035年):依类型、产品、技术、组件、应用、材质、製程及最终用户划分硬碟机市场分析及预测(至2035年):依类型、产品类型、技术、组件、应用、形状、材质、设备及最终用户划分
 硬碟市场 - 全球产业规模、份额、趋势、机会和预测:按类别、类型、性别、最终用户、地区和竞争格局划分,2021-2031年热辅助磁记录(HAMR)设备市场-2026-2031年预测
 热辅助磁记录(HAMR)设备:全球市场份额和排名、总收入和需求预测(2025-2031年)
 储存媒体(HDD,SSD,DRAM):季度市场追踪