


 |
市场调查报告书
商品编码
1911828
可填充和可重复使用包装:市场份额分析、行业趋势和统计数据、成长预测(2026-2031 年)Refillable And Reusable Packaging - Market Share Analysis, Industry Trends & Statistics, Growth Forecasts (2026 - 2031) |
||||||
※ 本网页内容可能与最新版本有所差异。详细情况请与我们联繫。
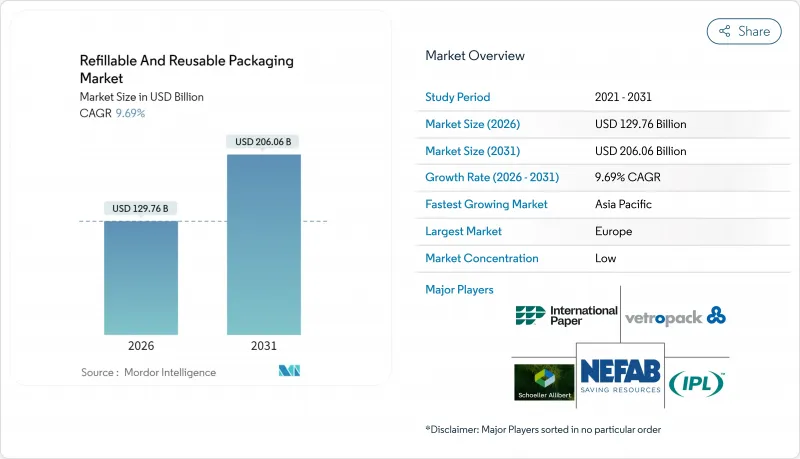
预计可填充和可重复使用包装市场将从 2025 年的 1183 亿美元增长到 2026 年的 1297.6 亿美元,预计到 2031 年将达到 2060.6 亿美元,2026 年至 2031 年的复合年增长率为 9.69%。
随着循环经济法规、供应链成本压力和消费者对永续性的偏好在已开发经济体和新兴经济体中趋于一致,可重复填充和可重复使用的包装市场正在加速发展。欧洲立法的确定性、中国的绿色小包裹强制令以及清洁和追踪解决方案的技术突破正在加速其普及,儘管基础设施方面仍有不足。企业将可回收资产定位为降低整体物流成本、缓解原物料价格波动和提升品牌价值的途径,而投资人则为可衡量的废弃物减量项目提供低成本资金。竞争的焦点在于整合物联网感测器、预测分析技术,并提供承包清洁服务,以最大限度地提高资产利用率和合规报告。
全球可重复填充及可重复使用包装市场趋势及洞察
推动强制性循环经济的法律动力
生产者延伸责任制要求企业承担产品报废成本。欧盟规定,2025年材料回收率达65%,到2030年运输包装的再利用率达90%。中国的宅配法规要求物流业者对95%的市内小包裹使用可重复使用的包装,使得可回收包装的潜在市场规模扩大至120亿美元。随着处置成本和碳价格的上涨,这些法规正推动总体拥有成本模式转向可重复使用包装模式。
透过闭合迴路供应链降低成本
营运数据证实,可重复使用的资产能够降低货运成本、工时成本和折旧成本。 CHEP 的汽车专案将卡车运转率提升至 95%,装载时间缩短了 75%,并为一级供应商节省了每年 230 万美元。 CEVA物流报告称,使用物联网可追踪容器取代一次性纸盒后,排放减少了 60%,且投资回报迅速。借助快速回收系统,这项投资通常可在 18 个月内收回成本。
高额的逆向物流成本
与运输流程相比,退货网路的处理成本可能高达三倍,尤其是在路线密度较低的地区。低温运输退货会增加成本,迫使一些品牌将其再利用计画限制在主要大都会圈的关键路线上。
细分市场分析
截至2025年,塑胶将占可重复填充和可重复使用包装市场的48.85%,这主要得益于聚丙烯和聚乙烯容器,它们能够承受高循环次数,同时与自动化系统相容。轻量化设计可减少运输排放和整体成本。由于玻璃重量较重,预计其复合年增长率将达到12.18%,而高端饮料和护肤品则更注重纯度和奢华感。 Vetropack的轻质玻璃技术在弥补运输成本差距的同时,也能保护品牌形象。金属桶和周转箱仍然是化学工业的主力军,因为在该行业,耐用性比重量更为重要;而纸基瓦楞纸板则在汽车零件运输中发挥着特殊作用。
儘管回收食品接触塑胶的永续性检验可能会促使一些品牌转向玻璃或金属包装,但嵌入物联网标籤的先进聚合物将巩固塑胶在快速循环系统中的地位。因此,随着材料科学的进步,可填充和可重复使用的包装市场正在努力平衡成本效益、品牌需求和法规遵循。
区域分析
到2025年,欧洲将占据可重复使用和可填充包装市场34.08%的份额,这得益于数十年来在政策和基础设施方面的投资。欧盟要求在2030年实现90%的运输包装重复利用,为企业的长期预算规划奠定了基础。德国的一项合作计画将包装箱的周转时间缩短至2.4天,而法国则与奢侈品牌合作,试点高端玻璃瓶可重复填充系统。英国正在投资5,000万美元建立柔软性塑胶回收能力,以加强该国的循环经济。
到2031年,亚太地区将以10.55%的复合年增长率推动成长。中国95%的城市小包裹再利用政策将催生一个价值120亿美元的可折迭托特包市场,适用于末端配送自行车。日本的生产者责任制将扩展至电子产品领域,从而推动可重复使用运输包装的需求。印度製造业的扩张将增加对可回收汽车货架的需求。韩国将在无尘室货柜池中引入物联网标籤和区块链追踪系统。东南亚将迎来大量外资涌入区域清洁中心。
在北美,企业对气候的承诺和各州层级的生产者延伸责任制法律正在推动稳步进展。 Dispatch Goods公司已筹集创业投资资金,旨在透过为餐厅提供容器共用服务来解决价值3,350亿美元的包装废弃物问题。在加拿大,资源产业正在试验可重复填充服务,而墨西哥则正在将其拥有百年历史的玻璃瓶回收系统扩展为基于应用程式的收集系统。巴西和墨西哥使用木製饮料箱的传统以及都市区日益增强的环保意识正在推动拉丁美洲的新发展。虽然中东和非洲地区仍在发展中,但零售商正在试点使用闭合迴路水桶。
其他福利:
- Excel格式的市场预测(ME)表
- 3个月的分析师支持
目录
第一章 引言
- 研究假设和市场定义
- 调查范围
第二章调查方法
第三章执行摘要
第四章 市场情势
- 市场概览
- 市场驱动因素
- 推动循环经济政策的立法倡议
- 闭合迴路供应链的成本降低效益
- 消费者对永续品牌的偏好
- 新兴的物联网赋能型行动补货零售
- 与环境、社会及公司治理 (ESG) 相关的零浪费企业融资
- 聚合物间清洗技术的创新
- 市场限制
- 高额的逆向物流成本
- 食品接触材料再利用标准存在歧义
- 热带地区的微生物污染风险
- 碎片化的追踪溯源资料通讯协定
- 产业供应链分析
- 监管环境
- 技术展望
- 波特五力分析
- 供应商的议价能力
- 消费者议价能力
- 新进入者的威胁
- 替代品的威胁
- 竞争对手之间的竞争
第五章 市场规模与成长预测
- 材料
- 塑胶
- 纸和纸板
- 金属
- 玻璃
- 副产品
- 瓶子和容器
- 托盘和木箱
- 中型散货箱(IBC)
- 鼓和桶
- 盒子和纸箱
- 罐子和桶
- 其他产品(管状、袋状、包装袋等)
- 按最终用户行业划分
- 食品/饮料
- 化妆品和个人护理
- 家居用品
- 化学品和石油化工
- 建筑/施工
- 配送和运输
- 其他终端用户产业(汽车、製药等)
- 按地区
- 北美洲
- 美国
- 加拿大
- 墨西哥
- 南美洲
- 巴西
- 阿根廷
- 南美洲其他地区
- 欧洲
- 德国
- 英国
- 法国
- 义大利
- 西班牙
- 俄罗斯
- 其他欧洲地区
- 亚太地区
- 中国
- 日本
- 印度
- 韩国
- 东南亚
- 亚太其他地区
- 中东和非洲
- 中东
- 沙乌地阿拉伯
- 阿拉伯聯合大公国
- 土耳其
- 其他中东地区
- 非洲
- 南非
- 奈及利亚
- 其他非洲地区
- 中东
- 北美洲
第六章 竞争情势
- 市场集中度
- 策略趋势
- 市占率分析
- 公司简介
- Schoeller Allibert Services BV
- International Paper
- Nefab Group
- IPL Inc.
- Vetropack Holding Ltd
- Mondi PLC
- Greif Inc.
- IFCO Systems
- Smurfit WestRock
- GWP Group
- Orbis Corporation
- Petainer Ltd
- Refillism
- Amcor PLC
- Bormioli Luigi Corporation
- Jiangmen UA Packaging Co. Ltd
- Loop Industries Inc.
- RePack Oy
- EcoEnclose LLC
第七章 市场机会与未来展望
The refillable and reusable packaging market is expected to grow from USD 118.3 billion in 2025 to USD 129.76 billion in 2026 and is forecast to reach USD 206.06 billion by 2031 at 9.69% CAGR over 2026-2031.
The refillable and reusable packaging market is gaining speed because circular-economy regulations, supply-chain cost pressures, and consumer sustainability preferences now converge across advanced and emerging economies. Legislative certainty in Europe, green-parcel mandates in China, and technology breakthroughs in cleaning and tracing solutions accelerate adoption despite lingering infrastructure gaps. Companies treat returnable assets as levers for lower total logistics spend, reduced raw-material volatility, and stronger brand equity, while investors reward measurable waste reduction with cheaper capital. Competitive activity focuses on embedding IoT sensors, predictive analytics, and turnkey washing services to maximize asset utilization and compliance reporting.
Global Refillable And Reusable Packaging Market Trends and Insights
Legislative Push Towards Circular-Economy Mandates
Extended producer responsibility policies now require companies to internalize end-of-life costs. The European Union mandates 65% material recycling by 2025 and 90% reuse for transport packaging by 2030. China's express-delivery regulation requires logistics providers to achieve a 95% reusable-packaging rate for intra-city parcels, unlocking a USD 12 billion addressable market for returnable containers. These rules tilt total-cost-of-ownership models toward reusable formats as disposal fees and carbon pricing rise.
Cost Savings from Closed-Loop Supply Chains
Operational data confirm that reusable assets lower freight bills, labor time, and write-offs. A CHEP automotive program increased truck utilization to 95% while cutting loading time by 75%, saving tier-one suppliers USD 2.3 million each year. CEVA Logistics reports 60% emission cuts and rapid payback when IoT-tracked boxes replace single-use cartons. In high-velocity loops, investments are typically recovered within 18 months.
High Reverse-Logistics Costs
Return networks can triple handling expenses relative to outbound flows, especially where route density is low. Cold-chain returns further elevate costs, pushing some brands to restrict reuse programs to high-volume urban corridors.
Other drivers and restraints analyzed in the detailed report include:
- Consumer Preference for Sustainable Brands
- Emerging IoT-Enabled Refill-on-the-Go Retail
- Ambiguity in Food-Contact Reuse Standards
For complete list of drivers and restraints, kindly check the Table Of Contents.
Segment Analysis
Plastic held 48.85% of the refillable and reusable packaging market share in 2025, thanks to polypropylene and polyethylene containers that survive high cycle counts while aligning with automation systems. Lightweight designs reduce freight emissions and total cost. Glass, though heavier, records a 12.18% CAGR because luxury beverages and skincare prioritize purity and premium feel. Vetropack's lightweight flint technology narrows freight gaps while protecting brand aesthetics.Metal drums and totes remain staples in chemicals where durability outranks weight, and paper-based corrugates secure specialized roles in automotive part shuttles.
Sustainability scrutiny of food-contact recycled plastics may gradually shift some brands toward glass and metal, yet advanced polymers embedded with IoT tags cement plastics' role in high-velocity loops. Consequently, the refillable and reusable packaging market balances cost efficiency, branding needs, and regulatory compliance as material science progresses.
The Refillable and Reusable Packaging Market Report is Segmented by Material (Plastic, Paper and Paperboard, and More), Product (Bottles and Containers, Pallets and Crates, Ibcs, Drums and Barrels, and More), End-User Industry (Food and Beverage, Cosmetics and Personal Care, Household Care, Chemicals and Petrochemicals, Building and Construction, and More), and Geography. The Market Forecasts are Provided in Terms of Value (USD).
Geography Analysis
Europe captured 34.08% of the refillable and reusable packaging market share in 2025, reflecting decades of policy layering and infrastructure investment. The EU's 90% transport-packaging reuse mandate for 2030 anchors long-term corporate budgets. Germany's pooling alliances lower crate turnaround times to 2.4 days, while France partners with luxury houses to pilot high-end glass refill systems. The United Kingdom channels USD 50 million into flexible-plastic recycling capacity, reinforcing domestic circularity.
Asia-Pacific leads growth at a 10.55% CAGR to 2031. China's 95% intra-city parcel-reuse rule yields a USD 12 billion market for foldable totes that fit last-mile bikes. Japan extends producer-responsibility fees to electronics, stimulating reusable transport packaging, while India's manufacturing expansion boosts demand for returnable automotive racks. South Korea integrates IoT tags and blockchain tracing into clean-room container pools, and Southeast Asia receives foreign investment for regional wash depots.
North America shows steady progress driven by corporate climate pledges and state-level Extended Producer Responsibility laws. Dispatch Goods raised venture funding to tackle part of the USD 335 billion packaging-waste problem through restaurant container sharing. Canada promotes refill pilots in resource industries, and Mexico scales century-old glass-bottle loops into app-based return systems. Latin America's emerging rollouts in Brazil and Mexico draw on beverage-crate heritage and rising urban eco-awareness. The Middle East and Africa, still nascent, attract interest as retailers test closed-loop water-jug fleets.
- Schoeller Allibert Services BV
- International Paper
- Nefab Group
- IPL Inc.
- Vetropack Holding Ltd
- Mondi PLC
- Greif Inc.
- IFCO Systems
- Smurfit WestRock
- GWP Group
- Orbis Corporation
- Petainer Ltd
- Refillism
- Amcor PLC
- Bormioli Luigi Corporation
- Jiangmen UA Packaging Co. Ltd
- Loop Industries Inc.
- RePack Oy
- EcoEnclose LLC
Additional Benefits:
- The market estimate (ME) sheet in Excel format
- 3 months of analyst support
TABLE OF CONTENTS
1 INTRODUCTION
- 1.1 Study Assumptions and Market Definition
- 1.2 Scope of the Study
2 RESEARCH METHODOLOGY
3 EXECUTIVE SUMMARY
4 MARKET LANDSCAPE
- 4.1 Market Overview
- 4.2 Market Drivers
- 4.2.1 Legislative push towards circular-economy mandates
- 4.2.2 Cost savings from closed-loop supply chains
- 4.2.3 Consumer preference for sustainable brands
- 4.2.4 Emerging IoT-enabled refill-on-the-go retail
- 4.2.5 ESG-linked zero-waste corporate financing
- 4.2.6 Polymer-to-polymer cleaning breakthroughs
- 4.3 Market Restraints
- 4.3.1 High reverse-logistics costs
- 4.3.2 Ambiguity in food-contact reuse standards
- 4.3.3 Microbial-contamination risks in tropical zones
- 4.3.4 Fragmented track-and-trace data protocols
- 4.4 Industry Supply Chain Analysis
- 4.5 Regulatory Landscape
- 4.6 Technological Outlook
- 4.7 Porter's Five Forces Analysis
- 4.7.1 Bargaining Power of Suppliers
- 4.7.2 Bargaining Power of Consumers
- 4.7.3 Threat of New Entrants
- 4.7.4 Threat of Substitute Products
- 4.7.5 Intensity of Competitive Rivalry
5 MARKET SIZE AND GROWTH FORECASTS
- 5.1 By Material
- 5.1.1 Plastic
- 5.1.2 Paper and Paperboard
- 5.1.3 Metal
- 5.1.4 Glass
- 5.2 By Product
- 5.2.1 Bottles and Containers
- 5.2.2 Pallets and Crates
- 5.2.3 Intermediate Bulk Containers (IBCs)
- 5.2.4 Drums and Barrels
- 5.2.5 Boxes and Cartons
- 5.2.6 Cans and Pails
- 5.2.7 Other Products (Tubes, Pouches, Bags and Sacks, etc.)
- 5.3 By End-user Industry
- 5.3.1 Food and Beverage
- 5.3.2 Cosmetics and Personal Care
- 5.3.3 Household Care
- 5.3.4 Chemicals and Petrochemicals
- 5.3.5 Building and Construction
- 5.3.6 Shipping and Transportation
- 5.3.7 Other End-user Industries (Automotive, Pharmaceuticals, etc.)
- 5.4 By Geography
- 5.4.1 North America
- 5.4.1.1 United States
- 5.4.1.2 Canada
- 5.4.1.3 Mexico
- 5.4.2 South America
- 5.4.2.1 Brazil
- 5.4.2.2 Argentina
- 5.4.2.3 Rest of South America
- 5.4.3 Europe
- 5.4.3.1 Germany
- 5.4.3.2 United Kingdom
- 5.4.3.3 France
- 5.4.3.4 Italy
- 5.4.3.5 Spain
- 5.4.3.6 Russia
- 5.4.3.7 Rest of Europe
- 5.4.4 Asia Pacific
- 5.4.4.1 China
- 5.4.4.2 Japan
- 5.4.4.3 India
- 5.4.4.4 South Korea
- 5.4.4.5 South-East Asia
- 5.4.4.6 Rest of Asia Pacific
- 5.4.5 Middle East and Africa
- 5.4.5.1 Middle East
- 5.4.5.1.1 Saudi Arabia
- 5.4.5.1.2 United Arab Emirates
- 5.4.5.1.3 Turkey
- 5.4.5.1.4 Rest of Middle East
- 5.4.5.2 Africa
- 5.4.5.2.1 South Africa
- 5.4.5.2.2 Nigeria
- 5.4.5.2.3 Rest of Africa
- 5.4.5.1 Middle East
- 5.4.1 North America
6 COMPETITIVE LANDSCAPE
- 6.1 Market Concentration
- 6.2 Strategic Moves
- 6.3 Market Share Analysis
- 6.4 Company Profiles (includes Global level Overview, Market level overview, Core Segments, Financials as available, Strategic Information, Market Rank/Share for key companies, Products and Services, and Recent Developments)
- 6.4.1 Schoeller Allibert Services BV
- 6.4.2 International Paper
- 6.4.3 Nefab Group
- 6.4.4 IPL Inc.
- 6.4.5 Vetropack Holding Ltd
- 6.4.6 Mondi PLC
- 6.4.7 Greif Inc.
- 6.4.8 IFCO Systems
- 6.4.9 Smurfit WestRock
- 6.4.10 GWP Group
- 6.4.11 Orbis Corporation
- 6.4.12 Petainer Ltd
- 6.4.13 Refillism
- 6.4.14 Amcor PLC
- 6.4.15 Bormioli Luigi Corporation
- 6.4.16 Jiangmen UA Packaging Co. Ltd
- 6.4.17 Loop Industries Inc.
- 6.4.18 RePack Oy
- 6.4.19 EcoEnclose LLC
7 MARKET OPPORTUNITIES AND FUTURE OUTLOOK
- 7.1 White-space and Unmet-need Assessment
 可重复使用包装系统市场预测至2034年:按包装类型、材料、最终用户和地区分類的全球分析
 可重复使用包装市场机会、成长要素、产业趋势分析及预测(2026年至2035年)全球可填充和可重复使用包装市场:预测至 2032 年—按产品、材料、分销管道、最终用户和地区分類的分析可重复填充和可重复使用包装解决方案市场预测至2032年:按产品、材料、分销管道、最终用户和地区分類的全球分析
 可重复使用包装市场规模、份额、趋势分析报告:按材料、产品类型、最终用途、地区和细分市场预测,2025-2030 年可重复使用的电子商务包装市场机会、成长动力、产业趋势分析与 2025 - 2034 年预测
 速食可重复使用包装市场 - 全球产业分析、规模、占有率、成长、趋势及2032年预测
 再填充和可重复使用包装的全球市场的未来(~2029年)