


 |
市场调查报告书
商品编码
1934582
中国可再生能源:市场占有率分析、产业趋势与统计、成长预测(2026-2031年)China Renewable Energy - Market Share Analysis, Industry Trends & Statistics, Growth Forecasts (2026 - 2031) |
||||||
※ 本网页内容可能与最新版本有所差异。详细情况请与我们联繫。
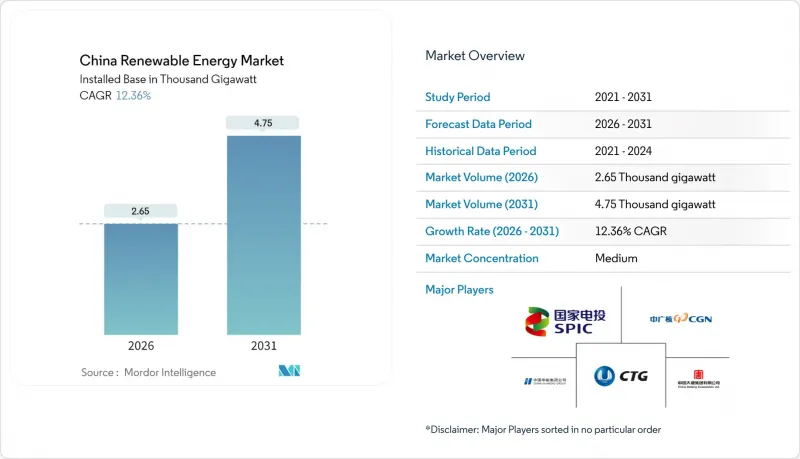
预计到 2026 年,中国可再生能源市场规模将达到 2650 吉瓦,高于 2025 年的 2360 吉瓦,预计到 2031 年将达到 4750 吉瓦。
预计2026年至2031年年复合成长率(CAGR)为12.36%。
北京正加速推动清洁能源部署,力争2060年实现碳中和。 2025年《能源法》中的政策改革、太阳能和风能平准化能源成本(LCOE)的快速下降以及企业购电协议(PPA)的扩大,正在推动装置容量的持续成长。与此同时,国有电力公司正在升级其特高压输电网,以吸收不断增长的可再生能源发电量。强大的製造业生态系统抑制了设备价格上涨,省级可再生能源配额惩罚措施进一步刺激了工商业用户的需求。此外,890亿美元的输电网投资和新的市场定价机制正在重塑电力收入模式,迫使电力生产商优化成本,提升竞争力。
中国可再生能源市场的发展趋势与展望
政府2060年碳中和义务和政策奖励
中央政府的脱碳承诺体现在具有法律约束力的装置容量配额中,地方领导人必须完成这些配额才能获得财政转移支付。 「十四五」规划要求在2030年达到1,200吉瓦的风能和太阳能总装置容量,是2024年基准的两倍。未能完成配额的省份将失去预算支持,因此公共产业正在加快可再生能源采购,以保障其财务状况。同时,绿色证书市场允许发电企业在出售电力的同时出售环境属性,使计划收益增加高达200个基点。强制性的ISO 14064报告製度进一步鼓励了广东省和上海市碳排放交易试点计画中的工业排放采购可再生能源。这些累积效应确保了中国可再生能源市场的长期透明度。
太阳能和陆域风电的平准化度电成本大幅下降
目前,在日照量高的省份,大规模太阳能发电的成本低于每千瓦时0.02美元,比新建燃煤电厂便宜30%至40%。多晶硅供应过剩,导致现货价格在2024年达到每公斤40元人民币,使得组件製造商能够以低于每瓦0.10美元的价格提供组件。 6-8兆瓦风力发电机的引入降低了电厂的整体成本,使风电成本降至每千瓦时0.03美元。一些省份的竞标为每千瓦时0.28元人民币,限制了火电厂的尖峰时段需求,并将输电容量留给了可再生能源。这种价格优势巩固了中国可再生能源市场的长期成长。
电网限电及输电瓶颈
儘管计划于2027年后完工的特高压输电线路正在建设中,但西部一些省份的峰值弃电率仍超过10%。西北电网在2024年输送了1,000亿千瓦时的清洁电力,但这仅占可再生能源发电的60%,凸显了产能利用不足的问题。虽然在2024年底新增储能容量超过70吉瓦,但这仍然不足以满足可变可再生能源快速发展所需的柔软性。由于计划间对有限输电容量的竞争,市场机制的调整可能会加剧短期弃电,从而在某些地区限制中国可再生能源市场的扩张。
细分市场分析
到2025年,太阳能发电将占总装置容量的46.20%,构成中国目前可再生能源市场规模的基础。这得益于过去十年成本的持续下降,使得组件成本降至每瓦0.10美元以下。由于每千瓦时0.28元人民币的竞标挤压了利润空间,製造商正积极寻求出口需求和垂直整合以维持收入。风电将占装置容量的约35%,其中2024年上半年新增离岸风电装置容量3.39吉瓦,展现了深海域涡轮机设计在拓展资源开发领域的效能。水力发电(包括抽水蓄能)提供了重要的柔软性,到2025年,计画新增50吉瓦抽水发电工程。
海洋能源起步规模虽小规模,但预计到2031年将以77.17%的复合年增长率成长,成为中国可再生能源市场中成长最快的领域。浙江和福建两省1兆瓦至5兆瓦的潮汐能涡轮机试验已实现超过40%的容量係数,中央政府正投入20亿元人民币的补贴,目标是到2028年将成本降至每千瓦时0.08美元。设备製造商正在调整离岸风电供应链以适应潮汐能,加速其商业化进程,并推动中国可再生能源市场摆脱对陆上资产的依赖,实现多元化发展。
中国可再生能源市场报告按技术(太阳能、风能、水力发电、生质能源、地热能和海洋能)和终端用户(电力公司、工商业和住宅)进行细分。市场规模和预测以装置容量(GW)为单位。
其他福利:
- Excel格式的市场预测(ME)表
- 3个月的分析师支持
目录
第一章 引言
- 研究假设和市场定义
- 调查范围
第二章调查方法
第三章执行摘要
第四章 市场情势
- 市场概览
- 市场驱动因素
- 政府强制要求在2060年前实现碳中和,并制定了相关政策奖励。
- 太阳能光电发电和陆域风电的平准化电成本大幅下降
- 市电平价政策与绿色电力交易自由化
- 省级可再生能源配额惩罚措施鼓励企业签订购电协议
- 混合可再生能源和储能计划审批数量激增
- 强制要求新建公共建筑安装屋顶太阳能板。
- 市场限制
- 电网约束和输电瓶颈
- 原料供应链(多晶硅、稀土)的波动性
- 土地使用纠纷导致计划审批更加严格
- 逐步取消上网电价补助和竞标竞标
- 供应链分析
- 监管环境
- 技术展望
- 波特五力模型
- 新进入者的威胁
- 供应商的议价能力
- 买方的议价能力
- 替代品的威胁
- 产业间竞争
- PESTEL 分析
第五章 市场规模与成长预测
- 透过技术
- 太阳能(光伏和聚光太阳能)
- 风力发电(陆上和海上)
- 水力发电(小规模、大型、抽水蓄能)
- 生质能源
- 地热
- 海洋能源(潮汐能和波浪能)
- 最终用户
- 电力公司
- 商业和工业
- 住宅
第六章 竞争情势
- 市场集中度
- 策略性倡议(併购、联盟、购电协议)
- 市场占有率分析(主要企业的市场排名和份额)
- 公司简介
- China Three Gorges Corporation
- State Power Investment Corporation(SPIC)
- China Huaneng Group
- China Huadian Corporation
- China Datang Corporation Renewable Power
- China General Nuclear(CGN)New Energy
- Sinohydro Corporation
- China Yangtze Power Co. Ltd
- Xinjiang Goldwind Science & Technology Co. Ltd
- Dongfang Electric Corporation Ltd
- Ming Yang Smart Energy
- Envision Energy
- Sinovel Wind Group Co. Ltd
- JinkoSolar Holdings Co. Ltd
- Trina Solar Co. Ltd
- LONGi Green Energy Technology Co. Ltd
- JA Solar Technology Co. Ltd
- Canadian Solar Inc.(China ops)
- Sungrow Power Supply Co. Ltd
- TBEA Co. Ltd
第七章 市场机会与未来展望
China Renewable Energy Market size in 2026 is estimated at 2.65 Thousand gigawatt, growing from 2025 value of 2.36 Thousand gigawatt with 2031 projections showing 4.75 Thousand gigawatt, growing at 12.36% CAGR over 2026-2031.
Beijing accelerates clean energy deployment in pursuit of its 2060 carbon neutrality pledge. Policy reforms embedded in the 2025 Energy Law, rapid declines in the levelized cost of solar and wind, and the expansion of corporate power-purchase agreements (PPAs) combine to fuel sustained capacity additions, while state utilities upgrade their ultra-high-voltage grids to absorb the rising renewable output. Robust manufacturing ecosystems keep equipment prices low, and provincial renewable-quota penalties further stimulate demand among commercial and industrial buyers. Simultaneously, transmission investments of USD 89 billion and new market-based pricing rules are reshaping revenue models, compelling generators to optimize costs and enhance their competitiveness.
China Renewable Energy Market Trends and Insights
Government 2060 Carbon-Neutrality Mandate & Policy Incentives
Central government decarbonization pledges translate into legally binding capacity quotas that provincial leaders must meet to secure fiscal transfers. The Fourteenth Five-Year Plan orders 1,200 GW of combined wind and solar by 2030, double the 2024 baseline. Provinces falling short lose budget support, so utilities accelerate renewable procurement to protect balance sheets. A parallel green-certificate market lets generators sell environmental attributes in addition to electricity, lifting project returns by up to 200 basis points. Mandatory ISO 14064 reporting further pushes industrial emitters toward renewable sourcing within carbon-trading pilots in Guangdong and Shanghai. The cumulative effect secures long-run visibility for the Chinese renewable energy market.
Rapid LCOE Decline for Solar PV & On-Shore Wind
Utility-scale solar power now delivers energy below USD 0.02 per kWh, 30%-40% cheaper than new coal in high-irradiance provinces. Polysilicon oversupply pushed spot prices to CNY 40 per kg in 2024, allowing module makers to offer sub-USD 0.10 per-watt panels. Wind energy costs have fallen to USD 0.03 per kWh as 6 MW to 8 MW turbines reduce balance-of-plant expenses. Several provincial auctions cleared at CNY 0.28 per kWh, forcing thermal units into peaking roles and freeing grid capacity for renewables. The price edge cements long-term growth in the Chinese renewable energy market.
Grid Curtailment & Transmission Bottlenecks
Curtailment in several western provinces exceeds 10% during peak output despite ongoing construction of ultra-high-voltage lines slated for completion after 2027. The Northwest grid exported 100 billion kWh of clean power in 2024, only 60% of its renewable generation, highlighting stranded capacity. Storage additions topped 70 GW by end-2024 but still trail the flexibility required for rapid variable-renewable growth. Market-based dispatch could intensify short-term curtailment as projects compete for limited transmission capacity, tempering expansion in certain parts of the Chinese renewable energy market.
Other drivers and restraints analyzed in the detailed report include:
- Boom in Hybrid Renewable-Storage Project Approvals
- Provincial Renewable-Quota Penalties Driving Captive Corporate PPAs
- Raw-Material Supply-Chain Volatility
For complete list of drivers and restraints, kindly check the Table Of Contents.
Segment Analysis
The solar segment stood at 46.20% of total capacity in 2025, anchoring the current Chinese renewable energy market size and underscoring the decade-long cost decline that produced sub-USD 0.10-per-watt modules. Auction results at CNY 0.28 per kWh compress margins, so manufacturers seek export demand and vertical integration to sustain returns. Wind contributed about 35% of installed capacity, with offshore additions of 3.39 GW in the first half of 2024, validating deep-water turbine designs that expand resource areas. Hydropower, including pumped storage, provides essential flexibility, and 50 GW of new pumped-storage projects are scheduled by 2025.
Ocean energy started from a negligible base but is projected to post an 77.17% CAGR to 2031, the highest within the Chinese renewable energy market. Zhejiang and Fujian pilots using 1 MW to 5 MW tidal turbines deliver capacity factors above 40%, and RMB 2 billion in central subsidies targets cost cuts toward USD 0.08 per kWh by 2028. Equipment makers adapt offshore-wind supply chains to tidal applications, accelerating commercialization and diversifying the Chinese renewable energy market away from land-based assets.
The China Renewable Energy Market Report is Segmented by Technology (Solar Energy, Wind Energy, Hydropower, Bioenergy, Geothermal, and Ocean Energy) and End-User (Utilities, Commercial and Industrial, and Residential). The Market Sizes and Forecasts are Provided in Terms of Installed Capacity (GW).
List of Companies Covered in this Report:
- China Three Gorges Corporation
- State Power Investment Corporation (SPIC)
- China Huaneng Group
- China Huadian Corporation
- China Datang Corporation Renewable Power
- China General Nuclear (CGN) New Energy
- Sinohydro Corporation
- China Yangtze Power Co. Ltd
- Xinjiang Goldwind Science & Technology Co. Ltd
- Dongfang Electric Corporation Ltd
- Ming Yang Smart Energy
- Envision Energy
- Sinovel Wind Group Co. Ltd
- JinkoSolar Holdings Co. Ltd
- Trina Solar Co. Ltd
- LONGi Green Energy Technology Co. Ltd
- JA Solar Technology Co. Ltd
- Canadian Solar Inc. (China ops)
- Sungrow Power Supply Co. Ltd
- TBEA Co. Ltd
Additional Benefits:
- The market estimate (ME) sheet in Excel format
- 3 months of analyst support
TABLE OF CONTENTS
1 Introduction
- 1.1 Study Assumptions & Market Definition
- 1.2 Scope of the Study
2 Research Methodology
3 Executive Summary
4 Market Landscape
- 4.1 Market Overview
- 4.2 Market Drivers
- 4.2.1 Government 2060 carbon-neutrality mandate & policy incentives
- 4.2.2 Rapid LCOE decline for solar PV & on-shore wind
- 4.2.3 Grid-parity policies & green-power trading liberalisation
- 4.2.4 Provincial renewable-quota penalties driving captive corporate PPAs
- 4.2.5 Boom in hybrid renewable-storage project approvals
- 4.2.6 Mandatory rooftop PV on new public buildings
- 4.3 Market Restraints
- 4.3.1 Grid curtailment & transmission bottlenecks
- 4.3.2 Raw-material supply-chain volatility (polysilicon, rare-earths)
- 4.3.3 Land-use conflicts causing stricter project permitting
- 4.3.4 Feed-in-tariff phase-out & low auction prices
- 4.4 Supply-Chain Analysis
- 4.5 Regulatory Landscape
- 4.6 Technological Outlook
- 4.7 Porter's Five Forces
- 4.7.1 Threat of New Entrants
- 4.7.2 Bargaining Power of Suppliers
- 4.7.3 Bargaining Power of Buyers
- 4.7.4 Threat of Substitutes
- 4.7.5 Industry Rivalry
- 4.8 PESTLE Analysis
5 Market Size & Growth Forecasts
- 5.1 By Technology
- 5.1.1 Solar Energy (PV and CSP)
- 5.1.2 Wind Energy (Onshore and Offshore)
- 5.1.3 Hydropower (Small, Large, PSH)
- 5.1.4 Bioenergy
- 5.1.5 Geothermal
- 5.1.6 Ocean Energy (Tidal and Wave)
- 5.2 By End-User
- 5.2.1 Utilities
- 5.2.2 Commercial and Industrial
- 5.2.3 Residential
6 Competitive Landscape
- 6.1 Market Concentration
- 6.2 Strategic Moves (M&A, Partnerships, PPAs)
- 6.3 Market Share Analysis (Market Rank/Share for key companies)
- 6.4 Company Profiles (includes Global level Overview, Market level overview, Core Segments, Financials as available, Strategic Information, Products & Services, and Recent Developments)
- 6.4.1 China Three Gorges Corporation
- 6.4.2 State Power Investment Corporation (SPIC)
- 6.4.3 China Huaneng Group
- 6.4.4 China Huadian Corporation
- 6.4.5 China Datang Corporation Renewable Power
- 6.4.6 China General Nuclear (CGN) New Energy
- 6.4.7 Sinohydro Corporation
- 6.4.8 China Yangtze Power Co. Ltd
- 6.4.9 Xinjiang Goldwind Science & Technology Co. Ltd
- 6.4.10 Dongfang Electric Corporation Ltd
- 6.4.11 Ming Yang Smart Energy
- 6.4.12 Envision Energy
- 6.4.13 Sinovel Wind Group Co. Ltd
- 6.4.14 JinkoSolar Holdings Co. Ltd
- 6.4.15 Trina Solar Co. Ltd
- 6.4.16 LONGi Green Energy Technology Co. Ltd
- 6.4.17 JA Solar Technology Co. Ltd
- 6.4.18 Canadian Solar Inc. (China ops)
- 6.4.19 Sungrow Power Supply Co. Ltd
- 6.4.20 TBEA Co. Ltd
7 Market Opportunities & Future Outlook
- 7.1 White-space & unmet-need assessment
 新一轮石油危机:推动通讯业者转向可再生能源
 农业可再生能源:生质燃料、太阳能发电厂和永续农业实践的全球市场—按应用、产品和地区分類的分析和预测(2025-2035 年)
 2026年全球可再生能源市场报告2026年全球多元能源系统市场报告2026年全球太阳能燃料市场报告
 可再生能源市场:全球产业分析、市场规模、市场份额及预测(依投资类型、可再生能源类型、企业类型、应用、国家及地区划分)-2026-2033年
 风电场变电站市场按组件类型、配置类型、连接类型、电压等级、最终用户和安装类型划分,全球预测(2026-2032年)全球节能设备市场:机会与策略展望(至2034年)
 节能微控制器市场分析及预测(至2035年):依类型、产品类型、服务、技术、组件、应用、最终用户、功能、安装类型、解决方案划分
 新加坡可再生能源:市场占有率分析、产业趋势与统计、成长预测(2026-2031)