


 |
市场调查报告书
商品编码
1934623
新加坡可再生能源:市场占有率分析、产业趋势与统计、成长预测(2026-2031)Singapore Renewable Energy - Market Share Analysis, Industry Trends & Statistics, Growth Forecasts (2026 - 2031) |
||||||
※ 本网页内容可能与最新版本有所差异。详细情况请与我们联繫。
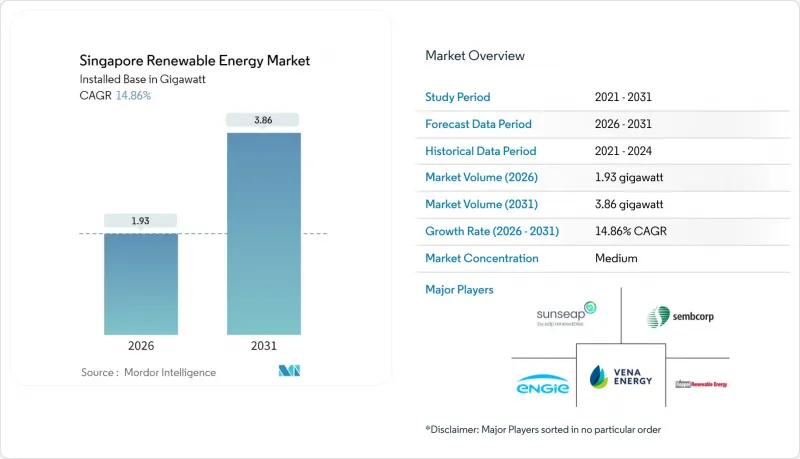
预计到 2026 年,新加坡可再生能源市场规模将达到 1.93 吉瓦。
这意味着从 2025 年的 1.68 吉瓦成长到 2031 年的 3.86 吉瓦,2026 年至 2031 年的年复合成长率(CAGR)为 14.86%。
企业对清洁能源的需求不断增长、严格的净零排放法规以及全部区域电力进口计画正在刺激投资。在这个国土面积仅728平方公里的城邦国家,太阳能发电占据主导地位,其中屋顶式、浮体式和沿海式太阳能係统是最节省空间的选择。新加坡部署了东南亚最大的285兆瓦时储能係统,并利用620万新元的研发津贴开发了太阳能发电预测模型,这些都显示了电网营运商如何应对间歇性问题。 2035年实现6吉瓦跨区域电力进口的目标,不仅使能源供应来源多元化,也巩固了新加坡作为跨境清洁能源中心的位置。新加坡快速发展的资料中心丛集对永续性要求的不断提高,也让计划开发商对长期电力需求更有把握。
新加坡可再生能源市场趋势与展望
2050年净零排放目标和2030年绿色计画目标将加速可再生能源的普及。
2050年实现具有法律约束力的净零排放目标,以及到2035年减少4500万至5000万吨二氧化碳当量排放的最新目标,都发出了明确的需求信号。 2025年2月政策更新后,新加坡立即做出了一项投资10亿美元的氢能发电厂(配备碳捕获功能)的最终投资决定。新增发电装置容量必须至少包含30%的氢气,这刺激了技术创新,促进了与可再生的混合利用。能源市场管理局(EMA)将基于排放的竞标标准纳入电力市场,以降低高碳排放发电的成本。国家气候变迁秘书处明确的课责机制,已将可再生能源从「自愿节能措施」转变为「监管合规要求」。因此,在新加坡的可再生能源市场中,部署前置作业时间较长的资产,例如浮体式光伏发电和大型储能係统,可以享受更快的审批速度和更低成本的绿色融资。
由于屋顶太阳辐射过高,对太阳能发电设备的投资减少。
从2024年到2025年,一级组件的资本成本将进一步下降7%,结合新加坡每年1700千瓦时/平方公尺的太阳辐射量,这将显着提升计划的经济效益。政府不会实施上网电价补贴(FIT)制度;取而代之的是,简化的信用额度系统将允许业主出售多余的电力,避免繁琐的官僚程序。 2024年,私营部门将提供新增装置容量的63.5%,显示纯粹的成本竞争力正在推动太阳能光电的普及。太阳能发电预测结合先进的气象分析技术,可以降低併网费用并提高内部收益率。由于屋顶光伏租赁的投资回收期通常为15-20年,商业房地产所有者正日益将太阳能光伏发电视为核心基础设施升级,而非新加坡可再生能源市场中的一项附加ESG(环境、社会和治理)措施。
大型发电设施用地严重短缺
新加坡仅23%的面积被划为工业和基础设施用地,限制了地面光伏计划的开发。开发商寻求更长期的土地阻碍因素,以满足25年的资产使用寿命,但政府机构通常只分配15年或更短的土地。联合国气候变迁纲要公约(UNFCCC)将新加坡划为“替代能源弱势地区”,凸显了结构性限制。儘管建筑建筑幕墙垂直双面光电阵列和停车座舱罩系统等创新技术能够为常被忽视的表面提供电力,但其整体贡献仍有限。因此,新加坡的政策正转向区域进口,而浮体式光电发电则持续保持新加坡可再生能源市场的成长动能。
细分市场分析
预计到2025年,太阳能发电将占新加坡总发电量的83.65%,并在2031年之前维持15.38%的复合年增长率,巩固其作为新加坡可再生能源市场支柱的地位。仅登格水库、勿洛水库和班丹水库的浮体式太阳能发电阵列就能产生超过200兆瓦的电力,而这些电力若要用于其他用途,则需要占用150至200公顷的宝贵土地。屋顶太阳能係统在工业园区占据主导地位,利用1580千瓦时/平方公尺的辐照度和双面组件,以低于电网价格的价格为工厂和资料中心供电。由于平均风速仅2-3公尺/秒,且沿海水域拥挤,风力发电仍受到限制。此外,新加坡地势平坦,没有水力发电资源。垃圾焚化发电发电厂每年可处理300万吨都市固体垃圾,增加150兆瓦的生质能源,并减少掩埋的依赖。地热能和海洋能目前仍处于勘探阶段,低温差和潮汐范围小是其发展的障碍。
因此,新加坡除太阳能以外的可再生能源市场份额更多是受制于实际需要,而非选择性多元化。根据一项为期25年的购电协议(PPA),新加坡从寮国进口了100兆瓦的水电,未来预计还将透过从柬埔寨和越南进口低碳能源的方式连接电网。建筑一体化光电发电系统在滨海湾金沙等大型开发计划中日益普及,其建筑幕墙安装的系统符合绿建筑标誌认证的要求。预计到2031年,非太阳光电技术的总装置容量容量份额将维持在20%以下。
新加坡可再生能源市场报告按技术(太阳能、风能、水力、生质能源、地热能和海洋能)和最终用户(公共产业、商业和工业以及住宅)进行细分。市场规模和预测以装置容量(吉瓦)为单位。
其他福利:
- Excel格式的市场预测(ME)表
- 3个月的分析师支持
目录
第一章 引言
- 研究假设和市场定义
- 调查范围
第二章调查方法
第三章执行摘要
第四章 市场情势
- 市场概览
- 市场驱动因素
- 透过实现「2050年净零排放」和「2030年绿色计画」目标,加速采用可再生能源。
- 儘管屋顶太阳辐射量很高,但对太阳能发电设备的投资却在下降。
- 企业永续发展措施推动现场太阳能购电协议的实施
- 快速推广内陆水库浮体式太阳能发电
- 透过农光互补示范计画实现稀缺土地的双重利用
- 超大规模资料中心的快速成长导致对可再生能源认证(REC)的需求激增。
- 市场限制
- 大型发电设施用地严重短缺
- 密集网路中的间歇性和电网稳定性挑战
- 在LTMS-P框架下与低碳电力进口展开竞争
- 废弃物能源化优先排序后生物质原料的限制
- 供应链分析
- 监管环境(政府政策和法规)
- 技术展望
- 波特五力模型
- 新进入者的威胁
- 供应商的议价能力
- 买方的议价能力
- 替代品的威胁
- 产业间竞争
- PESTEL 分析
第五章 市场规模与成长预测
- 透过技术
- 太阳能(光伏和聚光太阳能)
- 风力发电(陆上和海上)
- 水力发电(小规模、大型、抽水蓄能)
- 生质能源
- 地热
- 海洋能源(潮汐能和波浪能)
- 最终用户
- 电力公司
- 商业和工业
- 住宅
第六章 竞争情势
- 市场集中度
- 策略性措施(併购、合资、资金筹措、购电协议)
- 市场占有率分析(主要企业的市场排名和份额)
- 公司简介
- EDPR Sunseap
- Sembcorp Industries
- Keppel Renewable Energy
- Vena Energy
- ENGIE Southeast Asia
- TotalEnergies Distributed Generation SEA
- Cleantech Solar
- LYS Energy Group
- Terrenus Energy
- SP Group
- Solargy Pte Ltd
- SunPro Energies Pte Ltd
- REC Solar Holdings AS
- Keppel Seghers
- GreenYellow Singapore
- Blueleaf Energy
- Shell Energy Singapore
- JinkoSolar(Singapore)
- Trina Solar APAC
第七章 市场机会与未来展望
Singapore Renewable Energy Market size in 2026 is estimated at 1.93 gigawatt, growing from 2025 value of 1.68 gigawatt with 2031 projections showing 3.86 gigawatt, growing at 14.86% CAGR over 2026-2031.
Rising corporate demand for clean electricity, stringent net-zero rules, and region-wide power import plans are accelerating investment. Solar keeps its dominant role because rooftop, floating, and near-shore deployments are the most space-efficient options in a city-state with only 728 sq km of land. The roll-out of Southeast Asia's largest 285 MWh battery system, together with a solar forecasting model funded by SGD 6.2 million in R&D grants, shows how grid operators are tackling intermittency. Regional import targets of 6 GW by 2035 add supply diversity while anchoring Singapore's position as a cross-border clean-power hub. Intensifying sustainability mandates in the fast-growing data-center cluster further lifts long-term electricity offtake certainty for project developers.
Singapore Renewable Energy Market Trends and Insights
Net-zero 2050 & Green Plan 2030 targets intensifying renewable build-out
Singapore's legally binding net-zero target for 2050 and its updated goal of 45-50 million tCO2e by 2035 create an unambiguous demand signal. A USD 1 billion hydrogen-ready power plant with carbon-capture features reached final investment decision right after the February 2025 policy update. New generation units must now be at least 30% hydrogen-ready, forcing technology upgrades that favor renewable hybrids. The Energy Market Authority (EMA) has embedded emissions-based bidding criteria into its electricity market, tightening the cost of carbon-intensive output. Clear accountability mechanisms from the National Climate Change Secretariat have moved renewables from an optional efficiency gain to a compliance necessity. Long lead-time assets, such as floating solar or utility-scale storage, therefore secure faster permitting and cheaper green financing in the Singapore renewable energy market.
Declining solar-PV CAPEX amid high rooftop irradiance
Capital costs for Tier-1 modules fell another 7% between 2024 and 2025, intersecting with Singapore's steady 1,700 kWh/m2 annual irradiance to sharpen project economics. The government refrains from feed-in tariffs; instead, simplified credit schemes let owners sell excess power without bureaucratic delay. Private sector players delivered 63.5% of new capacity in 2024, proving that pure cost competitiveness now drives uptake. Solar forecasting linked to advanced weather analytics has trimmed balancing charges, lifting internal rates of return. With rooftop leases structured around 15- to 20-year payback horizons, commercial landlords increasingly treat photovoltaics as a core infrastructure upgrade rather than an ESG add-on in the Singapore renewable energy market.
Severe land scarcity for utility-scale assets
Only 23% of Singapore's surface is zoned for industrial or infrastructure use, constraining ground-mount projects. Developers request longer land-lease tenures to match 25-year asset lives, but state agencies often grant parcels for 15 years or less. The UNFCCC label of "alternative-energy-disadvantaged" underscores structural limits. Innovations such as vertical bifacial arrays on building facades and car-park canopy systems squeeze power into overlooked surfaces, yet aggregate contribution remains modest. Therefore, policy pivots to regional imports and floating solar maintains growth momentum in the Singapore renewable energy market.
Other drivers and restraints analyzed in the detailed report include:
- Corporate sustainability pledges pushing onsite solar PPAs
- Rapid roll-out of floating PV on inland reservoirs
- Intermittency & grid-stability challenges in a dense network
For complete list of drivers and restraints, kindly check the Table Of Contents.
Segment Analysis
Solar supplied 83.65% of 2025 capacity and is tracking a 15.38% CAGR to 2031, cementing its role as the backbone of the Singapore renewable energy market. Floating arrays on Tengeh, Bedok, and Pandan reservoirs alone unlock more than 200 MW that would otherwise require 150-200 ha of scarce land. Roof-mounted systems dominate industrial estates, leveraging 1,580 kWh/m2 irradiance and bifacial modules to deliver sub-grid pricing to factories and data centers. Wind remains marginal given 2-3 m/s average speeds and crowded coastal waters, while domestic hydropower is nonexistent due to flat topography. Waste-to-energy plants add 150 MW of bioenergy, capturing 3 M t of municipal waste and reducing landfill reliance. Geothermal and ocean energy sit in the research phase, hindered by low thermal gradients and minimal tidal ranges.
The Singapore renewable energy market share outside solar is therefore shaped by necessity rather than optional diversification. Hydropower imports from Laos supply 100 MW under a 25-year PPA; future links could arrive from Cambodia and Vietnam via the Low-Carbon Energy Imports Scheme. Building-integrated photovoltaics are gaining traction in marquee developments such as Marina Bay Sands, where facade-mounted systems meet Green Mark mandates. Collectively, non-solar technologies will retain a sub-20% share of installed capacity through 2031.
The Singapore Renewable Energy Market Report is Segmented by Technology (Solar Energy, Wind Energy, Hydropower, Bioenergy, Geothermal, and Ocean Energy) and End-User (Utilities, Commercial and Industrial, and Residential). The Market Sizes and Forecasts are Provided in Terms of Installed Capacity (GW).
List of Companies Covered in this Report:
- EDPR Sunseap
- Sembcorp Industries
- Keppel Renewable Energy
- Vena Energy
- ENGIE Southeast Asia
- TotalEnergies Distributed Generation SEA
- Cleantech Solar
- LYS Energy Group
- Terrenus Energy
- SP Group
- Solargy Pte Ltd
- SunPro Energies Pte Ltd
- REC Solar Holdings AS
- Keppel Seghers
- GreenYellow Singapore
- Blueleaf Energy
- Shell Energy Singapore
- JinkoSolar (Singapore)
- Trina Solar APAC
Additional Benefits:
- The market estimate (ME) sheet in Excel format
- 3 months of analyst support
TABLE OF CONTENTS
1 Introduction
- 1.1 Study Assumptions & Market Definition
- 1.2 Scope of the Study
2 Research Methodology
3 Executive Summary
4 Market Landscape
- 4.1 Market Overview
- 4.2 Market Drivers
- 4.2.1 Net-zero 2050 & Green Plan 2030 targets intensifying renewable build-out
- 4.2.2 Declining solar-PV CAPEX amid high rooftop irradiance
- 4.2.3 Corporate sustainability pledges pushing onsite solar PPAs
- 4.2.4 Rapid roll-out of floating PV on inland reservoirs
- 4.2.5 Agrivoltaic pilots unlocking dual-use of scarce land
- 4.2.6 Surge in REC demand from hyperscale data-centre boom
- 4.3 Market Restraints
- 4.3.1 Severe land scarcity for utility-scale assets
- 4.3.2 Intermittency & grid-stability challenges in a dense network
- 4.3.3 Competition from low-carbon power imports under LTMS-P
- 4.3.4 Limited biomass feedstock after waste-to-energy prioritisation
- 4.4 Supply-Chain Analysis
- 4.5 Regulatory Landscape (Government Policies & Regulations)
- 4.6 Technological Outlook
- 4.7 Porters Five Forces
- 4.7.1 Threat of New Entrants
- 4.7.2 Bargaining Power of Suppliers
- 4.7.3 Bargaining Power of Buyers
- 4.7.4 Threat of Substitutes
- 4.7.5 Industry Rivalry
- 4.8 PESTLE Analysis
5 Market Size & Growth Forecasts
- 5.1 By Technology
- 5.1.1 Solar Energy (PV and CSP)
- 5.1.2 Wind Energy (Onshore and Offshore)
- 5.1.3 Hydropower (Small, Large, PSH)
- 5.1.4 Bioenergy
- 5.1.5 Geothermal
- 5.1.6 Ocean Energy (Tidal and Wave)
- 5.2 By End-User
- 5.2.1 Utilities
- 5.2.2 Commercial and Industrial
- 5.2.3 Residential
6 Competitive Landscape
- 6.1 Market Concentration
- 6.2 Strategic Moves (M&A, JVs, Funding, PPAs)
- 6.3 Market Share Analysis (Market Rank/Share for key companies)
- 6.4 Company Profiles (includes Global-level Overview, Market-level Overview, Core Segments, Financials, Strategic Information, Products & Services, Recent Developments)
- 6.4.1 EDPR Sunseap
- 6.4.2 Sembcorp Industries
- 6.4.3 Keppel Renewable Energy
- 6.4.4 Vena Energy
- 6.4.5 ENGIE Southeast Asia
- 6.4.6 TotalEnergies Distributed Generation SEA
- 6.4.7 Cleantech Solar
- 6.4.8 LYS Energy Group
- 6.4.9 Terrenus Energy
- 6.4.10 SP Group
- 6.4.11 Solargy Pte Ltd
- 6.4.12 SunPro Energies Pte Ltd
- 6.4.13 REC Solar Holdings AS
- 6.4.14 Keppel Seghers
- 6.4.15 GreenYellow Singapore
- 6.4.16 Blueleaf Energy
- 6.4.17 Shell Energy Singapore
- 6.4.18 JinkoSolar (Singapore)
- 6.4.19 Trina Solar APAC
7 Market Opportunities & Future Outlook
- 7.1 White-space & Unmet-need Assessment
 新一轮石油危机:推动通讯业者转向可再生能源
 可再生能源市场规模、份额、成长及全球产业分析:按类型、应用和地区分類的洞察,2026-2034 年预测
 农业可再生能源:生质燃料、太阳能发电厂和永续农业实践的全球市场—按应用、产品和地区分類的分析和预测(2025-2035 年)
 2026年全球可再生能源市场报告2026年全球多元能源系统市场报告2026年全球太阳能燃料市场报告
 可再生能源市场:全球产业分析、市场规模、市场份额及预测(依投资类型、可再生能源类型、企业类型、应用、国家及地区划分)-2026-2033年
 风电场变电站市场按组件类型、配置类型、连接类型、电压等级、最终用户和安装类型划分,全球预测(2026-2032年)全球节能设备市场:机会与策略展望(至2034年)
 节能微控制器市场分析及预测(至2035年):依类型、产品类型、服务、技术、组件、应用、最终用户、功能、安装类型、解决方案划分