


 |
市场调查报告书
商品编码
1934585
发电机组:市场占有率分析、产业趋势与统计、成长预测(2026-2031)Generator Sets - Market Share Analysis, Industry Trends & Statistics, Growth Forecasts (2026 - 2031) |
||||||
※ 本网页内容可能与最新版本有所差异。详细情况请与我们联繫。
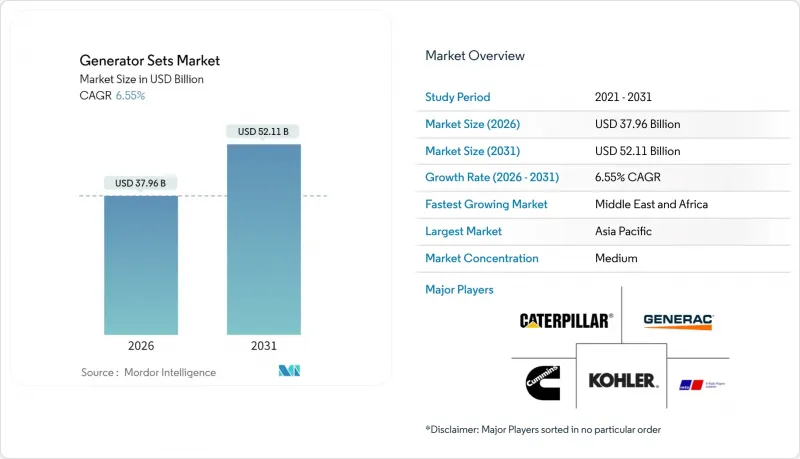
2025年发电机组市值为356.3亿美元,预计到2031年将达到521.1亿美元,而2026年为379.6亿美元。
预计在预测期(2026-2031 年)内,复合年增长率将达到 6.55%。
近期成长动能主要受新兴经济体资料中心建置、工业电气化、持续存在的电网不稳定等因素所驱动。由于在多变的天气条件和不稳定的电网环境下,发电机组运作延长,业务收益增加,售后市场也蓬勃发展,发电机组市场因此受益。随着企业将备用电源策略与脱碳目标相契合,双燃料、氢燃料电池和数位互联机型也获得了更多投资。同时,供应商正增加对更大功率引擎、先进交流发电机和远端分析技术的投资,以抵御对低千伏安(kVA)产品市场份额构成威胁的纯电池解决方案。
全球发电机组市场趋势与洞察
新兴经济体的电网可靠性问题
发展中地区频繁的停电迫使企业将发电机组视为主要和备用资产。尼日利亚2024年的发电高峰达到6003兆瓦,但持续的供不应求迫使大多数中型工厂每天运作数小时的75-375千伏安柴油发电机组。东南亚、拉丁美洲和撒哈拉以南非洲部分地区也普遍存在类似的电力不稳定问题,计划外停电造成的生产损失超过了燃料和维护成本。对更高可靠性的需求使发电机组市场牢固地依附于柴油发电机组,因为柴油发电机组的服务网络、零件供应和操作人员的熟悉程度仍然是该燃料类别中最好的。同时,对电能品质的担忧正促使企业采用数位监控和预测性维护模组来提高其已安装发电机组的运转率。
全球资料中心建置热潮
超大规模平台、託管服务供应商和政府主导的云端专案正在大力投资建造100%运转率的基础设施。 ABB指出,即使是个位数的电网故障也会威胁到波动性较大的人工智慧工作负载,因此备用发电机已成为设计要求。工程、采购和施工公司正在积极回应,采用2000kVA以上的多模组设计,以实现无缝并行运行和快速启动。宾州一个4.5GW的天然气计划专门为面向未来的资料中心和超大规模站点而设计。 Generac等供应商计划在2025年初为这些园区部署专用的氢能发电机组。这一趋势正在加速采购週期,推动对更高容量机组的需求,并促使对排放气体后处理技术进行新的投资,以满足永续性指标的要求。
柴油价格波动与燃料供应风险
美国柴油平均批发价格预计将在2025年达到每加仑3.61美元,而2024年的价格区间为每加仑3.30美元至4.05美元。工业用电大户的燃料成本占其生命週期成本的70%之多,价格和供应的波动直接推高了营运成本(OPEX)。偏远矿区和岛屿电网最为脆弱,因为运输中断和炼油厂停产可能导致长达数週的供不应求。这促使终端用户加快天然气管道、液化石油气互换或放电时间为一小时的固定式电池组的可行性研究。儘管柴油仍保持其物流优势,但采购模式越来越倾向于那些能够将远期燃料合约和双燃料转换套件捆绑销售以对冲价格波动风险的供应商。
细分市场分析
预计到2025年,75-375kVA发电机组市场规模将达139.3亿美元,占全球市场收入的39.10%。由于功率输出和成本绩效的平衡,商业办公大楼、中小企业和边缘资料中心优先选择该功率范围的发电机组。随着装机量趋于稳定,中国和巴西的市场成长将持续,但成长将放缓。
预计到2031年,375-750kVA机组市场将以8.95%的复合年增长率成长,主要受中型工厂和高性能建筑(配备高密度空调和物联网控制负载)需求成长的推动。製造商正透过智慧并联套件和符合Tier 4F排放标准的技术来应对都市区空气品质法规。更大功率的发电机具有适用于电梯集群和半导体製造设备的瞬态响应特性。 750-2000kVA以上功率范围的大型机型主要针对超大规模资料中心、液化天然气液化厂和用于尖峰负载平衡的孤岛发电专案。卡特彼勒公司投资7.25亿美元扩建位于印第安纳州的工厂,将提高大型引擎的产能,并抢占发电机组的高端市场。
柴油在能量密度、物流和服务网络方面继续享有无可比拟的优势,预计到 2025 年将占全球销售量的 70.85%。在适用监管豁免的区域矿场和建筑工地,将继续指定使用 Tier 2 或 Tier 3 引擎。
然而,双燃料和混合动力系统的复合年增长率高达10.2%,远高于5.29%的基准,这主要得益于企业在追求环境、社会和治理(ESG)目标的同时,也确保了系统的可靠性。天然气发电机正受益于稳定的管道天然气供应,而氢气混合套件则帮助企业实现净零排放目标。三菱、道依茨和Generac等公司已发布了氢能发展蓝图,显示发电机市场燃料结构的转变势在必行。生物柴油和可再生合成燃料被归类为“其他”,但它们正在获得欧洲ReFuelEU框架的政策支持。
发电机组市场报告按容量(小于 75KVA、75-375KVA、375-750KVA、大于 750KVA)、燃料类型(柴油、天然气、双燃料/混合动力、其他)、应用(紧急电源、主住宅/不间断电源、微电网和混合动力支援等)、最终用户(北美工业/工业和全球
区域分析
预计到2025年,亚太地区将占全球收入的36.65%。中国沿海省份的工厂升级改造正在加速进行,印度的生产连结奖励计画计划正在催生丛集,这些集群标配两台250千伏安的柴油机组,以确保72小时的故障容错能力。东南亚国协的建设热潮推高了对租赁车队的需求,而韩国和日本正在医院园区试用氢燃料混合燃料。
中东和非洲地区将实现9.35%的年复合成长率,成为成长最快的地区。海湾合作委员会(GCC)国家铝业、资料中心和绿色氢能的多元化发展将推动紧急和持续发电设施的普及。预计该地区2020年至2030年间的电力需求将增加29%至37%。尼日利亚电力产业的收入预计在2024年将成长70%,但由于供不应求,工厂仍将继续依赖自备发电设施。
在北美,预计将出现稳定的更新周期,其中维吉尼亚和德克萨斯州的资料中心走廊预计将达到成长高峰。欧洲第五阶段排放标准(Stage V)的法规环境正将重点转向氢燃料电池混合燃料,而南美洲的矿用卡车、港口扩建以及干旱导致的水力发电短缺正在推动对柴油发电机租赁的需求。这促成了区域均衡的发电机组组合,从而降低了週期性风险。
其他福利:
- Excel格式的市场预测(ME)表
- 3个月的分析师支持
目录
第一章 引言
- 调查范围
- 市场定义与研究假设
第二章调查方法
第三章执行摘要
第四章 市场情势
- 市场概览
- 市场驱动因素
- 新兴国家电力系统可靠度问题
- 全球资料中心建置热潮
- 快速的工业化和建设活动
- 离网通讯塔的电气化差距
- 对微电网和混合系统整合的需求
- 氢燃料相容双燃料发电机的普及
- 市场限制
- 柴油价格波动与燃料供应风险
- 对固定式引擎实施更严格的排放气体法规
- 扩大替代电池技术的应用
- 由于与脱碳相关的投资週期,人们对进行资本投资犹豫不决。
- 供应链分析
- 监管环境
- 技术展望
- 波特五力分析
- 供应商的议价能力
- 消费者议价能力
- 新进入者的威胁
- 替代产品和服务的威胁
- 竞争对手之间的竞争
- 供应商的议价能力
第五章 市场规模与成长预测
- 按产能
- 小于75千伏安
- 75~375 kVA
- 375~750 kVA
- 750~2,000 kVA
- 2000千伏安或以上
- 按燃料类型
- 柴油引擎
- 天然气
- 双燃料和混合动力
- 可再生能源/生质燃料
- 其他的
- 透过使用
- 待机电源
- 主电源/持续电源
- 尖峰用电调节
- 租赁/临时电源
- 微电网和混合支持
- 最终用户
- 住宅
- 商业建筑
- 工业和製造业
- 资料中心
- 医疗设施
- 石油和天然气
- 公共产业/电力
- 采矿和建设业
- 按地区
- 北美洲
- 我们
- 加拿大
- 墨西哥
- 欧洲
- 德国
- 英国
- 法国
- 义大利
- 北欧国家
- 俄罗斯
- 其他欧洲地区
- 亚太地区
- 中国
- 印度
- 日本
- 韩国
- 东南亚国协
- 亚太其他地区
- 南美洲
- 巴西
- 阿根廷
- 其他南美洲
- 中东和非洲
- 沙乌地阿拉伯
- 阿拉伯聯合大公国
- 南非
- 埃及
- 其他中东和非洲地区
- 北美洲
第六章 竞争情势
- 市场集中度
- 策略性倡议(併购、伙伴关係、购电协议)
- 市场占有率分析(主要企业的市场排名和份额)
- 公司简介
- Caterpillar Inc.
- Cummins Inc.
- Generac Power Systems
- Kohler Co.
- Rolls-Royce Power Systems(MTU)
- AKSA Power Generation
- Briggs & Stratton Corporation
- Doosan Corporation
- Mitsubishi Heavy Industries Ltd.
- Wartsila Corporation
- Perkins Engines Company Ltd.
- Atlas Copco AB
- FG Wilson(CAT)
- HIMOINSA SL
- Yanmar Holdings Co. Ltd.
- Honda India Power Products Ltd.
- Kirloskar Oil Engines Ltd.
- Mahindra Powerol
- JCB Power Products
- Siemens Energy AG
- Aggreko Plc
第七章 市场机会与未来展望
The Generator Sets Market was valued at USD 35.63 billion in 2025 and estimated to grow from USD 37.96 billion in 2026 to reach USD 52.11 billion by 2031, at a CAGR of 6.55% during the forecast period (2026-2031).
Recent momentum stems from data-center construction, industrial electrification, and persistent grid instability in emerging economies. The generator sets market benefits from a strong aftermarket because fleets run longer hours under volatile weather and volatile grids, raising service revenue. Dual-fuel, hydrogen-ready, and digitally connected models are capturing incremental spend as enterprises align backup strategies with decarbonization targets. Meanwhile, suppliers invest in large-engine production, advanced alternators, and remote analytics to defend share against battery-only solutions that threaten the lower-kVA range.
Global Generator Sets Market Trends and Insights
Grid-reliability concerns in emerging economies
Frequent outages in developing regions continue to compel businesses to treat generator sets as primary and standby assets. Nigeria's peak generation touched 6,003 MW in 2024, yet persistent supply gaps required most mid-size factories to keep 75-375 kVA diesels running for several hours each day. Similar instability pervades parts of Southeast Asia, Latin America, and Sub-Saharan Africa, where manufacturing losses during unplanned downtime outweigh fuel and maintenance outlays. The reliability driver keeps the generator sets market firmly anchored in diesel because service networks, parts availability, and operator familiarity remain strongest for that fuel class. At the same time, power-quality worries are prompting enterprises to embed digital monitoring and predictive-maintenance modules to squeeze higher uptime from installed fleets.
Surging data-center build-outs worldwide
Hyperscale platforms, colocation providers, and sovereign-cloud programs are spending aggressively on 100% uptime infrastructure. ABB notes that even single-digit-minute utility-grid outages jeopardize turbulent AI workloads, cementing backup generation as a design imperative. Engineering, Procurement & Construction firms have responded with multi-block, above-2000 kVA designs that can parallel seamlessly and ramp quickly. Pennsylvania's 4.5 GW natural-gas project specifically sized its output around future-proof data-center hypersites. Vendors such as Generac introduced purpose-built, hydrogen-capable gensets for these campuses in early 2025. The trend accelerates procurement cycles, lifting high-capacity unit volume and spurring fresh investment in emissions-aftertreatment to satisfy sustainability scorecards.
Volatile diesel prices and fuel supply risks
Average wholesale diesel in the United States is forecast at USD 3.61 per gallon in 2025 after swinging between USD 3.30 and USD 4.05 during 2024. Industrial prime-power users attribute up to 70% of lifecycle cost to fuel, so unreliability in price and delivery exerts direct pressure on OPEX. Remote mines and island grids are most exposed because shipping disruptions or refinery outages create multi-week shortages. End users are therefore accelerating feasibility studies on gas pipelines, LPG swaps, or stationary battery packs sized for one-hour discharge windows. While diesel retains logistical advantages, procurement patterns increasingly favor suppliers able to bundle forward-fuel contracts or dual-fuel conversion kits that hedge volatility.
Other drivers and restraints analyzed in the detailed report include:
- Rapid industrialisation and construction activities
- Electrification gaps in off-grid telecom towers
- Stricter emission norms for stationary engines
For complete list of drivers and restraints, kindly check the Table Of Contents.
Segment Analysis
The generator sets market size for 75-375 kVA reached USD 13.93 billion in 2025, equal to 39.10% of global revenue. Commercial offices, SMEs, and edge-data facilities prize this range for its balance of power and affordability. Growth continues but moderates as installed fleets mature in China and Brazil.
A sharper 8.95% CAGR through 2031 is predicted for 375-750 kVA units, driven by medium-scale factories and high-performance buildings adopting dense HVAC and IoT control loads. Manufacturers respond with smart paralleling kits and Tier 4F compliance to satisfy urban air-quality ordinances. Enlarged alternators offer transient response suitable for elevator banks and semiconductor tools. Larger bands-750-2000 kVA and above-2000 kVA-serve hyperscale data centers, LNG liquefaction, and utility peak-shaving islands. Caterpillar's USD 725 million Indiana expansion boosts large-engine throughput to capture that premium slice of the generator sets market.
Diesel commanded 70.85% of global revenue in 2025 because its energy density, logistics, and service footprint remain unmatched. Rural mining and construction sites continue to specify Tier 2 or Tier 3 engines where regulatory waivers exist.
Yet dual-fuel and hybrid systems log a 10.2% CAGR, far above the 5.29% base-line, as enterprises chase ESG targets without sacrificing reliability. Natural-gas sets exploit stable pipeline tariffs, while hydrogen-blend kits position campuses for net-zero pledges. Mitsubishi, DEUTZ, and Generac have public hydrogen-ready roadmaps, signaling an inevitable mix shift inside the generator sets market. Bio-diesel and renewable synthetic fuels appear under the "Others" banner but gain policy support in Europe's ReFuelEU framework.
The Generator Sets Market Report is Segmented by Capacity (Below 75 KVA, 75 To 375 KVA, 375 To 750 KVA, and More), Fuel Type (Diesel, Natural Gas, Dual-Fuel and Hybrid, and More), Application (Standby Power, Prime/Continuous Power, Micro-Grid and Hybrid Support, and More), End-User (Residential, Industrial and Manufacturing, Data Centers, and More), and Geography (North America, Asia-Pacific, Middle East and Africa, and More).
Geography Analysis
Asia-Pacific commanded 36.65% of global revenue in 2025. Chinese coastal provinces accelerate factory upgrades, and India's Production-Linked Incentives spawn clusters that standardize on twin 250 kVA diesel units for 72-hour resilience. ASEAN construction booms add rental fleet demand, while Korea and Japan test hydrogen blends in hospital campuses.
The Middle East and Africa deliver the fastest 9.35% CAGR. GCC diversification toward aluminum, data parks, and green hydrogen drives standby and prime installations. Regional electricity demand could jump 29-37% between 2020 and 2030. Nigerian power-sector revenue rose 70% in 2024, yet supply gaps keep factories on captive sets.
North America yields steady replacement cycles plus peak growth in data-center corridors of Virginia and Texas. Europe's Stage V landscape shifts focus to gas and H2 blends, while South America benefits from mining trucks, port expansion, and drought-driven hydro shortfalls triggering diesel rentals. The generator sets market therefore shows a balanced geographic portfolio, cushioning cyclical risk.
- Caterpillar Inc.
- Cummins Inc.
- Generac Power Systems
- Kohler Co.
- Rolls-Royce Power Systems (MTU)
- AKSA Power Generation
- Briggs & Stratton Corporation
- Doosan Corporation
- Mitsubishi Heavy Industries Ltd.
- Wartsila Corporation
- Perkins Engines Company Ltd.
- Atlas Copco AB
- FG Wilson (CAT)
- HIMOINSA S.L.
- Yanmar Holdings Co. Ltd.
- Honda India Power Products Ltd.
- Kirloskar Oil Engines Ltd.
- Mahindra Powerol
- JCB Power Products
- Siemens Energy AG
- Aggreko Plc
Additional Benefits:
- The market estimate (ME) sheet in Excel format
- 3 months of analyst support
TABLE OF CONTENTS
1 Introduction
- 1.1 Scope of the Study
- 1.2 Market Definition & Study Assumptions
2 Research Methodology
3 Executive Summary
4 Market Landscape
- 4.1 Market Overview
- 4.2 Market Drivers
- 4.2.1 Grid-reliability concerns in emerging economies
- 4.2.2 Surging data-center build-outs worldwide
- 4.2.3 Rapid industrialisation & construction activities
- 4.2.4 Electrification gaps in off-grid telecom towers
- 4.2.5 Micro-grid & hybrid system integration demand
- 4.2.6 Hydrogen-ready dual-fuel gensets gaining traction
- 4.3 Market Restraints
- 4.3.1 Volatile diesel prices & fuel supply risks
- 4.3.2 Stricter emission norms for stationary engines
- 4.3.3 Rising adoption of battery-storage alternatives
- 4.3.4 Cap-ex hesitation amid decarb-linked investment cycles
- 4.4 Supply-Chain Analysis
- 4.5 Regulatory Landscape
- 4.6 Technological Outlook
- 4.7 Porter's Five Forces Analysis
- 4.7.1 Bargaining Power of Suppliers
- 4.7.1.1 Bargaining Power of Consumers
- 4.7.1.2 Threat of New Entrants
- 4.7.1.3 Threat of Substitute Products & Services
- 4.7.1.4 Intensity of Competitive Rivalry
- 4.7.1 Bargaining Power of Suppliers
5 Market Size & Growth Forecasts
- 5.1 By Capacity
- 5.1.1 Below 75 kVA
- 5.1.2 75 to 375 kVA
- 5.1.3 375 to 750 kVA
- 5.1.4 750 to 2,000 kVA
- 5.1.5 Above 2,000 kVA
- 5.2 By Fuel Type
- 5.2.1 Diesel
- 5.2.2 Natural Gas
- 5.2.3 Dual-Fuel and Hybrid
- 5.2.4 Renewable/Bio-fuel
- 5.2.5 Others
- 5.3 By Application
- 5.3.1 Standby Power
- 5.3.2 Prime/Continuous Power
- 5.3.3 Peak-Shaving
- 5.3.4 Rental/Temporary Power
- 5.3.5 Micro-grid and Hybrid Support
- 5.4 By End-User
- 5.4.1 Residential
- 5.4.2 Commercial Buildings
- 5.4.3 Industrial and Manufacturing
- 5.4.4 Data Centers
- 5.4.5 Healthcare Facilities
- 5.4.6 Oil and Gas
- 5.4.7 Utilities and Power
- 5.4.8 Mining and Construction
- 5.5 By Geography
- 5.5.1 North America
- 5.5.1.1 United States
- 5.5.1.2 Canada
- 5.5.1.3 Mexico
- 5.5.2 Europe
- 5.5.2.1 Germany
- 5.5.2.2 United Kingdom
- 5.5.2.3 France
- 5.5.2.4 Italy
- 5.5.2.5 NORDIC Countries
- 5.5.2.6 Russia
- 5.5.2.7 Rest of Europe
- 5.5.3 Asia-Pacific
- 5.5.3.1 China
- 5.5.3.2 India
- 5.5.3.3 Japan
- 5.5.3.4 South Korea
- 5.5.3.5 ASEAN Countries
- 5.5.3.6 Rest of Asia-Pacific
- 5.5.4 South America
- 5.5.4.1 Brazil
- 5.5.4.2 Argentina
- 5.5.4.3 Rest of South America
- 5.5.5 Middle East and Africa
- 5.5.5.1 Saudi Arabia
- 5.5.5.2 United Arab Emirates
- 5.5.5.3 South Africa
- 5.5.5.4 Egypt
- 5.5.5.5 Rest of Middle East and Africa
- 5.5.1 North America
6 Competitive Landscape
- 6.1 Market Concentration
- 6.2 Strategic Moves (M&A, Partnerships, PPAs)
- 6.3 Market Share Analysis (Market Rank/Share for key companies)
- 6.4 Company Profiles (includes Global level Overview, Market level overview, Core Segments, Financials as available, Strategic Information, Products & Services, and Recent Developments)
- 6.4.1 Caterpillar Inc.
- 6.4.2 Cummins Inc.
- 6.4.3 Generac Power Systems
- 6.4.4 Kohler Co.
- 6.4.5 Rolls-Royce Power Systems (MTU)
- 6.4.6 AKSA Power Generation
- 6.4.7 Briggs & Stratton Corporation
- 6.4.8 Doosan Corporation
- 6.4.9 Mitsubishi Heavy Industries Ltd.
- 6.4.10 Wartsila Corporation
- 6.4.11 Perkins Engines Company Ltd.
- 6.4.12 Atlas Copco AB
- 6.4.13 FG Wilson (CAT)
- 6.4.14 HIMOINSA S.L.
- 6.4.15 Yanmar Holdings Co. Ltd.
- 6.4.16 Honda India Power Products Ltd.
- 6.4.17 Kirloskar Oil Engines Ltd.
- 6.4.18 Mahindra Powerol
- 6.4.19 JCB Power Products
- 6.4.20 Siemens Energy AG
- 6.4.21 Aggreko Plc
7 Market Opportunities & Future Outlook
- 7.1 White-space & Unmet-Need Assessment
 发电机组市场:依燃料类型、型号、相数、额定输出功率及最终用户划分-2026-2032年全球市场预测防水发电机组市场:依燃料类型、额定功率、应用、便携性、相数、冷却方式和机壳类型划分,全球预测,2026-2032年
 尖峰用电调节发电机组市场:商业机会、成长要素、产业趋势分析及2026-2035年预测重油发电机组市场(依引擎类型、额定功率、安装方式、冷却方式、燃油管理系统及最终用途划分),全球预测(2026-2032)2026 年至 2035 年商用发电机市场机会、成长要素、产业趋势分析及预测。
 欧洲发电机组:市场占有率分析、产业趋势与统计、成长预测(2026-2031 年)
 2026年全球发电机组市场报告
 发电机市场-全球产业规模、份额、趋势、机会、预测:按燃料类型、功率输出、便携性、应用、地区和竞争格局划分,2021-2031年发电机组市场 - 全球产业规模、份额、趋势、机会及预测(按容量、应用、最终用户、燃料、地区和竞争格局划分),2021-2031年发电机组市场机会、成长要素、产业趋势分析及2026年至2035年预测