


 |
市场调查报告书
商品编码
1934881
农光互补:市场占有率分析、产业趋势与统计、成长预测(2026-2031)Agrivoltaics - Market Share Analysis, Industry Trends & Statistics, Growth Forecasts (2026 - 2031) |
||||||
※ 本网页内容可能与最新版本有所差异。详细情况请与我们联繫。
预计到 2026 年,农光互补市场价值将达到 152.5 亿美元,高于 2025 年的 117.2 亿美元。
预计到 2031 年,该市场规模将达到 568.3 亿美元,2026 年至 2031 年的复合年增长率为 30.1%。
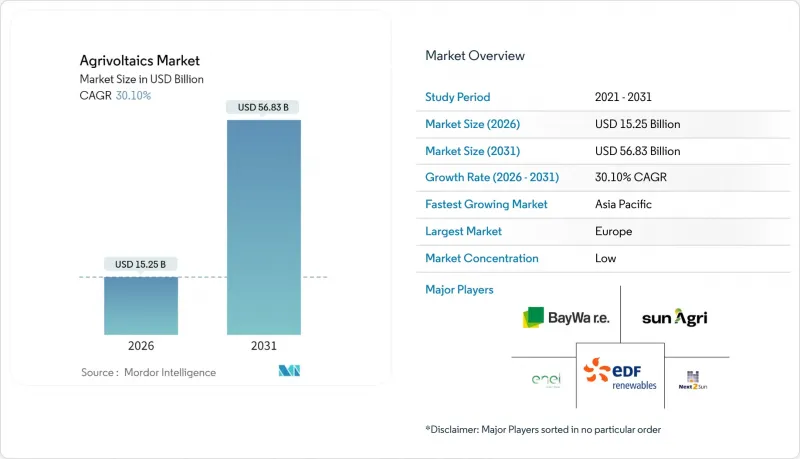
这一成长轨迹的驱动力在于土地利用经济学的根本性转变,作物和电力双重收入来源使得其资本溢价高于传统太阳能15%至25%。亚太地区将占2024年收入的69.19%,其中中国将部署超过500个计划,将水产养殖、农作物种植和畜牧业大规模整合。欧洲正在加速发展,相关法规禁止在耕地上建造大型太阳能发电厂,但对高架混合用途系统予以豁免。同时,北美正在快速推进多吉瓦级的部署,以支持农业生产。虽然双面组件、固定倾斜安装和地面安装布局目前仍占据主导地位,但动态追踪器、温室屋顶和半透明层压板也正在快速增长,因为精密农业数据可以量化传统太阳能无法实现的产量提升和节水效果。
全球农业太阳能市场趋势与洞察
与补贴挂钩的上网电价机制促进了广泛使用
专项上网电价补贴可确保现金流,进而抵销比地面光电阵列高出15-20%的资本成本。义大利的奖励(到2026年涵盖1.04吉瓦)鼓励农民主导的项目,而非纯粹由公用事业公司采购。法国随后也推出了35家生产商主导的450兆瓦合作计划。日本的2040年可再生能源发展蓝图优先考虑屋顶光电和农光互补发电,增强了长期政策的透明度。早期计划的绩效数据降低了后续的风险溢价,全部区域形成良性循环,促进再生能源的推广应用。
双面组件价格下降提高了盈利。
预计从2024年起,双面组件的全球成本将下降25%至30%,在不增加土地成本的情况下提高能量密度。与单面组件相比,双面组件的发电量可提高15%至25%,寒冷气候下积雪反照率效应将进一步提升发电量,进而改善计划的经济效益。到2024年,中国双面组件200吉瓦的产能将进一步推动价格下降,而英国的垂直双面阵列的发电量比倾斜阵列提高了25.38%。成本趋势表明,即使在高价值的农业用地上,市电平价预计也将在三到五年内实现。
初期计划的高额资本投入是一个障碍。
与地面安装式太阳能相比,高架安装结构和宽行距会使计划资本支出增加15%至25%。儘管贷款机构在评估作物和电力综合收益时仍存在资金筹措障碍,但德国的分析表明,根据农场规模的不同,年收入可从1.5万欧元到23.5万欧元不等。预计到2027年,双面和追踪系统的学习曲线效应将带来成本节约,并实现与市电平价。
细分市场分析
截至2025年,由于结构简单且经久耐用,固定倾角太阳能阵列将占据农业太阳能市场69.62%的份额。随着硬体价格差异缩小至8-12%,动态追踪器将以31.25%的复合年增长率成长。它们能够优化太阳辐射角度,并为易受霜冻影响的果园提供可变遮荫。弗劳恩霍夫太阳能係统研究所(Fraunhofer ISE)的轻型作物安装式组件引领了下一代设计潮流,可与精密农业设备配合使用。动态安装系统已应用于浆果和生菜等高价值作物,市场模型预测,到2030年,它们将占据35-40%的市场份额。
固定式光电系统仍是牧场放牧的主流,均匀的遮荫无需季节性调整即可提高饲料品质。随着追踪式光电系统的维运成本下降和即时农艺控制技术的普及,生产者期望获得一种平衡的设计组合,能够根据特定作物和牲畜的需求调整光电板的移动性,从而进一步缩小农光互补市场的资金缺口。
2025年,双面组件的出货量将占总出货量的74.52%,年复合成长率达31.02%。随着中国大规模生产和垂直安装技术的快速普及,双面组件可以从作物冠层、土壤和积雪等后方获取光线,从而在不增加土地面积的情况下提高每公顷的能源产量(千瓦时)。英国的实地测试表明,双面组件性能卓越,日发电量比垂直单面组件高出7.87%,比倾斜单面基准值高出25.38%。
单面太阳能板仍将在低反射率地区使用,但到2028年,价格竞争力可能会逆转,所有新建的农光互补装置都可能转向双面板。半透明层压板的光效可达5-5.5%,在温室中越来越受欢迎,既能满足植物生长所需的PAR光(光合有效辐射),又能实现电力自给自足。技术蓝图设想,钙钛矿和硅结合的双面电池将实现超过30%的组件效率,进一步扩大农光互补市场每面积的规模优势。
本农业光伏市场报告按系统设计(可移动面板/固定面板)、技术(单面/双面/半透明)、作物(水果/蔬菜/其他)、安装位置(温室/地面安装/遮阳网)、应用(牧场农业、园艺/耕作农业、室内农业等)和地区(北美、欧洲、亚太地区、南美、中东和非洲)进行细分。
区域分析
到2025年,亚太地区将占全球收入的68.70%,其中中国拥有超过500个运作点,涵盖水产养殖场、稻田和养羊场等,将引领这一成长。山东省的一个鱼塘系统使虾产量提高了50%,同时将閒置水转化为发电厂。日本强制推行混合用途模式,包括为屋顶和农场安装的太阳能板提供资金,以期到2040年实现40-50%的可再生能源占比。印度正在为小规模农场推广低成本的钢结构座舱罩,而韩国正在量化农业与太阳能结合的生质燃料潜力。
欧洲是成长最快的地区,年复合成长率高达31.60%。义大利禁止在肥沃土壤上安装地面太阳能板,并设立了17亿欧元的激励基金,这鼓励了开发商加入AgriVolt系统。法国的「Terr'Arbouts」(占地7平方公里,拥有35家合作农户)和德国的「SUNfarming-SPIE」(装置容量753兆瓦)等计画表明,大规模部署已做好充分准备。在冬季日照时间较短的情况下,积雪覆盖的北欧国家正在利用双面太阳能板的背面发电效应,进一步推动了整个欧洲大陆的发展势头。
在北美,混合用途的大型专案正在推动规模化发展。俄亥俄州一个800兆瓦太阳能+300兆瓦储能综合体将三分之二的场地保留为耕地,这表明该模式已获得监管部门的认可。佛蒙特州的一个垂直设计项目维持了90%的耕地利用率。联邦LASSO奖励基金将畜牧放牧与太阳能发电相结合,美国农业部/能源部的研究合作计画产生了有助于降低风险和增加资本流入的农艺资料集。墨西哥的一个本土试点计画展示了农业太阳能如何降低偏远地区的柴油泵成本并提高玉米产量。
南美洲以及中东和非洲地区仍在发展中。哥伦比亚的早期试点计画和卡达的半透明生菜温室展现出前景可观但尚处于探索阶段的良好势头。随着屋顶太阳能的普及,这些地区的成本可能会从2027年起逐渐下降。
其他福利:
- Excel格式的市场预测(ME)表
- 3个月的分析师支持
目录
第一章 引言
- 研究假设和市场定义
- 调查范围
第二章调查方法
第三章执行摘要
第四章 市场情势
- 市场概览
- 市场驱动因素
- 与补贴挂钩的上网电价补贴(欧盟、亚洲)
- 双面光学模组的价格正在下降
- 土地稀缺国家的两用土地强制规定
- 作物微气候带来的产量溢价超过10%
- 农业太阳能购电协议中排碳权的积累
- 因太阳辐射减少导致蒸散量降低,农业保险可享折扣
- 市场限制
- 高昂的资本投资成本与地面安装式太阳能发电相比
- 农业用地分区规定不明确
- 作物残渣造成的模组污染
- 农业太阳能发电领域劳动力技能缺口
- 供应链分析
- 监管环境
- 技术展望
- 波特五力模型
- 新进入者的威胁
- 买方的议价能力
- 供应商的议价能力
- 替代品的威胁
- 竞争对手之间的竞争
第五章 市场规模与成长预测
- 透过系统设计
- 动态面板
- 固定面板
- 透过技术
- 单面
- 双面面板
- 半透明
- 按作物
- 水果
- 蔬菜
- 其他的
- 按安装位置
- 温室
- 地面安装
- 遮阳网
- 透过使用
- 草地农业
- 园艺及耕作农业
- 室内农业
- 传粉者栖息地
- 按地区
- 北美洲
- 我们
- 加拿大
- 墨西哥
- 欧洲
- 德国
- 英国
- 法国
- 义大利
- 北欧国家
- 俄罗斯
- 其他欧洲
- 亚太地区
- 中国
- 印度
- 日本
- 韩国
- 东南亚国协
- 亚太其他地区
- 南美洲
- 巴西
- 阿根廷
- 南美洲其他地区
- 中东和非洲
- 沙乌地阿拉伯
- 阿拉伯聯合大公国
- 南非
- 埃及
- 其他中东和非洲地区
- 北美洲
第六章 竞争情势
- 市场集中度
- 策略性倡议(併购、伙伴关係、购电协议)
- 市场占有率分析(主要企业的市场排名和份额)
- 公司简介
- Sun'Agri
- Enel Green Power
- BayWa re
- Fraunhofer ISE
- Next2Sun
- Insolight
- REM TEC
- Kyocera Corporation
- Acciona Energia
- EDF Renewables
- Zimmermann PV-Stahlbau
- Scatec ASA
- Arava Power Company
- Ameresco
- ENGIE SA
- R.Power Group
- TNO
- Hevel Solar
- Local Agri-solar Cooperatives
第七章 市场机会与未来展望
Agrivoltaics market size in 2026 is estimated at USD 15.25 billion, growing from 2025 value of USD 11.72 billion with 2031 projections showing USD 56.83 billion, growing at 30.1% CAGR over 2026-2031.
This trajectory stems from a fundamental shift in land-use economics: dual revenue streams from crops and electricity now warrant a 15-25% capital premium over conventional solar. Asia-Pacific holds 69.19% of 2024 revenue after China deployed more than 500 projects that integrate aquaculture, field crops, and livestock at a commercial scale. Europe accelerates under mandates that prohibit utility-scale arrays on productive farmland yet exempt elevated dual-use systems, while North America fast-tracks multi-gigawatt ventures that preserve farming operations. Bifacial modules, fixed-tilt racking, and ground-mounted layouts dominate current rollouts, but dynamic trackers, greenhouse roofs, and semi-transparent laminates are growing rapidly as precision agriculture data quantifies yield gains and water savings that conventional photovoltaics cannot deliver.
Global Agrivoltaics Market Trends and Insights
Subsidy-linked Feed-in Tariffs Widen Adoption
Dedicated feed-in tariffs guarantee cash flows that offset the 15-20% capital premium over ground-mount arrays. Italy's incentive covering 1.04 GW by 2026 catalyzes farmer-led ventures rather than pure-utility procurement. France followed with a 450 MW cooperative project driven by 35 growers. Japan's 2040 renewables road map prioritizes rooftop and agrivoltaic capacity, reinforcing long-run policy visibility. Early projects create performance data that lowers subsequent risk premiums, creating a virtuous adoption cycle across Europe and Asia-Pacific.
Declining Bifacial Module Prices Lift Returns
Global bifacial module costs have fallen 25-30% since 2024, raising energy density without raising land costs. Yield gains of 15-25% over monofacial panels, enhanced by snow albedo in cold climates, strengthen project economics. China's 200 GW of 2024 bifacial capacity underpins further price compression, and vertical bifacial arrays in the United Kingdom show 25.38% output gains over tilted systems. The cost trajectory suggests grid-parity agrivoltaics within three to five years, even in high-value farmland.
High Capital Expenditure Limits Early Projects
Elevated mounting structures and wider row spacing raise project capex by 15-25% versus ground-mount solar. Financing hurdles persist as lenders gauge combined crop and power revenues, although German analyses show diversified annual profits of EUR 15,000-235,000 by farm scale. Learning-curve savings from bifacial and tracking adoption are expected to reach parity by 2027.
Other drivers and restraints analyzed in the detailed report include:
- Dual-use Land Mandates Spur Structural Demand
- Crop Micro-climate Yield Premiums Validate Value
- Unclear Zoning Frameworks Slow Permitting
For complete list of drivers and restraints, kindly check the Table Of Contents.
Segment Analysis
Fixed-tilt arrays held 69.62% of the agrivoltaics market share in 2025, due to their simplicity and durability. Dynamic trackers are growing at a 31.25% CAGR as hardware premiums narrow to 8-12%; they optimize sun angles and offer variable shading for frost-prone orchards. Fraunhofer ISE's lightweight, crop-mounted modules signal next-generation designs that align with precision-farming equipment. Dynamic installations are already serving high-value segments, such as berries and lettuce, and market models suggest they can reach a 35-40% share by 2030.
Fixed configurations still dominate grassland grazing, where uniform shade enhances forage quality without seasonal adjustments. As tracker O&M costs decrease and real-time agronomic control expands, producers expect a balanced design mix that tailors panel mobility to specific crop or livestock requirements, further reducing the capital gap for the agrivoltaics market.
Bifacial modules commanded 74.52% of 2025 shipments and are advancing at 31.02% CAGR. Mass production in China and the rapid diffusion of vertical racking enable bifacial arrays to harvest light from the rear side, such as from crop canopies, soil, or snow, thereby increasing kWh per hectare without requiring additional land. UK field tests record 7.87% higher daily output than vertical monofacial setups and 25.38% better than tilted monofacial baselines, validating the performance edge.
Monofacial panels remain in low-albedo areas, but parity pricing may flip all new agrivoltaic capacity to bifacial by 2028. Semi-transparent laminates, which deliver 5-5.5% light utilization efficiency, are gaining traction for greenhouses, balancing PAR light needs with electrical autonomy. Technology roadmaps foresee tandem perovskite-silicon bifacial cells, enabling module efficiencies of over 30%, thereby amplifying the agrivoltaics market size advantage per acre.
The Agrivoltaics Market Report is Segmented by System Design (Dynamic Panel and Fixed Panel), Technology (Monofacial, Bifacial, and Translucent), Crop (Fruits, Vegetables, and Others), Placement (Greenhouses, Ground Mounted, and Shading Nets), Application (Grassland Farming, Horticulture and Arable Farming, Indoor Farming, and More), and Geography (North America, Europe, Asia-Pacific, South America, and Middle East and Africa).
Geography Analysis
Asia-Pacific retained 68.70% of global revenue during 2025, propelled by China's 500-plus operational sites spanning aquaculture, rice paddies, and goat pastures. Shandong's fish-pond systems increased shrimp yields by 50% while converting idle water surfaces into power plants. Japan mandates dual-use models to achieve its 40-50% renewable electricity goal by 2040, financing sheltered rooftop and farmland arrays. India's low-cost steel canopies suit smallholder plots, while South Korea quantifies biofuel potential from agri-PV integration.
Europe is the fastest-growing region at a 31.60% CAGR. Italy's ban on ground-mount solar panels over fertile soil, coupled with a EUR 1.7 billion incentive fund, is funneling developers into agrivoltaics. France's Terr'Arbouts, covering 7 km2 with 35 farmer partners, and Germany's SUNfarming-SPIE 753 MW park illustrate scale readiness. Snow-rich Nordic nations exploit bifacial rear-side gains during low-sun winters, reinforcing continental momentum.
North America scales via mixed-use mega-sites. Ohio's 800 MW solar-plus-300 MW storage complex reserves two-thirds of the acreage for crops, signaling regulatory acceptance. Vermont's vertical design retains 90% farmland utility. The Federal LASSO Prize funding combines cattle grazing with solar energy, and the USDA-DOE research alliance generates agronomic datasets that mitigate risk and increase capital inflows. Mexico's indigenous pilot arrays demonstrate that agrivoltaics can reduce diesel pump costs and enhance maize yields in marginalized communities.
South America and the Middle East & Africa remain nascent. Colombia's early-stage sites and Qatar's semi-transparent lettuce greenhouses highlight exploratory but promising footholds. These regions may experience cost declines post-2027, mirroring the diffusion curves of rooftop solar.
- Sun'Agri
- Enel Green Power
- BayWa r.e.
- Fraunhofer ISE
- Next2Sun
- Insolight
- REM TEC
- Kyocera Corporation
- Acciona Energia
- EDF Renewables
- Zimmermann PV-Stahlbau
- Scatec ASA
- Arava Power Company
- Ameresco
- ENGIE SA
- R.Power Group
- TNO
- Hevel Solar
- Local Agri-solar Cooperatives
Additional Benefits:
- The market estimate (ME) sheet in Excel format
- 3 months of analyst support
TABLE OF CONTENTS
1 Introduction
- 1.1 Study Assumptions & Market Definition
- 1.2 Scope of the Study
2 Research Methodology
3 Executive Summary
4 Market Landscape
- 4.1 Market Overview
- 4.2 Market Drivers
- 4.2.1 Subsidy-linked FiT programs (EU, Asia)
- 4.2.2 Declining bifacial PV module prices
- 4.2.3 Dual-use land mandates in land-scarce nations
- 4.2.4 Crop micro-climate yield premiums Over 10 %
- 4.2.5 Carbon-credit stacking in agri-solar PPAs
- 4.2.6 Ag insurance discounts for shade-reduced evapotranspiration
- 4.3 Market Restraints
- 4.3.1 High capex vs. ground-mount PV
- 4.3.2 Unclear agri-zoning regulations
- 4.3.3 Module soiling from crop residues
- 4.3.4 Agronomic-PV labor skill gap
- 4.4 Supply-Chain Analysis
- 4.5 Regulatory Landscape
- 4.6 Technological Outlook
- 4.7 Porter's Five Forces
- 4.7.1 Threat of New Entrants
- 4.7.2 Bargaining Power of Buyers
- 4.7.3 Bargaining Power of Suppliers
- 4.7.4 Threat of Substitutes
- 4.7.5 Competitive Rivalry
5 Market Size & Growth Forecasts
- 5.1 By System Design
- 5.1.1 Dynamic Panel
- 5.1.2 Fixed Panel
- 5.2 By Technology
- 5.2.1 Monofacial
- 5.2.2 Bifacial
- 5.2.3 Translucent
- 5.3 By Crop
- 5.3.1 Fruits
- 5.3.2 Vegetables
- 5.3.3 Others
- 5.4 By Placement
- 5.4.1 Greenhouses
- 5.4.2 Ground Mounted
- 5.4.3 Shading Nets
- 5.5 By Application
- 5.5.1 Grassland Farming
- 5.5.2 Horticulture and Arable Farming
- 5.5.3 Indoor Farming
- 5.5.4 Pollinator Habitat
- 5.6 By Geography
- 5.6.1 North America
- 5.6.1.1 United States
- 5.6.1.2 Canada
- 5.6.1.3 Mexico
- 5.6.2 Europe
- 5.6.2.1 Germany
- 5.6.2.2 United Kingdom
- 5.6.2.3 France
- 5.6.2.4 Italy
- 5.6.2.5 NORDIC Countries
- 5.6.2.6 Russia
- 5.6.2.7 Rest of Europe
- 5.6.3 Asia-Pacific
- 5.6.3.1 China
- 5.6.3.2 India
- 5.6.3.3 Japan
- 5.6.3.4 South Korea
- 5.6.3.5 ASEAN Countries
- 5.6.3.6 Rest of Asia-Pacific
- 5.6.4 South America
- 5.6.4.1 Brazil
- 5.6.4.2 Argentina
- 5.6.4.3 Rest of South America
- 5.6.5 Middle East and Africa
- 5.6.5.1 Saudi Arabia
- 5.6.5.2 United Arab Emirates
- 5.6.5.3 South Africa
- 5.6.5.4 Egypt
- 5.6.5.5 Rest of Middle East and Africa
- 5.6.1 North America
6 Competitive Landscape
- 6.1 Market Concentration
- 6.2 Strategic Moves (M&A, Partnerships, PPAs)
- 6.3 Market Share Analysis (Market Rank/Share for key companies)
- 6.4 Company Profiles (includes Global level Overview, Market level overview, Core Segments, Financials as available, Strategic Information, Products & Services, and Recent Developments)
- 6.4.1 Sun'Agri
- 6.4.2 Enel Green Power
- 6.4.3 BayWa r.e.
- 6.4.4 Fraunhofer ISE
- 6.4.5 Next2Sun
- 6.4.6 Insolight
- 6.4.7 REM TEC
- 6.4.8 Kyocera Corporation
- 6.4.9 Acciona Energia
- 6.4.10 EDF Renewables
- 6.4.11 Zimmermann PV-Stahlbau
- 6.4.12 Scatec ASA
- 6.4.13 Arava Power Company
- 6.4.14 Ameresco
- 6.4.15 ENGIE SA
- 6.4.16 R.Power Group
- 6.4.17 TNO
- 6.4.18 Hevel Solar
- 6.4.19 Local Agri-solar Cooperatives
7 Market Opportunities & Future Outlook
- 7.1 White-Space & Unmet-Need Assessment
 2026年全球农场太阳能发电市场报告
 全球农光互补市场(至 2035 年):依系统设计类型、技术类型、作物类型、安装类型、应用类型、地区、产业趋势与预测
 农业太阳能市场-全球产业规模、份额、趋势、机会及预测(按阵列配置、太阳能电池技术、安装地点、地区和竞争格局划分,2021-2031年)
 农光互补市场规模、份额和成长分析(按系统设计、作物类型、安装方式、材料类型、电池类型和地区划分)-2026-2033年产业预测
 全球农光电市场
 农业光电市场:未来预测(2025-2030)
 农光伏市场机会、成长动力、产业趋势分析及2025-2034年预测
 农业光电市场:依系统类型、电池类型、作物类型、地区、机会、预测,2018-2032年印度的农业光伏市场评估:系统类型·电池单元类型·作物类型·各地区的机会及预测 (2018-2032年)
 亚太农业光伏市场:按产品和国家分類的趋势 - 分析和预测(2023-2033)