


 |
市场调查报告书
商品编码
1934899
美国汽车贷款:市场份额分析、行业趋势和统计数据以及成长预测(2026-2031 年)US Auto Loan - Market Share Analysis, Industry Trends & Statistics, Growth Forecasts (2026 - 2031) |
||||||
※ 本网页内容可能与最新版本有所差异。详细情况请与我们联繫。
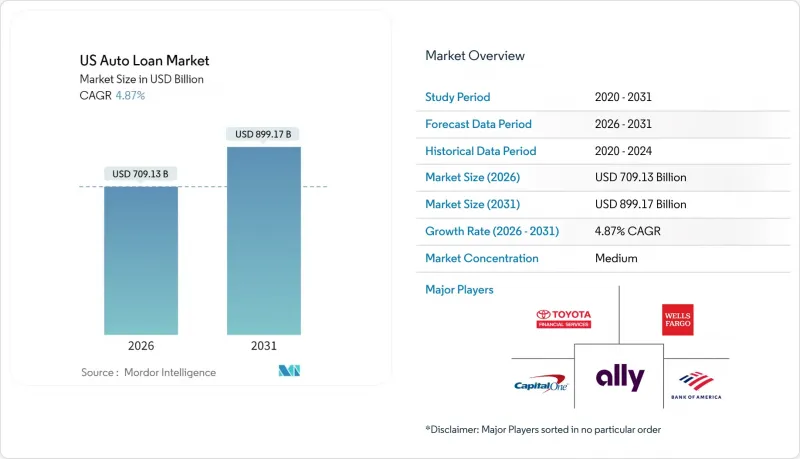
美国汽车贷款市场预计将从 2025 年的 6,762 亿美元成长到 2026 年的 7,091.3 亿美元,到 2031 年达到 8,991.7 亿美元,2026 年至 2031 年的复合年增长率为 4.87%。
儘管信贷标准日益收紧,但不断上涨的车辆价格、下降的联邦基金利率以及快速的数位化,仍然维持了汽车融资的需求。二手车融资仍然是市场主导,因为新车的平均价格已经超出了许多中等收入家庭的负担范围。随着替代性数据驱动型信用评估方法的出现,金融科技参与企业正经历着快速增长,这些方法为信用评级接近优质和次级的借款人提供了更多贷款机会。轻型卡车的普及推高了平均贷款额,而负责最后一公里配送的车队营运商对商用车的需求也不断增加。由于借款人希望在总利息成本上升的情况下仍能控制每月还款额,五年以上的长期贷款变得越来越普遍。
美国汽车贷款市场趋势与分析
车辆价格上涨推高了平均贷款额。
到2024年,平均交易价格将超过48,000美元,迫使借款人将还款期限延长至72个月以上,以确保其偿还能力。虽然贷款机构乐见本金余额增加,因为这能提供终身利息收入,但他们也在累积储备金,以弥补违约时面临的更大损失。价格上涨正加速消费者转向二手车,二手车以大幅折扣提供类似的实用性。半导体等关键零件的供不应求将持续限制新车生产至2025年,加剧价格压力。为了控制风险,贷款机构现在越来越依赖收入验证演算法,当房价收入比超过15%时,这些演算法会发出警告。
贷款执行和筛选流程的数位化
机器学习引擎可在两分钟内做出信贷决策,从而将人工审核成本降低 30%。与人工审核相比,它可将贷款盈利提高 10.2%,同时将逾期率降低 6.8%。贷款机构、分销商和电商平台之间的 API 整合实现了「一站式」购买和贷款流程,显着降低了放弃率。数位化工作流程还有助于扩大地域覆盖范围,使社区银行无需建立分店网路即可在多个州获取客户。在经济低迷时期,云端原生贷款发起流程的成本优势有助于贷款机构抵御竞争对手的折扣,从而保护其净利差。这些平台中的合规模块会随着联邦指南的变更自动更新,从而降低法律风险和审核发现。
联准会升息推高借贷成本
一波又一波的升息浪潮已将汽车贷款的平均年利率(APR)推高至2024年底的7%以上,导致合格的借款人数量减少近五分之一。次级贷款申请人如今面临两位数的利率,迫使许多人转向本地商店和共乘服务。贷款机构的因应措施是将还款期限延长至84个月,但这抑制了借款人的资本积累,并导致贷款价值比(LTV)在发放时超过110%。信用合作社利用低成本存款资金维持低于大型银行的利率,从而刺激了本地再融资需求的成长。经销商则透过增加厂商现金奖励来应对,再次将成本转嫁给汽车製造商的专属融资子公司。
细分市场分析
到2025年,乘用车贷款将占美国汽车贷款市场的86.25%,这主要得益于家庭对私家车的持续依赖。然而,受电子商务扩张和零工经济叫车平台蓬勃发展带来的小包裹量成长的推动,商用车市场预计到2031年将以6.08%的复合年增长率成长。需求主要集中在用于最后一公里配送、宅配服务和行动维修的3-5级卡车和货车上。专业贷款机构正在将远端资讯处理技术纳入贷款合同,以追踪运作週期并促进预防性维护,从而保障抵押品的价值。柴油燃料成本的上涨和排放气体严格的排放法规正在推动车队电气化,这为电池租赁辅助服务创造了一个新的细分市场。
商业贷款承销涵盖个人和企业信用,除了FICO信用评分外,还需要进行现金流量分析。银行利用与小型企业的财务关係,交叉销售设备贷款和企业支票帐户,以确保稳定的存款。金融科技公司利用即时销售点资料的现金流量抓取技术,评估没有传统财务报表的个体经营者的承销资格。提供停工保障的补充保险越来越普遍,即使运作运作也能稳定偿付能力。受郊区和农村地区物流需求成长的推动,美国商业资产汽车贷款市场预计将比乘用车贷款余额增加更快。
到2025年,包括轿车、掀背车和跨界车在内的乘用车将占美国汽车贷款市场的87.35%,而皮卡和小型货车到2031年将以7.05%的复合年增长率增长。由于半导体短缺导致需求延迟,经销商的预订名单一直延续到2025年交付,从而保持了强劲的销售管道。生活方式行销将皮卡定位为家庭用车和週末探险装备,有助于扩大其客户群。为此,汽车製造商旗下的金融公司正在推出按车型分類的残值表,并为选择高残值选配包的购车者提供优惠待遇。
燃油经济法规促使汽车製造商为皮卡配备更小的涡轮增压引擎和混合动力传动系统,虽然略微降低了营运成本,但也使得更高的厂商建议零售价(MSRP)更容易被消费者接受。二手市场分析显示,三年车龄的双排座皮卡仍能维持新车价值的65%至70%,而大型轿车的保值率仅为50%至55%,降低了贷款机构的损失风险。因此,随着风险回报比仍然具有吸引力,皮卡在美国汽车贷款市场的份额自然而然地不断增长。同时,由于季节性使用限制和保险公司的约束,摩托车和三轮车的融资仍然是一个小众市场。
其他福利:
- Excel格式的市场预测(ME)表
- 分析师支持(3个月)
目录
第一章 引言
- 研究假设和市场定义
- 调查范围
第二章调查方法
第三章执行摘要
第四章 市场情势
- 市场概览
- 市场驱动因素
- 车辆价格上涨推高了平均贷款额。
- 贷款筛选和核准流程的数位化
- 电动车销量的成长将推动对新型金融产品的需求。
- 轻型卡车的优势推高了平均购买价格。
- 线上汽车交易平台中的嵌入式金融
- 基于远端资讯处理的风险定价推动次贷市场成长
- 市场限制
- 联准会升息导致借贷成本上升
- 拖欠率和违约率上升
- 出行订阅服务会抑制汽车拥有率。
- 消费者金融保护局(CFPB)的资料共用和收费规定挤压了辅助收入。
- 价值/供应链分析
- 监管环境
- 技术展望
- 波特五力模型
- 买方的议价能力
- 供应商的议价能力
- 新进入者的威胁
- 替代品的威胁
- 竞争对手之间的竞争
第五章 市场规模与成长预测
- 按车辆类型
- 搭乘用车
- 商用车辆
- 按车型
- 摩托车和Scooter
- 乘用车(掀背车、轿车、SUV 等)
- 皮卡和小型货车
- 卡车和巴士
- 其他的
- 依所有权类型
- 新车
- 二手车
- 按提供者类型
- 银行
- 非银行金融机构
- OEM
- 其他类型的服务提供者(金融科技公司)
- 持有期间
- 不到3年
- 3-5年
- 5年或以上
第六章 竞争情势
- 市场集中度
- 策略趋势
- 市占率分析
- 公司简介
- Ally Financial
- Capital One Auto Finance
- Bank of America
- Toyota Financial Services
- Wells Fargo Dealer Services
- Chase Auto
- Santander Consumer USA
- GM Financial
- Ford Credit
- US Bank
- PNC Bank
- Nissan-Infiniti Finance
- TD Auto Finance
- Hyundai Capital America
- Subaru Motors Finance
- Credit Acceptance Corp
- CarMax Auto Finance
- DriveTime
- LendingTree
- Carvana Finance
第七章 市场机会与未来展望
The US Auto Loan Market is expected to grow from USD 676.20 billion in 2025 to USD 709.13 billion in 2026 and is forecast to reach USD 899.17 billion by 2031 at 4.87% CAGR over 2026-2031.
Rising vehicle prices, lower federal funds rates, and rapid digitalization keep demand for vehicle financing steady, even as credit standards tighten. Used-vehicle financing maintains clear leadership because average new-vehicle prices have climbed beyond the reach of many middle-income households. Fintech entrants grow briskly on the back of alternative data underwriting that opens credit access to near-prime and sub-prime borrowers. Commercial vehicles attract heightened interest from fleets serving last-mile delivery, while light-truck popularity pushes average ticket size up. Longer loan tenures above five years are gaining traction as borrowers try to keep monthly instalments manageable despite higher total interest outlays.
US Auto Loan Market Trends and Insights
Rising Vehicle Prices Inflating Average Loan Amounts
Average transaction prices climbed above USD 48,000 in 2024, forcing borrowers to stretch repayment horizons beyond 72 months for affordability[. Lenders welcome the higher principal balances because lifetime interest income rises, yet they also raise reserves as loss severity grows when defaults occur. Higher pricing accelerates the consumer pivot toward used vehicles, where comparable utility is available at sizeable discounts. Supply shortages of critical components such as semiconductors continue to constrain new-vehicle output through 2025, keeping price pressure elevated. Lenders now rely more heavily on income-verification algorithms that flag price-to-income ratios breaching 15% to limit exposure.
Digitization of Loan Origination & Approval Processes
Machine-learning engines deliver credit decisions in under two minutes and cut manual underwriting costs by 30%, producing 10.2% higher loan profitability with 6.8% fewer defaults than human review. API links among lenders, dealerships, and e-commerce portals enable a single-screen "shop-and-finance" journey that slashes abandonment rates. Digital workflows also boost geographic reach, letting regional banks acquire customers several states away without branch infrastructure. During economic slowdowns, the cost advantage of cloud-native origination helps lenders protect net-interest margins against competitive discounting. Compliance modules within these platforms auto-update when federal guidance changes, reducing legal risk and audit findings.
Federal Reserve Rate Hikes Raising Borrowing Costs
Successive rate hikes pushed average auto-loan APRs beyond 7% by late 2024, shrinking the qualified borrower pool by roughly one-fifth. Sub-prime applicants now face double-digit pricing, driving many toward buy-here-pay-here outlets or ride-sharing alternatives. Lenders counter by lengthening terms to 84 months, though that undermines equity build-up and raises loan-to-value ratios above 110% at origination. Credit unions leverage cheaper deposit funding to hold rates lower than large banks, fuelling regional refinancing waves. Dealers respond with bigger manufacturer cash incentives that shift the cost burden back onto OEMs' captive finance subsidiaries.
Other drivers and restraints analyzed in the detailed report include:
- Growth in EV Sales Demanding New Financing Products
- Light-Truck Dominance Boosting Average Ticket Size
- Rising Delinquency & Default Rates
For complete list of drivers and restraints, kindly check the Table Of Contents.
Segment Analysis
Passenger-vehicle loans accounted for 86.25% of the US auto loan market size in 2025 because households still rely heavily on private mobility. Nonetheless, the commercial-vehicle slice is set to expand at a 6.08% CAGR through 2031 as e-commerce accelerates parcel volumes and gig-driving platforms proliferate. Demand concentrates on Class 3-5 trucks and cargo vans used for last-mile delivery, courier services, and mobile workshops. Specialized lenders integrate telematics into loan covenants, tracking duty cycles and encouraging preventive maintenance that preserves collateral value. Rising diesel expenses and emissions regulations encourage fleet electrification, opening an adjacent niche for battery-lease overlays.
Commercial underwriting straddles personal and business credit, requiring cash-flow analyses alongside FICO scores. Banks leverage treasury relationships with small firms to cross-sell equipment loans and business checking accounts, locking in sticky deposits. Fintechs deploy cash-flow scraping of real-time POS data to evaluate sole-proprietor applicants who lack traditional statements. Insurance add-ons that guarantee downtime coverage gain popularity, smoothing payment capacity if trucks sit idle. The US auto loan market size for commercial assets will therefore compound faster than passenger balances as logistics intensity rises across suburban and rural ZIP codes.
Cars-including sedans, hatchbacks, and crossovers-accounted for 87.35% of the US auto loan market size in 2025, yet pickup trucks and small vans will expand at 7.05% CAGR through 2031. Pent-up demand from semiconductor shortages means dealerships carry reservation lists that still roll into 2025 deliveries, sustaining pipeline visibility. Lifestyle marketing frames pickups as family haulers and weekend adventure gear, broadening their demographic appeal. Captive finance units respond with trim-level-specific residual-value tables that reward buyers choosing option packages with historically strong resale.
Fuel economy regulations push OEMs to fit smaller turbo engines and hybrid powertrains into pickups, slightly improving operating costs and making higher MSRPs more palatable. Secondary-market analytics show three-year-old crew-cab trucks retaining 65-70% of their original value, superior to large sedans at 50-55%, reducing lender loss severity. The US auto loan market share of pickups thus grows organically as risk-reward metrics stay attractive. Conversely, motorcycle and three-wheeler financing remains niche, limited by seasonal usage and insurer constraints.
The US Auto Loan Market Report is Segmented by Vehicle Type (Passenger Vehicle, Commercial Vehicle), Vehicle Model (Motorcycles/Scooters, Cars, and More), Ownership (New Vehicles, Used Vehicles), Provider Type (Banks, Non-Banking Financial Institutions, and More), and Tenure (Less Than 3 Years, 3-5 Years, and More). The Market Forecasts are Provided in Terms of Value (USD).
List of Companies Covered in this Report:
- Ally Financial
- Capital One Auto Finance
- Bank of America
- Toyota Financial Services
- Wells Fargo Dealer Services
- Chase Auto
- Santander Consumer USA
- GM Financial
- Ford Credit
- US Bank
- PNC Bank
- Nissan-Infiniti Finance
- TD Auto Finance
- Hyundai Capital America
- Subaru Motors Finance
- Credit Acceptance Corp
- CarMax Auto Finance
- DriveTime
- LendingTree
- Carvana Finance
Additional Benefits:
- The market estimate (ME) sheet in Excel format
- 3 months of analyst support
TABLE OF CONTENTS
1 Introduction
- 1.1 Study Assumptions & Market Definition
- 1.2 Scope of the Study
2 Research Methodology
3 Executive Summary
4 Market Landscape
- 4.1 Market Overview
- 4.2 Market Drivers
- 4.2.1 Rising vehicle prices inflating average loan amounts
- 4.2.2 Digitization of loan origination & approval processes
- 4.2.3 Growth in EV sales demanding new financing products
- 4.2.4 Light-truck dominance boosting average ticket size
- 4.2.5 Embedded finance within online car marketplaces
- 4.2.6 Telematics-based risk pricing unlocking sub-prime growth
- 4.3 Market Restraints
- 4.3.1 Federal-Reserve rate hikes raising borrowing costs
- 4.3.2 Rising delinquency & default rates
- 4.3.3 Mobility subscriptions reducing auto-ownership appetite
- 4.3.4 CFPB data-sharing & fee rules squeezing ancillary income
- 4.4 Value / Supply-Chain Analysis
- 4.5 Regulatory Landscape
- 4.6 Technological Outlook
- 4.7 Porter's Five Forces
- 4.7.1 Bargaining Power of Buyers
- 4.7.2 Bargaining Power of Suppliers
- 4.7.3 Threat of New Entrants
- 4.7.4 Threat of Substitutes
- 4.7.5 Intensity of Competitive Rivalry
5 Market Size & Growth Forecasts (Value)
- 5.1 By Vehicle Type
- 5.1.1 Passenger Vehicle
- 5.1.2 Commercial Vehicle
- 5.2 By Vehicle Model
- 5.2.1 Motorcycles/Scooters
- 5.2.2 Cars (Hatchbacks, Sedans, SUVs, etc.)
- 5.2.3 Pickups and Small Vans
- 5.2.4 Trucks and Buses
- 5.2.5 Others
- 5.3 By Ownership
- 5.3.1 New Vehicles
- 5.3.2 Used Vehicles
- 5.4 By Provider Type
- 5.4.1 Banks
- 5.4.2 Non-Banking Financial Institutions
- 5.4.3 Original Equipment Manufacturers
- 5.4.4 Other Provider Types (Fintech Companies)
- 5.5 By Tenure
- 5.5.1 Less than 3 Years
- 5.5.2 3-5 Years
- 5.5.3 More than 5 years
6 Competitive Landscape
- 6.1 Market Concentration
- 6.2 Strategic Moves
- 6.3 Market Share Analysis
- 6.4 Company Profiles (includes Global Level Overview, Market Level Overview, Core Segments, Financials as available, Strategic Information, Market Rank/Share for Key Companies, Products & Services, and Recent Developments)
- 6.4.1 Ally Financial
- 6.4.2 Capital One Auto Finance
- 6.4.3 Bank of America
- 6.4.4 Toyota Financial Services
- 6.4.5 Wells Fargo Dealer Services
- 6.4.6 Chase Auto
- 6.4.7 Santander Consumer USA
- 6.4.8 GM Financial
- 6.4.9 Ford Credit
- 6.4.10 US Bank
- 6.4.11 PNC Bank
- 6.4.12 Nissan-Infiniti Finance
- 6.4.13 TD Auto Finance
- 6.4.14 Hyundai Capital America
- 6.4.15 Subaru Motors Finance
- 6.4.16 Credit Acceptance Corp
- 6.4.17 CarMax Auto Finance
- 6.4.18 DriveTime
- 6.4.19 LendingTree
- 6.4.20 Carvana Finance
7 Market Opportunities & Future Outlook
- 7.1 White-Space & Unmet-Need Assessment
 汽车金融市场:2026-2032年全球市场预测(依客户类型、贷款形式、信用评级、车辆类型及销售管道)
 汽车金融市场规模、份额、成长及全球产业分析:按类型、应用和地区分類的洞察,2026-2034 年预测人工智慧驱动的残值预测市场:策略洞察与预测(2026-2031)汽车里程融资市场:策略性洞察与预测(2026-2031 年)租赁,2035:未来出行金融
 汽车金融:市场占有率分析、产业趋势与统计、成长预测(2026-2031)全球汽车租赁服务市场规模、份额、趋势和成长分析报告(2026-2034)
 汽车金融市场规模、份额和成长分析(按提供者类型、车辆类型、金融类型和地区划分)-2026-2033年产业预测
 汽车金融市场规模、份额和成长分析(按车龄、用途、分销管道、应用和地区划分)-2026-2033年产业预测
 汽车金融平台市场预测至2032年:按类型、贷款类型、车辆类型、最终用户和地区分類的全球分析