


 |
市场调查报告书
商品编码
1934910
电脑辅助工程:市场占有率分析、产业趋势与统计、成长预测(2026-2031)Computer Aided Engineering - Market Share Analysis, Industry Trends & Statistics, Growth Forecasts (2026 - 2031) |
||||||
※ 本网页内容可能与最新版本有所差异。详细情况请与我们联繫。
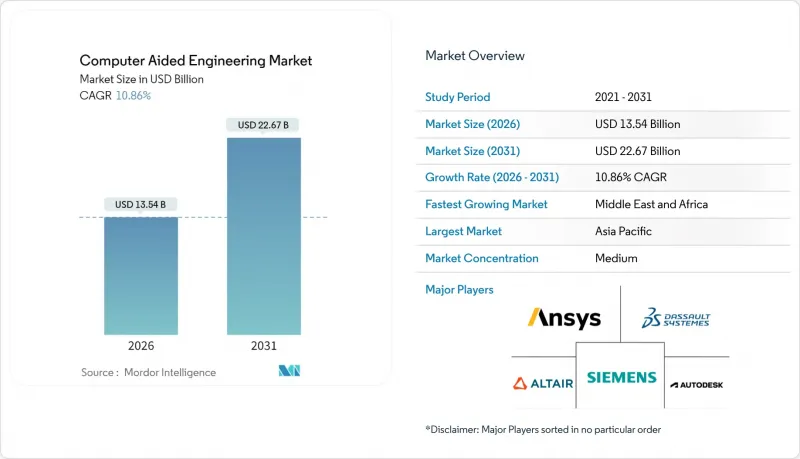
电脑辅助工程市场在 2025 年的价值为 122.1 亿美元,预计到 2031 年将达到 226.7 亿美元,而 2026 年的市值为 135.4 亿美元。
预计在预测期(2026-2031 年)内,复合年增长率将达到 10.86%。
高效能云端基础设施、人工智慧辅助求解器以及日益严格的虚拟原型製作监管要求,正在加速虚拟原型技术在产品开发生命週期中的应用。为了满足更紧迫的上市时间和嵌入式永续性目标,企业正以早期多物理场模拟取代后期实体测试。亚洲在半导体领域的大规模投资和日益增长的汽车电气化方面占据主导地位,并以此推动全球发展。儘管软体授权仍然是主要的收入来源,但随着企业努力提升应对日益复杂的数位双胞胎环境所需的技能,咨询和整合服务也在快速成长。
全球电脑辅助设计 (CAD) 市场趋势与洞察
人工智慧/机器学习驱动的电动车轻量化衍生设计在欧盟和中国的应用
自动车メーカーは、衝突安全性を损なうことなく车両重量を削减するため、生成アルゴリズムと有限要素ソルバーを组み合わせています。MeshWorks社は、バッテリーモジュールの开発期间を最大70%短缩し、従来は非现実的だったトポロジーの检验を可能にしています。研究によれば、10%の质量削减は6~8%のエネルギー消费改善につながり、これは积极的なゼロエミッション规制を推进する市场において极めて重要です。欧州と中国では、补助金制度や车种平均CO2排放量目标により軽量构造が竞合上の必须要件となっており、その影响はさらに拡大しています。AI対応シミュレーションテンプレートを导入するサプライヤーは、型式认定サイクルの短缩と多分野チームの効果的な活用を期待しています。
促进航太领域虚拟原型製作的监管(FAA/EASA)
美国联邦航空管理局 (FAA) 2024 年动力升降舵规则将接受模拟资料作为认证证据,从而免除高成本的实体测试。同时,欧洲航空安全局 (EASA) 也积极推广数位化工程,以加快推进系统和结构的核准。诸如 Millennium M1 CFD超级电脑等整合软硬体平台,将气动动态分析的时间从数週缩短至数小时,从而提高了工程效率,满足更紧迫的专案进度要求。结果是:民用和国防领域的非经常性支出减少,服务週期缩短。
按使用收费许可模式为二级汽车零件製造商带来不确定性
浮动收费会为零件製造商带来规划风险,因为他们的模拟需求高峰出现在OEM专案週期的后期。学术研究表明,由于资源限制和成本不确定性,中小企业在采用预测分析方面落后于大型企业。除非供应商统一订阅等级或实施消费上限,否则中小企业可能会推迟全面迁移,从而可能抑制整个电脑辅助工程市场的成长。
细分市场分析
软体业务将占2025年总收入的72.85%,这反映了求解器创新和介面升级在支援CAE市场方面发挥的核心作用。 Ansys 2024 R1版本引进了模组化工作空间和AI赋能的资料管道,展现了其对工作流程效率的持续投入。扩展的实体库和GPU加速功能确保了现有授权的持续续期,即便新进入者正在蚕食专业市场份额。服务业务虽然规模较小,但正以12.46%的复合年增长率快速成长,因为企业在多物理场模拟、云端协作和AI模型训练方面面临知识缺口。
日益增长的复杂性导致标准开箱即用部署与最佳实践之间的差距越来越大。顾问公司现在将特定领域的范本(例如电池热失控分析)打包在一起,以简化计划推出。对于那些从传统有限元素分析工具迁移到整合数位双胞胎平台的组织而言,这种咨询服务尤其重要。因此,业务收益在整个电脑辅助工程市场中所占的份额越来越大,尤其是在内部专业人才匮乏的新兴经济体。
由于有限元素分析在结构、热学和电磁学问题上的广泛应用,预计到2025年,其在电脑辅助工程(CAE)市场份额将达到35.22%。网格自动化和材料模型的不断改进正在提升高精度组装的收敛速度。衍生设计迭加利用拓朴最佳化网格来减少飞机支架中的金属用量,从而实现两位数的减重。
计算流体力学(CFD) 是成长最快的领域,年复合成长率 (CAGR) 高达 11.74%,主要得益于电子装置热瓶颈和空气动力学优化的融合。 Cadence 的基于 GPU 的超级电脑Millennium M1 在非定常流动模拟方面实现了数量级的速度提升,从而能够在设计週期内进行高解析度分析。随着人工智慧框架能够利用稀疏的 CFD 训练集预测流场,供应商预计其在流程工业和可再生能源设计领域的应用将更加广泛。
区域分析
亚洲将引领潮流,预计2025年将占全球收入的38.12%,主要得益于半导体产业的扩张和国家支持的製造业数位化。中国为实现自主可控而推出的LICOMK++海洋建模等创新技术,凸显了国内高效能运算能力的显着提升(scmp.com)。印度的国家超级计算计划和韩国的晶圆厂投资进一步支撑了该地区两位数的复合年增长率。该地区庞大的电子供应链也持续推动对多物理场CFD授权的需求。
北美位居第二,主导美国国防现代化和航太数位双胞胎领域的活跃发展。联邦政府对清洁能源基础设施的激励措施推动了风力发电机和电网储能计划对结构和热模拟技术的需求。云端超大规模资料中心业者的接近性为使用者提供了弹性运算资源,加速了人工智慧在日常业务流程中的应用。
欧洲在汽车和民用航空模拟领域保持着强大的地位。清洁航空领域对氢动力系统和超高效机身结构的资金投入,正推动下一代运算流体动力学(CFD)和复合材料模型求解器的预算分配。强制性的全生命週期碳计量法规,正在推动数位双胞胎在预测性维护和燃油消耗优化方面的应用。同时,中东地区实现了12.17%的最高区域复合年增长率,其中一家炼油厂采用能源优化孪生技术,将计划外停机时间减少了35%。
其他福利:
- Excel格式的市场预测(ME)表
- 3个月的分析师支持
目录
第一章 引言
- 研究假设和市场定义
- 调查范围
第二章调查方法
第三章执行摘要
第四章 市场情势
- 市场概览
- 市场驱动因素
- 将人工智慧/机器学习驱动的衍生设计应用于欧盟和中国的电动车轻量化
- 促进航太领域虚拟原型製作的监管(FAA/EASA)
- 云端原生高效能运算存取推动亚洲中小企业采用
- 5nm 以下半导体的热问题及多物理场 CFD 的必要性
- 中东炼油厂利用永续性主导的数位双胞胎进行能源优化
- 国防现代化(高超音速技术)推动美国和澳洲的流固耦合模拟
- 市场限制
- 二级汽车供应商按使用收费许可的不确定性
- 缺乏检验的动态模型限制了外科器械的应用
- 中国对高效能运算晶片的出口管制限制了其类比规模。
- 印度多物理场耦合技术的学习曲线陡峭
- 价值/供应链分析
- 监理展望
- 技术展望
- 投资分析
- 波特五力模型
- 供应商的议价能力
- 买方的议价能力
- 新进入者的威胁
- 替代品的威胁
- 竞争对手之间的竞争
第五章 市场规模与成长预测
- 按组件
- 软体
- 服务
- 依软体类型
- 有限元素分析
- 计算流体力学
- 多体动力学
- 最佳化与仿真
- 透过部署
- 本地部署
- 基于云端的
- 按公司规模
- 大公司
- 小型企业
- 按最终用户行业划分
- 车
- 航太/国防
- 电子电器设备
- 工业设备
- 卫生保健
- 能源与公共产业
- 其他的
- 按地区
- 北美洲
- 我们
- 加拿大
- 墨西哥
- 南美洲
- 巴西
- 南美洲其他地区
- 欧洲
- 德国
- 英国
- 法国
- 义大利
- 西班牙
- 其他欧洲
- 亚太地区
- 中国
- 日本
- 印度
- 韩国
- 东南亚
- 澳洲和纽西兰
- 亚太其他地区
- 中东和非洲
- 沙乌地阿拉伯
- 阿拉伯聯合大公国
- 土耳其
- 南非
- 其他中东和非洲地区
- 北美洲
第六章 竞争情势
- 市场集中度
- 策略趋势
- 市占率分析
- 公司简介
- ANSYS Inc.
- Dassault Systemes SE
- Siemens Digital Industries Software
- Altair Engineering Inc.
- Hexagon AB(MSC Software)
- Autodesk Inc.
- ESI Group
- PTC Inc.
- COMSOL AB
- Bentley Systems Inc.
- SimScale GmbH
- NUMECA International
- EnginSoft SpA
- BETA CAE Systems(Cadence)
- Alibre LLC
- Flow Science Inc.
- AVEVA Group plc
- CD-adapco(Siemens)
- Ceetron AS(Tech Soft 3D)
- Rescale Inc.
- Materialise
- NVIDIA
第七章 市场机会与未来展望
The computer aided engineering market was valued at USD 12.21 billion in 2025 and estimated to grow from USD 13.54 billion in 2026 to reach USD 22.67 billion by 2031, at a CAGR of 10.86% during the forecast period (2026-2031).
High-performance cloud infrastructure, AI-assisted solvers, and stricter regulatory expectations for virtual prototyping are accelerating adoption across product-development lifecycles. Companies are replacing late-stage physical testing with early-stage multiphysics simulation to meet tighter launch windows and embedded sustainability targets. Asia's leadership, sustained by large-scale semiconductor investments and rising automotive electrification, underpins global momentum. Software licences remain the principal revenue generator, yet advisory and integration services are surging as enterprises struggle to keep pace with the skills required for increasingly complex digital-twin environments.
Global Computer Aided Engineering Market Trends and Insights
AI/ML-Driven Generative Design for EV Lightweighting in EU & China
Automakers are coupling generative algorithms with finite-element solvers to reduce curb weight without sacrificing crashworthiness. MeshWorks shows development-time cuts of up to 70% for battery modules, letting engineers test previously impractical topologies.Studies demonstrate 10% mass reductions translating into 6-8% energy-consumption improvements-vital in markets pushing aggressive zero-emission mandates. The impact is magnified in Europe and China, where subsidy structures and fleet-average CO2 targets make lightweight architectures a competitive requirement. Suppliers integrating AI-ready simulation templates expect shorter homologation cycles and better utilisation of multi-disciplinary teams.
Regulatory Push for Virtual Prototyping in Aerospace (FAA/EASA)
The FAA's 2024 powered-lift aircraft rule recognises simulation data for certification evidence, shrinking costly full-scale tests. Parallel initiatives at EASA encourage digital engineering to accelerate propulsion and structure approvals. Hardware-software platforms such as the Millennium M1 CFD Supercomputer compress multi-week aero-thermal studies into hours, aligning engineering throughput with tighter programme timetables. The result is lower non-recurring expenditure and faster entry into service across both commercial and defence segments.
Pay-per-Use Cloud Licensing Uncertainty for Tier-2 Auto Suppliers
Variable billing creates planning risk for parts makers whose simulation demand peaks late in OEM programme cycles. Academic reviews show SMEs lag larger peers in predictive-analytics uptake because of resource constraints and cost opacity. Until vendors standardise subscription tiers or introduce consumption caps, smaller firms may delay full migration, tempering overall computer aided engineering market expansion.
Other drivers and restraints analyzed in the detailed report include:
- Cloud-Native HPC Access Fuelling SME Adoption in Asia
- Sub-5 nm Semiconductor Thermal Challenges Requiring Multiphysics CFD
- Validation Gaps in Bio-mechanical Models Limiting Surgical Device Uptake
For complete list of drivers and restraints, kindly check the Table Of Contents.
Segment Analysis
The software segment contributed 72.85% of 2025 revenue, reflecting its centrality to solver innovation and interface upgrades that underpin the computer-aided engineering market. Ansys' 2024 R1 release rolled out modular workspaces and AI-ready data pipelines, illustrating steady investment in workflow productivity. Expanded physics libraries and GPU acceleration lock in entrenched licence renewals, even as newer entrants chip away in specialist niches. Services, though smaller, are scaling faster at 12.46% CAGR as enterprises confront knowledge gaps in multiphysics, cloud orchestration, and AI model training.
Rising complexity is widening the divide between standard out-of-the-box deployment and best-practice adoption. Advisory firms now bundle domain-specific templates-such as battery thermal run-away analyses-streamlining project kick-offs. This consultative layer is particularly valuable to organisations transitioning from legacy finite-element tools to integrated digital-twin platforms. Consequently, services revenue is capturing a larger portion of total computer aided engineering market size, especially within emerging economies where in-house expertise remains scarce.
Finite element analysis accounted for 35.22% of the 2025 computer-aided engineering market share, sustained by broad applicability across structural, thermal, and electromagnetic problems. Continuous improvements in mesh automation and material models enable faster convergence for high-fidelity assemblies. Generative design overlays now exploit topology-optimised lattices to reduce metal volumes in aircraft brackets, achieving double-digit weight savings.
Computational fluid dynamics is the fastest-growing category at 11.74% CAGR as electronics thermal bottlenecks and aerodynamic optimisation converge. Cadence's GPU-based Millennium M1 supercomputer demonstrates order-of-magnitude speed-ups for unsteady flow simulations, unlocking high-resolution studies within design-cycle windows. As AI frameworks predict flowfields with sparse CFD training sets, vendors anticipate broader uptake in process industries and renewable-energy design.
The Computer Aided Engineering Market is Segmented by Component (Software, Services), Software Type (Finite Element Analysis, Computational Fluid Dynamics, and More), Deployment (On-Premise, Cloud Based), Organization Size (Large Enterprises, Small and Medium Enterprises), End-User Vertical (Automotive, Aerospace and Defense, and More), and by Geography. The Market Forecasts are Provided in Terms of Value (USD).
Geography Analysis
Asia led with 38.12% of 2025 revenue, buoyed by semiconductor expansion and state-backed manufacturing digitalisation. China's drive for self-reliance spurred breakthroughs such as LICOMK++ ocean modelling, underscoring domestic HPC capability growth scmp.com. India's National Supercomputing Mission and South Korea's fab investments further support a double-digit regional CAGR. The region's outsized electronics supply chain keeps multiphysics CFD licences in sustained demand.
North America ranked second, dominated by the United States' activity in defence modernisation and aerospace digital twins. Federal incentives for clean-energy infrastructure amplify demand for structural and thermal simulation in wind-turbine and grid-storage projects. Cloud-hyperscaler proximity affords users elastic compute headroom, accelerating AI integration within day-to-day workflows.
Europe retains strong footholds in automotive and commercial aviation simulation. Clean-Aviation funding for hydrogen propulsion and ultra-efficient airframes steers budgets toward next-generation CFD and composite-model solvers. Regulations mandating lifecycle carbon accounting motivate digital-twin rollouts for predictive maintenance and fuel-burn optimisation. Meanwhile, the Middle East posts the highest regional CAGR at 12.17% as refiners deploy energy-optimisation twins that cut unplanned downtime by 35%.
- ANSYS Inc.
- Dassault Systemes SE
- Siemens Digital Industries Software
- Altair Engineering Inc.
- Hexagon AB (MSC Software)
- Autodesk Inc.
- ESI Group
- PTC Inc.
- COMSOL AB
- Bentley Systems Inc.
- SimScale GmbH
- NUMECA International
- EnginSoft SpA
- BETA CAE Systems (Cadence)
- Alibre LLC
- Flow Science Inc.
- AVEVA Group plc
- CD-adapco (Siemens)
- Ceetron AS (Tech Soft 3D)
- Rescale Inc.
- Materialise
- NVIDIA
Additional Benefits:
- The market estimate (ME) sheet in Excel format
- 3 months of analyst support
TABLE OF CONTENTS
1 INTRODUCTION
- 1.1 Study Assumptions and Market Definition
- 1.2 Scope of the Study
2 RESEARCH METHODOLOGY
3 EXECUTIVE SUMMARY
4 MARKET LANDSCAPE
- 4.1 Market Overview
- 4.2 Market Drivers
- 4.2.1 Integration of AI/ML-Driven Generative Design for EV Lightweighting in EU and China
- 4.2.2 Regulatory Push for Virtual Prototyping in Aerospace (FAA/EASA)
- 4.2.3 Cloud-Native HPC Access Fuelling SME Adoption in Asia
- 4.2.4 Sub-5 nm Semiconductor Thermal Challenges Requiring Multiphysics CFD
- 4.2.5 Sustainability-Led Digital Twins for Energy Optimisation in Middle East Refineries
- 4.2.6 Defence Modernisation (Hypersonics) Driving FSI Simulations in US and Australia
- 4.3 Market Restraints
- 4.3.1 Pay-per-Use Cloud Licensing Uncertainty for Tier-2 Auto Suppliers
- 4.3.2 Validation Gaps in Bio-mechanical Models Limiting Surgical Device Uptake
- 4.3.3 Export-Control Curbs on HPC Chips Capping Simulation Scale in China
- 4.3.4 Steep Learning Curve for Multiphysics Coupling in India
- 4.4 Value / Supply-Chain Analysis
- 4.5 Regulatory Outlook
- 4.6 Technological Outlook
- 4.7 Investment Analysis
- 4.8 Porter's Five Forces
- 4.8.1 Bargaining Power of Suppliers
- 4.8.2 Bargaining Power of Buyers
- 4.8.3 Threat of New Entrants
- 4.8.4 Threat of Substitutes
- 4.8.5 Intensity of Competitive Rivalry
5 MARKET SIZE AND GROWTH FORECASTS (VALUE)
- 5.1 By Component
- 5.1.1 Software
- 5.1.2 Services
- 5.2 By Software Type
- 5.2.1 Finite Element Analysis
- 5.2.2 Computational Fluid Dynamics
- 5.2.3 Multibody Dynamics
- 5.2.4 Optimisation and Simulation
- 5.3 By Deployment
- 5.3.1 On-Premise
- 5.3.2 Cloud-Based
- 5.4 By Organisation Size
- 5.4.1 Large Enterprises
- 5.4.2 Small and Medium Enterprises
- 5.5 By End-User Vertical
- 5.5.1 Automotive
- 5.5.2 Aerospace and Defence
- 5.5.3 Electronics and Electrical
- 5.5.4 Industrial Equipment
- 5.5.5 Healthcare
- 5.5.6 Energy and Utilities
- 5.5.7 Others
- 5.6 By Geography
- 5.6.1 North America
- 5.6.1.1 United States
- 5.6.1.2 Canada
- 5.6.1.3 Mexico
- 5.6.2 South America
- 5.6.2.1 Brazil
- 5.6.2.2 Rest of South America
- 5.6.3 Europe
- 5.6.3.1 Germany
- 5.6.3.2 United Kingdom
- 5.6.3.3 France
- 5.6.3.4 Italy
- 5.6.3.5 Spain
- 5.6.3.6 Rest of Europe
- 5.6.4 APAC
- 5.6.4.1 China
- 5.6.4.2 Japan
- 5.6.4.3 India
- 5.6.4.4 South Korea
- 5.6.4.5 South-East Asia
- 5.6.4.6 Australia and New Zealand
- 5.6.4.7 Rest of APAC
- 5.6.5 Middle East and Africa
- 5.6.5.1 Saudi Arabia
- 5.6.5.2 United Arab Emirates
- 5.6.5.3 Turkey
- 5.6.5.4 South Africa
- 5.6.5.5 Rest of Middle East and Africa
- 5.6.1 North America
6 COMPETITIVE LANDSCAPE
- 6.1 Market Concentration
- 6.2 Strategic Moves
- 6.3 Market Share Analysis
- 6.4 Company Profiles (includes Global and Market Overview, Core Segments, Financials, Strategic Info, Market Rank/Share, Products and Services, Recent Developments)
- 6.4.1 ANSYS Inc.
- 6.4.2 Dassault Systemes SE
- 6.4.3 Siemens Digital Industries Software
- 6.4.4 Altair Engineering Inc.
- 6.4.5 Hexagon AB (MSC Software)
- 6.4.6 Autodesk Inc.
- 6.4.7 ESI Group
- 6.4.8 PTC Inc.
- 6.4.9 COMSOL AB
- 6.4.10 Bentley Systems Inc.
- 6.4.11 SimScale GmbH
- 6.4.12 NUMECA International
- 6.4.13 EnginSoft SpA
- 6.4.14 BETA CAE Systems (Cadence)
- 6.4.15 Alibre LLC
- 6.4.16 Flow Science Inc.
- 6.4.17 AVEVA Group plc
- 6.4.18 CD-adapco (Siemens)
- 6.4.19 Ceetron AS (Tech Soft 3D)
- 6.4.20 Rescale Inc.
- 6.4.21 Materialise
- 6.4.22 NVIDIA
7 MARKET OPPORTUNITIES AND FUTURE OUTLOOK
- 7.1 White-Space and Unmet-Need Assessment
 电脑辅助工程市场分析及预测(至2035年):依类型、产品类型、服务、技术、组件、应用、最终用户、模组、功能及部署类型划分
 全球电脑辅助工程(CAE)市场:市场规模、占有率、成长率、行业分析、依类型、应用和地区划分的分析以及未来预测(2026-2034)
 电气计算机辅助设计市场-全球产业规模、份额、趋势、机会和预测:按组件、应用、垂直行业、地区和竞争格局划分,2021-2031年
 电脑辅助工程市场规模、份额和趋势分析报告:按部署方式、组件、最终用途、地区和细分市场预测(2026-2033 年)
 电脑辅助工程市场规模、份额和成长分析(按组件、部署模式、最终用途和地区划分)-2026-2033年产业预测
 全球电气设计软体市场:竞争分析、区域机会(2025-2031)
 电脑支援工程的全球市场 (~2035年):零组件·部署模型·模拟类型·技术·终端用户产业·各地区
 电脑辅助工程市场(按服务提供、技术、部署、应用、最终用途产业和公司规模)—2025 年至 2030 年全球预测
 电脑辅助工程市场规模及预测 2021 - 2031、全球及地区份额、趋势及成长机会分析报告涵盖范围:按组件、软体类型、部署模型、最终用途行业和地理划分
 全球电脑辅助工程 (CAE) 市场(按产品、部署模式、组织规模、垂直行业和地区分类)- 预测至 2030 年