


 |
市场调查报告书
商品编码
1937309
硅砂:市占率分析、产业趋势与统计、成长预测(2026-2031)Silica Sand - Market Share Analysis, Industry Trends & Statistics, Growth Forecasts (2026 - 2031) |
||||||
※ 本网页内容可能与最新版本有所差异。详细情况请与我们联繫。
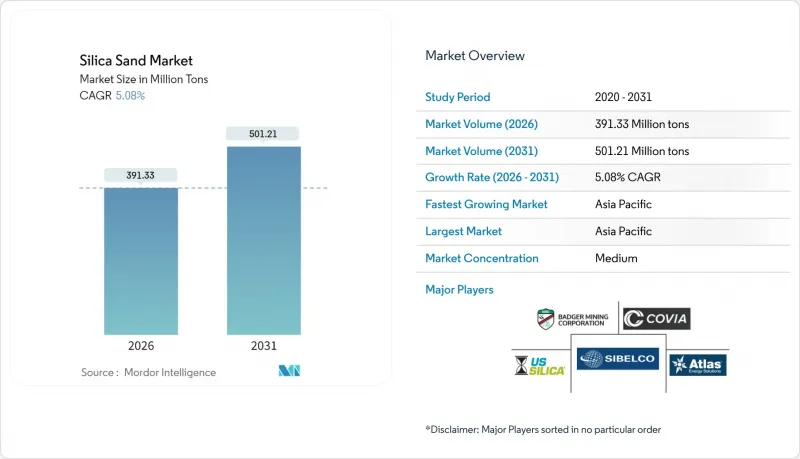
预计硅砂市场将从 2025 年的 3.7242 亿吨成长到 2026 年的 3.9133 亿吨,到 2031 年将达到 5.121 亿吨,2026 年至 2031 年的复合年增长率为 5.08%。
这一上涨趋势主要源自于该矿物在高纯度玻璃、半导体晶片、水力压裂支撑剂以及各种工业填充材中的核心作用。超白太阳能玻璃的溢价、页岩油井数量的持续增长以及半导体製造厂向新地区的扩张,都在支撑着市场需求,即便是在环境法规日益严格的背景下也是如此。供应链正逐步走向区域化,盆地内矿山与下游企业的合作抵消了物流成本,并最大限度地减少了审批延误的影响。竞争差异化越来越依赖品质认证、粉尘减排技术和可追溯性系统,这些都有助于买家管理健康和安全合规性。
全球硅砂市场趋势及展望
对高透明度平板玻璃和太阳能玻璃的需求不断增长
太阳能玻璃工厂需要二氧化硅含量达到99.99%或以上的原料,而随着中国太阳能电站的扩张导致传统浮法玻璃生产线的供应趋紧,现货价格已接近每吨55美元。加拿大优质砂业等新参与企业正计划建造垂直整合的熔炉,以满足到2027年超过100吉瓦的面板生产需求。跨国浮法玻璃製造商正透过投资约1.8亿美元维修熔炉,以提高能源效率并确保高纯度砂的长期供应合同,来印证二氧化硅砂市场的发展趋势。这些资本投资表明,随着製造商寻求符合ISO 9001认证的低碳玻璃生产技术,高品质二氧化硅砂仍将是重要的原料供应来源。
页岩井压裂砂用量快速增加
由于井长和段数的增加,水平井的砂耗量较2013年平均增加了1060%。湿砂物流使柴油消耗量减少了90%,每口井节省了10万至30万美元的成本。这加速了盆地内棕砂的普及,降低了交付成本的波动性。美国职业安全与健康管理局(OSHA)关于可吸入性二氧化硅的规定推动了新型除尘罩和封闭式输送机的应用,在硅砂市场形成了基于标准的采购趋势。这使得获得认证的供应商更具优势。
环境许可审核难度日益增加
美国矿山安全与健康管理局 (MSHA) 的二氧化硅法规于 2024 年 6 月生效,将允许暴露浓度降低至 50 μg/m³,并增加了强制性健康筛检,这增加了新矿场和现有矿场的合规成本。在曼尼托巴省,由于监管机构要求进行更详细的水文地质研究,Sio Silica 的矿场计画仍然停滞不前。欧洲化学品管理局 (ECHA) 的立法草案建议加强职场暴露标准,这可能会导致缺乏闭式处理迴路的小规模采石场减产。预计这一高门槛将抑制新计画,并导致生产集中在拥有完善的 ESG 报告框架的营运商手中。
细分市场分析
在二氧化硅(SiO2)含量达99.5%或以上的高纯度石英砂市场中,年复合成长率(CAGR)最高,达6.19%。超高纯度石英砂是半导体坩埚、太阳能浮法玻璃和锂离子电池隔膜等产品的基础材料。 Sibelco公司在Spruce Pine的扩建计画以及澳洲石英砂集团(Australian Silica Quartz Group)为实现99.997%纯度所做的努力,都清楚地表明了高附加价值生产能力的提升。
标准级硅砂(二氧化硅含量95-99.5%)仍将是主要来源,预计到2025年将占硅砂市场份额的47.58%。其需求主要来自铸造模具、建筑骨材和过滤介质。将废弃物提纯至99.99%纯度的创新技术,例如铁矿石精炼,既能带来永续性,又能促进收入增长;而低纯度硅砂(低于95%)的应用将主要局限于区域性预拌混凝土和回填土。
本硅砂报告依纯度等级(高纯度:99.5% SiO2 或以上;标准:低纯度 95-99.5%)、终端用户产业(玻璃製造、铸造、化学製造、建筑、油漆和涂料、陶瓷和耐火材料、过滤、石油和天然气以及其他用户产业)和地区(亚太地区进行细分、中国和欧洲)。
区域分析
亚太地区将占全球硅产量的40.21%,预计将以6.27%的复合年增长率成长,这主要得益于中国太阳能产业的蓬勃发展、印度城市交通走廊的建设以及印尼价值457.4亿美元的硅下游产业计画。昆士兰的硅产量预计到2030年将成长两倍,这主要得益于澳洲弗拉特里角矿(二氧化硅含量99.93%)的开采。
北美地区的消费主要受页岩支撑剂的驱动。预计2024年至2025年,美国将出口价值8.09亿美元的硅砂,其中加拿大和日本是主要买家。墨西哥製造业的蓬勃发展推动了进口,这得益于美墨加协定(USMCA)的贸易关係以及其与美国供应商的地理接近性。该地区正面临日益严格的法规环境,新的矿山安全与健康管理局(MSHA)硅砂法规将于2024年6月生效,该法规强制要求实施全面的暴露监测和医疗监护计画。
由于建筑需求放缓,欧洲硅砂产业面临挑战,但专业细分市场仍维持成长动能。欧洲化学品管理局提出的暴露限值预计将使供应集中在北欧地区,因为该地区的密封工艺已是标准流程。中东和非洲将推动计划和玻璃容器的需求,而南美洲则因汽车供应链的调整和新的关键矿产政策而更具吸引力。
其他福利:
- Excel格式的市场预测(ME)表
- 3个月的分析师支持
目录
第一章 引言
- 研究假设和市场定义
- 调查范围
第二章调查方法
第三章执行摘要
第四章 市场情势
- 市场概览
- 市场驱动因素
- 对高清晰度平板玻璃和太阳能玻璃的需求不断增长
- 页岩井压裂砂用量快速增加
- 用于半导体製造的高纯度二氧化硅的生长
- 基础设施奖励策略导致混凝土消耗增加
- 利用人工智慧优化铸造工艺
- 市场限制
- 取得环境许可证的难度正在急剧增加。
- 快速替换容器玻璃中的回收玻璃屑。
- 新型低石英支撑剂(陶瓷、树脂涂层)
- 价值链分析
- 波特五力模型
- 供应商的议价能力
- 买方的议价能力
- 新进入者的威胁
- 替代品的威胁
- 竞争程度
第五章 市场规模及成长预测(价值及数量)
- 按纯度水平
- 高纯度(SiO2含量99.5%或以上)
- 标准(95-99.5%)
- 低纯度(低于95%)
- 按最终用户行业划分
- 玻璃製造
- 铸件
- 化学製造
- 建造
- 油漆和涂料
- 陶瓷和耐火材料
- 过滤
- 石油和天然气
- 其他终端用户产业
- 按地区
- 亚太地区
- 中国
- 印度
- 日本
- 韩国
- 印尼
- 澳洲
- 亚太其他地区
- 北美洲
- 我们
- 加拿大
- 墨西哥
- 欧洲
- 德国
- 英国
- 义大利
- 法国
- 俄罗斯
- 其他欧洲
- 南美洲
- 巴西
- 阿根廷
- 南美洲其他地区
- 中东和非洲
- 沙乌地阿拉伯
- 阿拉伯聯合大公国
- 南非
- 其他中东和非洲地区
- 亚太地区
第六章 竞争情势
- 市场集中度
- 策略趋势
- 市占率(%)/排名分析
- 公司简介
- Atlas Energy Solutions Inc.(Hi-Crush Inc.)
- Badger Mining Corporation
- Chongqing Changjiang River Moulding Material Group Co. Ltd
- COVIA HOLDINGS LLC
- Euroquarz GmbH
- Gulf Coast Sand
- JFE Mineral & Alloy Company Ltd
- Mitsubishi Corporation
- PUM GROUP
- Sibelco
- Sil Industrial Minerals
- Source Energy Services
- Superior Silica Sands
- TOCHU CORPORATION
- US Silica(Apollo Global Management)
第七章 市场机会与未来展望
The Silica Sand market is expected to grow from 372.42 Million tons in 2025 to 391.33 Million tons in 2026 and is forecast to reach 501.21 Million tons by 2031 at 5.08% CAGR over 2026-2031.
The upward trajectory is tied to the central role the mineral plays in high-purity glass, semiconductor wafers, hydraulic fracturing proppants, and a wide array of industrial fillers. Price premiums for ultra-clear solar glass, persistent growth in shale well counts, and the spread of semiconductor fabs into new regions are together sustaining demand even as environmental regulations tighten. Supply chains are gradually localizing, with in-basin mines and downstream alliances offsetting logistics costs and minimizing exposure to permitting delays. Competitive differentiation is increasingly anchored in quality certification, dust-mitigation technology, and traceability systems that help buyers manage health-and-safety compliance.
Global Silica Sand Market Trends and Insights
Rising Demand for Premium-Clarity Flat and Solar Glass
Solar-grade glass plants require feedstock exceeding 99.99% SiO2, pushing spot prices toward USD 55 per ton as China's photovoltaic capacity additions tighten availability for conventional float glass lines. Canadian Premium Sand and other entrants plan vertically integrated furnaces to satisfy more than 100 GW of panel output by 2027. Multinational float-glass makers have earmarked close to USD 180 million for furnace retrofits that boost energy efficiency while locking in long-term offtake contracts for high-purity sand, underscoring trends in the silica sand market. These capital commitments confirm that premium silica will remain a supply-critical input while manufacturers pursue low-carbon glass production techniques certified under ISO 9001 standards.
Surging Frac-Sand Intensity per Shale Well
Individual horizontal wells now average 1,060% more sand than in 2013, driven by longer laterals and higher stage counts. Wet-sand logistics cut diesel usage by 90% and shave USD 100,000-300,000 per well, accelerating the switch to in-basin brown sand that reduces delivered-cost volatility. OSHA respirable-silica rules are spurring adoption of new dust-capture hoods and enclosed conveyors trends in the silica sand market locking in specification-driven procurement that favors certified suppliers.
Escalating Environmental Permitting Hurdles
The MSHA silica rule that took effect in June 2024 lowered permissible exposure to 50 µg/m3 and added mandatory medical surveillance, raising compliance costs for both new and legacy pits. In Manitoba, Sio Silica's proposed mine remains stalled after regulators called for a deeper hydro-geological review. European Chemicals Agency drafts signal tighter workplace exposure requirements that could cut output at smaller quarries lacking enclosed processing circuits. The higher hurdle rate is expected to curtail grassroots projects and concentrate production among operators with full ESG reporting frameworks.
Other drivers and restraints analyzed in the detailed report include:
- Growth in High-Purity Silica for Semiconductor Fabs
- Infrastructure Stimulus-Led Concrete Consumption
- Rapid Substitution by Recycled Cullet in Container Glass
For complete list of drivers and restraints, kindly check the Table Of Contents.
Segment Analysis
High-purity grades above 99.5% SiO2 account for 6.19% CAGR, the fastest within the silica sand market. Ultra-pure sand provides the substrate for semiconductor crucibles, solar float glass, and lithium-ion battery separators. Sibelc o's Spruce Pine expansion and Australian Silica Quartz Group's push to 99.997% purity illustrate the scale-up of value-added capacity.
Standard-grade material ranging from 95-99.5% SiO2 remains the volume anchor, holding 47.58% of the 2025 silica sand market share. Demand stems from foundry molds, construction aggregates, and filter media. Innovations such as iron-ore tailings purification that lifts rejects to 99.99% purity blend sustainability with revenue upside, though low-purity sand below 95% SiO2 is largely restricted to local ready-mix and backfill usage.
The Silica Sand Report is Segmented by Purity Level (High-Purity More Than 99. 5% SiO2, Standard 95-99. 5%, Low-Purity Less Than 95%), End-User Industry (Glass Manufacturing, Foundry, Chemical Production, Construction, Paints and Coatings, Ceramics and Refractories, Filtration, Oil and Gas, and Other End-User Industries), and Geography (Asia-Pacific, North America, Europe, South America, and Middle-East and Africa).
Geography Analysis
Asia-Pacific commands 40.21% of global volume and is projected to grow at a 6.27% CAGR, driven by China's photovoltaic boom, India's urban transport corridors, and Indonesia's USD 45.74 billion silicon-downstream agenda. Australia's Cape Flattery mine, grading 99.93% SiO2, positions Queensland to triple output before 2030.
North America's consumption is propelled by shale proppant at the core. The United States exported USD 809 million worth of silica sand during 2024-2025, with Canada and Japan the top buyers. Mexico's growing manufacturing sector drives imports, benefiting from USMCA trade relationships and proximity to U.S. suppliers. The region's regulatory environment intensifies with new MSHA silica rules effective June 2024, requiring comprehensive exposure monitoring and medical surveillance programs.
Europe faces challenging conditions in silica sand industry with construction demand slowdowns affecting traditional silica sand applications, though specialized segments maintain growth momentum. The European Chemicals Agency's draft exposure limits may concentrate supply in Northern Europe where enclosed processing is already standard. Middle East and Africa draw on infrastructure projects and glass container demand, while South America's allure lies in automotive supply-chain shifts and new critical-minerals policies.
- Atlas Energy Solutions Inc. (Hi-Crush Inc.)
- Badger Mining Corporation
- Chongqing Changjiang River Moulding Material Group Co. Ltd
- COVIA HOLDINGS LLC
- Euroquarz GmbH
- Gulf Coast Sand
- JFE Mineral & Alloy Company Ltd
- Mitsubishi Corporation
- PUM GROUP
- Sibelco
- Sil Industrial Minerals
- Source Energy Services
- Superior Silica Sands
- TOCHU CORPORATION
- U.S. Silica (Apollo Global Management)
Additional Benefits:
- The market estimate (ME) sheet in Excel format
- 3 months of analyst support
TABLE OF CONTENTS
1 Introduction
- 1.1 Study Assumptions and Market Definition
- 1.2 Scope of the Study
2 Research Methodology
3 Executive Summary
4 Market Landscape
- 4.1 Market Overview
- 4.2 Market Drivers
- 4.2.1 Rising demand for premium-clarity flat and solar glass
- 4.2.2 Surging frac-sand intensity per shale well
- 4.2.3 Growth in high-purity silica for semiconductor fabs
- 4.2.4 Infrastructure stimulus-led concrete consumption
- 4.2.5 AI-driven foundry process optimisation
- 4.3 Market Restraints
- 4.3.1 Escalating environmental permitting hurdles
- 4.3.2 Rapid substitution by recycled cullet in container glass
- 4.3.3 Emerging low-quartz proppants (ceramics, resin-coated)
- 4.4 Value Chain Analysis
- 4.5 Porter's Five Forces
- 4.5.1 Bargaining Power of Suppliers
- 4.5.2 Bargaining Power of Buyers
- 4.5.3 Threat of New Entrants
- 4.5.4 Threat of Substitutes
- 4.5.5 Degree of Competition
5 Market Size and Growth Forecasts (Value and Volume)
- 5.1 By Purity Level
- 5.1.1 High-Purity (more than 99.5% SiO2)
- 5.1.2 Standard (95 to 99.5%)
- 5.1.3 Low-Purity (less than 95%)
- 5.2 By End-user Industry
- 5.2.1 Glass Manufacturing
- 5.2.2 Foundry
- 5.2.3 Chemical Production
- 5.2.4 Construction
- 5.2.5 Paints and Coatings
- 5.2.6 Ceramics and Refractories
- 5.2.7 Filtration
- 5.2.8 Oil and Gas
- 5.2.9 Other End-user Industries
- 5.3 By Geography
- 5.3.1 Asia-Pacific
- 5.3.1.1 China
- 5.3.1.2 India
- 5.3.1.3 Japan
- 5.3.1.4 South Korea
- 5.3.1.5 Indonesia
- 5.3.1.6 Australia
- 5.3.1.7 Rest of Asia-Pacific
- 5.3.2 North America
- 5.3.2.1 United States
- 5.3.2.2 Canada
- 5.3.2.3 Mexico
- 5.3.3 Europe
- 5.3.3.1 Germany
- 5.3.3.2 United Kingdom
- 5.3.3.3 Italy
- 5.3.3.4 France
- 5.3.3.5 Russia
- 5.3.3.6 Rest of Europe
- 5.3.4 South America
- 5.3.4.1 Brazil
- 5.3.4.2 Argentina
- 5.3.4.3 Rest of South America
- 5.3.5 Middle-East and Africa
- 5.3.5.1 Saudi Arabia
- 5.3.5.2 United Arab Emirates
- 5.3.5.3 South Africa
- 5.3.5.4 Rest of Middle-East and Africa
- 5.3.1 Asia-Pacific
6 Competitive Landscape
- 6.1 Market Concentration
- 6.2 Strategic Moves
- 6.3 Market Share (%)/Ranking Analysis
- 6.4 Company Profiles (includes Global level Overview, Market level overview, Core Segments, Financials as available, Strategic Information, Market Rank/Share for key companies, Products and Services, and Recent Developments)
- 6.4.1 Atlas Energy Solutions Inc. (Hi-Crush Inc.)
- 6.4.2 Badger Mining Corporation
- 6.4.3 Chongqing Changjiang River Moulding Material Group Co. Ltd
- 6.4.4 COVIA HOLDINGS LLC
- 6.4.5 Euroquarz GmbH
- 6.4.6 Gulf Coast Sand
- 6.4.7 JFE Mineral & Alloy Company Ltd
- 6.4.8 Mitsubishi Corporation
- 6.4.9 PUM GROUP
- 6.4.10 Sibelco
- 6.4.11 Sil Industrial Minerals
- 6.4.12 Source Energy Services
- 6.4.13 Superior Silica Sands
- 6.4.14 TOCHU CORPORATION
- 6.4.15 U.S. Silica (Apollo Global Management)
7 Market Opportunities and Future Outlook
- 7.1 White-space and Unmet-Need Assessment
 硅砂市场规模、份额、成长及全球产业分析:按类型和应用划分,区域洞察及2026-2034年预测
 亚太地区硅砂:市占率分析、产业趋势与统计、成长预测(2026-2031年)
 2026-2034年依最终用途及地区分類的硅砂市场日本硅砂市场规模、份额、趋势和预测:按最终用途和地区划分,2026-2034年
 2026年全球硅砂市场报告
 全球硅砂市场按类型、纯度、粒径、应用、销售管道和终端用户产业划分,2026-2032年预测
 硅砂市场规模、份额和成长分析(按类型、粒度、纯度、等级、应用和地区划分)—产业预测(2026-2033 年)
 工业硅砂:全球市占率及排名、总收入及需求预测(2025-2031年)
 硅砂市场-全球产业规模、份额、趋势、机会及预测(按等级、应用、区域及竞争细分,2020-2030 年)全球硅砂市场:预测(2025-2030)