


 |
市场调查报告书
商品编码
1939084
亚太地区硅砂:市占率分析、产业趋势与统计、成长预测(2026-2031年)Asia-Pacific Silica Sand - Market Share Analysis, Industry Trends & Statistics, Growth Forecasts (2026 - 2031) |
||||||
※ 本网页内容可能与最新版本有所差异。详细情况请与我们联繫。
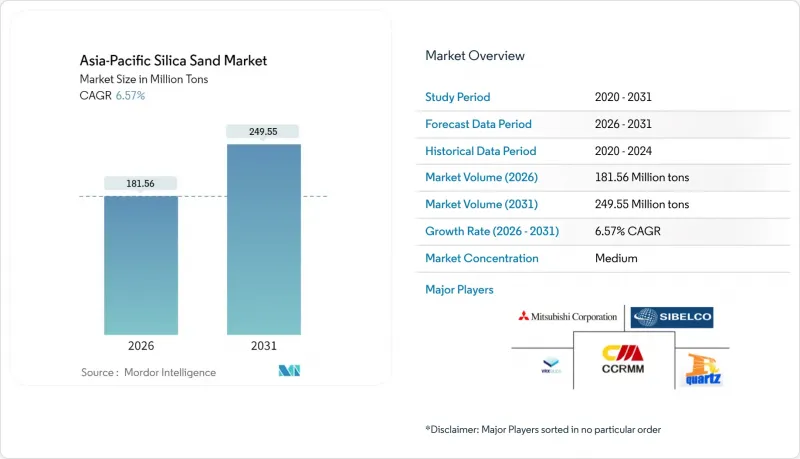
预计到 2026 年,亚太地区的硅砂市场规模将达到 1.8156 亿吨。
这意味着产量将从 2025 年的 1.7037 亿吨增加到 2031 年的 2.4955 亿吨,2026 年至 2031 年的年复合成长率(CAGR)为 6.57%。
这项扩张得益于多种需求来源的共同支撑,包括玻璃製造、电子产品、铸造应用和建筑材料。玻璃砂仍然是关键产品,因为平板玻璃和玻璃容器的生产与该地区的快速都市化和汽车生产息息相关。同时,随着半导体製造商追求3奈米以下的设计标准,超高纯度石英(HPQ)正从利基市场走向主流市场。竞争日趋激烈。大规模综合矿业公司正在加速自动化和遵守环保法规,以确保获得高额合同,而小规模营运商则在努力应对日益严格的法规。中期机会集中在太阳能玻璃、先进电子产品和跨境计划,这些项目能够确保东南亚地区的长途供应合约。
亚太地区硅砂市场趋势及展望
建筑业主导平板玻璃和玻璃容器需求激增
预计到2026年,泰国东部经济走廊(EEC)将推动建筑业每年增长3-4%,从而提振公共工程、商业建筑和住宅大楼对平板玻璃和玻璃容器的需求。玻璃製造商将硅砂视为关键成本,占原料成本的60%以上,订单积压直接推高了砂价。去库存化曾挤压了2024年的利润空间,但目前已出现逆转,东协地区许多主要生产商报告称,2025年的订单有所增加。东协互联互通倡议下的跨境基础设施走廊正在增加从马来西亚和澳洲到中国内陆浮法玻璃工厂的长途运输,加剧了主要航线的运输压力。由于玻璃生产对经济活动的滞后性为6-12个月,此次復苏表明,至少到2027年,生产成长空间依然充足。节能型低铁玻璃由于能够满足绿建筑标准中较薄的玻璃规格要求,因此价格更高。
电动车和风力发电铸件的復兴
电动车铸造技术对热膨胀係数的要求越来越低,迫使铸造厂转向使用粒径分布更均匀的已调整的硅砂混合物。中国的清洁能源主导预计到2024年将占全球需求的70%,这推动了对铝和球墨铸铁铸件的需求,全部区域去年消耗了约910万吨铸造砂。日本和韩国凭藉其先进的铸造设备,正向泰国和越南出口承包铸造生产线,从而推动了当地对高品质砂的需求。这种影响也波及到风力发电机轮毂产业,该产业集中在福建省、济州岛和宿雾岛,这些地区大量使用高硅砂来製造最终铸件的机舱壳体和轮毂组件。一项到2024年投资2,350亿美元的清洁能源製造业计画正在进行中,这将推动到2030年之前对砂的需求持续成长。拥有经认证的热衝击性能和尺寸精度的生产商已与电池製造商和涡轮机原始设备製造商签订了多年供应合约。
遏制非法和无序采砂
加强执法力度减少了河砂矿床的非法开采。特别是印度,由于估计有5,200万工人暴露于二氧化硅粉尘中,该国正在大力推动健康和安全改革。新的暴露限值(可吸收结晶质二氧化硅50微克/立方米)的实施,强制要求对设备进行升级,例如采用湿式洗涤和封闭式输送机,这使得合规运营商的采矿成本增加了4%至6%。在中国,当局吊销了数千份小规模采矿许可证,集中配额制度将预计2025年的供应缺口从63%缩小到4%。这些打击行动消除了低成本竞争,收紧了区域供应,并强化了亚太地区二氧化硅砂市场对合规高成本生产的依赖。非官方现货和合约级供应的价格波动已经加剧。
细分市场分析
到2025年,玻璃级石英砂的出货量将占亚太地区石英砂市场总出货量的63.88%,凸显其作为亚太地区石英砂市场支柱的地位。目前市占率较小的超高纯石英砂(Hyper HPQ)预计将以11.12%的复合年增长率成长,并从2026年起逐步扩大其在亚太地区石英砂市场中的份额。
供应稳定取决于自动化选矿生产线、光学分选和符合环保标准的清洁能源窑炉的转型。能够提供核能级纯度认证的生产商将进入半导体供应链,而中型供应商则将目标瞄准太阳能和光学领域。一种混合策略正在兴起,即利用日本化学浸出法对中等纯度的印尼原料进行提纯,这展示了一种无需新开发即可透过合作确保利润的途径。
亚太地区硅砂市场报告按等级(铸造/冶炼级、玻璃级、光学玻璃级等)、终端用户产业(玻璃製造、铸造、化学生产、建筑等)和地区(中国、印度、日本、韩国、印尼、泰国、马来西亚、新加坡、菲律宾、越南及亚太其他地区)进行细分。市场预测以百万吨为单位。
其他福利:
- Excel格式的市场预测(ME)表
- 3个月的分析师支持
目录
第一章 引言
- 研究假设和市场定义
- 调查范围
第二章调查方法
第三章执行摘要
第四章 市场情势
- 市场概览
- 市场驱动因素
- 建筑业主导平板玻璃和容器玻璃需求激增
- 由于电动车和风力发电对铸件的需求增加,铸造业正在復苏。
- 东协地区基础建设投资快速成长
- 过渡到节能型低铁太阳能玻璃
- 印尼半导体用二氧化硅下游加工
- 市场限制
- 遏制非法和无序采砂
- 无沙人造建筑材料
- 政府推动小规模矿山整合(吊销许可证)
- 价值链分析
- 波特五力分析
- 供应商的议价能力
- 买方的议价能力
- 新进入者的威胁
- 替代品的威胁
- 竞争程度
第五章 市场规模与成长预测
- 按年级
- 铸造级和冶炼级
- 玻璃级砂
- 光学玻璃级
- 中级 HPQ
- 超高纯度HPQ
- Hyper HPQ
- 按最终用户行业划分
- 玻璃製造
- 铸件
- 化学产品製造
- 建造
- 油漆和涂料
- 陶瓷和耐火材料
- 过滤
- 石油和天然气
- 其他终端用户产业
- 按地区
- 中国
- 印度
- 日本
- 韩国
- 印尼
- 泰国
- 马来西亚
- 新加坡
- 菲律宾
- 越南
- 亚太其他地区
第六章 竞争情势
- 市场集中度
- 策略性倡议(併购、合资、产能扩张)
- 市占率(%)/排名分析
- 公司简介
- Chongqing Changjiang River Moulding Material Group Co., Ltd.
- Covia Holdings LLC
- Diatreme Resources Limited
- Imerys
- JFE Mineral & Alloy Company,Ltd
- Mangal Minerals
- Mitsubishi Corporation
- Raghav Productivity Enhancers Limited
- Sibelco
- Tochu Corporation
- Tosoh Silica Corporation
- VRX Silica
- Xinyi Golden Ruite Quartz Materials Co., Ltd
- Xinyi Solar Holdings Limited
第七章 市场机会与未来展望
Asia-Pacific Silica Sand Market size in 2026 is estimated at 181.56 million tons, growing from 2025 value of 170.37 million tons with 2031 projections showing 249.55 million tons, growing at 6.57% CAGR over 2026-2031.
Multiple demand centers, including glass manufacturing, electronics, foundry applications, and construction materials, are converging to sustain this expansion. Glass grade sand remains the workhorse because flat and container glass output tracks the region's rapid urbanization and vehicle production. At the same time, hyper-purity quartz (HPQ) grades are transitioning from a niche toward mainstream status as semiconductor manufacturers push below the 3-nanometer design rule. Competitive intensity is rising as large, integrated miners accelerate automation and environmental compliance to lock in premium contracts while smaller operators struggle to meet tightening regulations. Mid-term opportunities cluster around solar glass, advanced electronics, and cross-border infrastructure projects that lock in long-haul supply contracts across Southeast Asia.
Asia-Pacific Silica Sand Market Trends and Insights
Construction-Led Flat and Container Glass Demand Surge
Thailand's Eastern Economic Corridor is driving 3-4% annual construction growth through 2026, lifting demand for flat and container glass across public works, commercial complexes, and residential towers. Glass manufactures treat silica sand as an essential cost component, often exceeding 60% of raw-material expenses, so rising project backlogs translate directly into higher sand uplift. Inventory corrections that hurt 2024 margins have already reversed, with most ASEAN producers reporting fuller order books for 2025 delivery. Cross-border infrastructure corridors under the ASEAN Connectivity vision are boosting long-distance shipments from Malaysia and Australia to inland Chinese float-glass lines, tightening freight capacity on favored routes. Given that glass output trails economic activity with a 6- to 12-month lag, the rebound indicates a clear volume runway through at least 2027. Energy-efficient low-iron variants secure additional premiums because they enable thinner glazing standards in green-building codes.
Foundry Revival for EV and Wind-Power Castings
Electric-vehicle casting technology increasingly specifies narrow thermal-expansion bands, pushing foundries toward calibrated silica sand blends with tighter grain-size distributions. China's clean-energy leadership, 70% of global output in 2024, created a lift in aluminum and ductile-iron casting that consumed roughly 9.1 million tons of foundry sand region-wide last year. Japan and South Korea, home to advanced molding machinery, are exporting turnkey foundry lines into Thailand and Vietnam, prompting localized demand for premium sand grades. The effect cascades through wind-turbine hubs clustered in Fujian, Jeju, and Cebu, where final-machined castings absorb high silica volumes for nacelle housings and hub assemblies. Investment pipelines worth USD 235 billion in 2024 targeted clean-energy manufacturing, signalling durable sand flows into 2030. Producers that certify thermal-shock performance and dimensional accuracy are capturing multiyear supply contracts from battery and turbine OEMs.
Illegal and Unregulated Sand Mining Curbs
Rising enforcement is shrinking unregistered output across riverine deposits, especially in India, where the estimated 52 million-worker cohort exposed to silica dust has spurred sweeping health-and-safety reforms. New exposure limits - 50 µg/m3 for respirable crystalline silica mandate capital upgrades like wet-scrubbing and enclosed conveyors, adding 4-6% to mining opex for compliant operators. In China, authorities canceled thousands of small-scale licenses, reducing projected 2025 supply gaps from 63% to 4% through centrally managed quotas. Such crackdowns eliminate low-cost competition but tighten local availability, reinforcing the Asia-Pacific silica sand market's reliance on compliant, higher-cost output. Price volatility has already widened between informal spot cargoes and contract-grade supplies.
Other drivers and restraints analyzed in the detailed report include:
- Rapid Infrastructure Spending Across ASEAN
- Indonesia's Silica Downstreaming for Semiconductors
- Substitution by Engineered, Sand-Free Building Materials
For complete list of drivers and restraints, kindly check the Table Of Contents.
Segment Analysis
The glass grade segment captured 63.88% of 2025 shipments, underscoring its role as the backbone of the Asia-Pacific silica sand market. Hyper HPQ, though only a sliver of volume today, is projected to post an 11.12% CAGR, raising its stake in the Asia-Pacific silica sand market size from 2026 onward.
Supply security hinges on automated beneficiation lines, optical sorting, and clean-energy kiln conversions that meet environmental benchmarks. Producers able to certify nuclear-level purity enter the semiconductor chain, while mid-tier suppliers target solar and optics. Blending strategies are emerging, where moderate-purity Indonesian feedstock is upgraded via Japanese chemical leaching, showing how collaboration can capture margin without greenfield development.
The Asia-Pacific Silica Sand Report is Segmented by Grade (Foundry/Smelter Grade, Glass Grade Sand, Optical Glass Grade, and More), End-User Industry (Glass Manufacturing, Foundry, Chemical Production, Construction, and More), and Geography (China, India, Japan, South Korea, Indonesia, Thailand, Malaysia, Singapore, Philippines, Vietnam, and Rest of Asia-Pacific). The Market Forecasts are Provided in Terms of Volume (Million Tons).
List of Companies Covered in this Report:
- Chongqing Changjiang River Moulding Material Group Co., Ltd.
- Covia Holdings LLC
- Diatreme Resources Limited
- Imerys
- JFE Mineral & Alloy Company,Ltd
- Mangal Minerals
- Mitsubishi Corporation
- Raghav Productivity Enhancers Limited
- Sibelco
- Tochu Corporation
- Tosoh Silica Corporation
- VRX Silica
- Xinyi Golden Ruite Quartz Materials Co., Ltd
- Xinyi Solar Holdings Limited
Additional Benefits:
- The market estimate (ME) sheet in Excel format
- 3 months of analyst support
TABLE OF CONTENTS
1 Introduction
- 1.1 Study Assumptions and Market Definition
- 1.2 Scope of the Study
2 Research Methodology
3 Executive Summary
4 Market Landscape
- 4.1 Market Overview
- 4.2 Market Drivers
- 4.2.1 Construction-led flat and container glass demand surge
- 4.2.2 Foundry revival for EV and wind-power castings
- 4.2.3 Rapid infrastructure spending across ASEAN
- 4.2.4 Shift to energy-efficient low-iron solar glass
- 4.2.5 Indonesia's silica downstreaming for semiconductors
- 4.3 Market Restraints
- 4.3.1 Illegal and unregulated sand mining curbs
- 4.3.2 Substitution by engineered, sand-free building materials
- 4.3.3 Government drive to consolidate small mines (license cancellations)
- 4.4 Value Chain Analysis
- 4.5 Porter's Five Forces Analysis
- 4.5.1 Bargaining Power of Suppliers
- 4.5.2 Bargaining Power of Buyers
- 4.5.3 Threat of New Entrants
- 4.5.4 Threat of Substitutes
- 4.5.5 Degree of Competition
5 Market Size and Growth Forecasts (Volume)
- 5.1 By Grade
- 5.1.1 Foundry/Smelter Grade
- 5.1.2 Glass Grade Sand
- 5.1.3 Optical Glass Grade
- 5.1.4 Intermediate HPQ
- 5.1.5 Ultra High HPQ
- 5.1.6 Hyper HPQ
- 5.2 By End-user Industry
- 5.2.1 Glass Manufacturing
- 5.2.2 Foundry
- 5.2.3 Chemical Production
- 5.2.4 Construction
- 5.2.5 Paints and Coatings
- 5.2.6 Ceramics and Refractories
- 5.2.7 Filtration
- 5.2.8 Oil and Gas
- 5.2.9 Other End-user Industries
- 5.3 By Geography
- 5.3.1 China
- 5.3.2 India
- 5.3.3 Japan
- 5.3.4 South Korea
- 5.3.5 Indonesia
- 5.3.6 Thailand
- 5.3.7 Malaysia
- 5.3.8 Singapore
- 5.3.9 Philippines
- 5.3.10 Vietnam
- 5.3.11 Rest of Asia-Pacific
6 Competitive Landscape
- 6.1 Market Concentration
- 6.2 Strategic Moves (Mergers and Acquisitions, JVs, Capacity Expansions)
- 6.3 Market Share (%)**/Ranking Analysis
- 6.4 Company Profiles (includes Global level Overview, Market level overview, Core Segments, Financials as available, Strategic Information, Market Rank/Share for key companies, Products and Services, and Recent Developments)
- 6.4.1 Chongqing Changjiang River Moulding Material Group Co., Ltd.
- 6.4.2 Covia Holdings LLC
- 6.4.3 Diatreme Resources Limited
- 6.4.4 Imerys
- 6.4.5 JFE Mineral & Alloy Company,Ltd
- 6.4.6 Mangal Minerals
- 6.4.7 Mitsubishi Corporation
- 6.4.8 Raghav Productivity Enhancers Limited
- 6.4.9 Sibelco
- 6.4.10 Tochu Corporation
- 6.4.11 Tosoh Silica Corporation
- 6.4.12 VRX Silica
- 6.4.13 Xinyi Golden Ruite Quartz Materials Co., Ltd
- 6.4.14 Xinyi Solar Holdings Limited
7 Market Opportunities and Future Outlook
- 7.1 White-space and Unmet-need Assessment
 硅砂市场规模、份额、成长及全球产业分析:按类型和应用划分,区域洞察及2026-2034年预测
 硅砂:市占率分析、产业趋势与统计、成长预测(2026-2031)
 2026-2034年依最终用途及地区分類的硅砂市场日本硅砂市场规模、份额、趋势和预测:按最终用途和地区划分,2026-2034年
 2026年全球硅砂市场报告
 全球硅砂市场按类型、纯度、粒径、应用、销售管道和终端用户产业划分,2026-2032年预测
 硅砂市场规模、份额和成长分析(按类型、粒度、纯度、等级、应用和地区划分)—产业预测(2026-2033 年)
 工业硅砂:全球市占率及排名、总收入及需求预测(2025-2031年)
 硅砂市场-全球产业规模、份额、趋势、机会及预测(按等级、应用、区域及竞争细分,2020-2030 年)全球硅砂市场:预测(2025-2030)