


 |
市场调查报告书
商品编码
1937313
服装物流:市场占有率分析、产业趋势与统计、成长预测(2026-2031)Apparel Logistics - Market Share Analysis, Industry Trends & Statistics, Growth Forecasts (2026 - 2031) |
||||||
※ 本网页内容可能与最新版本有所差异。详细情况请与我们联繫。
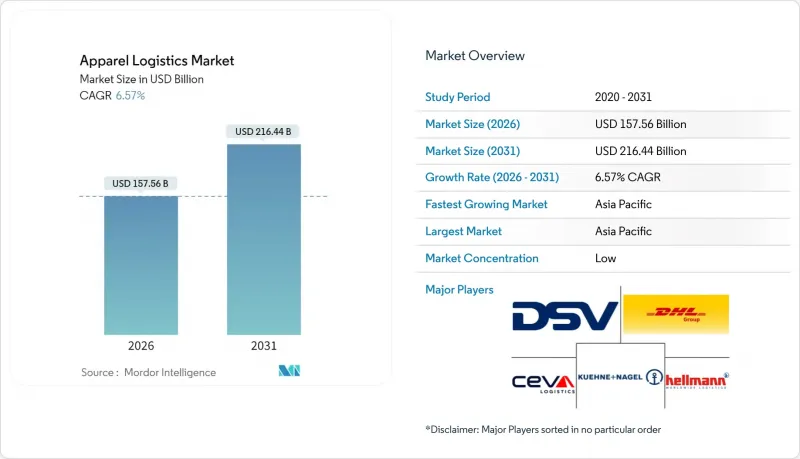
2025年服装物流市场价值为1,478.5亿美元,预计到2031年将达到2,164.4亿美元,而2026年为1,575.6亿美元。
预计在预测期(2026-2031 年)内,复合年增长率将达到 6.57%。
数位化、循环经济模式和日益严格的环境法规正在重塑全球时尚供应链。电子商务的持续成长、按需配送的需求以及不断增加的SKU数量迫使供应商投资于即时库存视觉化工具和最后一公里最佳化。儘管亚太地区凭藉其庞大的製造业基地保持优势,但美洲和欧洲的近岸外包正在逐步改变贸易流向。运输服务仍然至关重要,预计到2024年将占总收入的68%,而人工智慧驱动的预测和转售支援等附加价值服务将成长最快,达到4.10%。为了因应美国高达20.8%的服饰退货率,第三方物流公司正在将服务扩展到逆向物流,加剧了市场竞争。对范围3排放的监管力道加大以及运费的波动进一步复杂化了成本结构,促使企业投资于低碳燃料和自动化技术。
全球服装物流市场趋势与洞察
2025年及以后:按需服饰和即时配送需求激增
在印度,快消平台预计将以每年75%至85%的速度成长,到2025财年,其商品交易总额(GMV)将达到60亿美元。东南亚地区也呈现类似的成长动能。物流业者正在重建其最后一公里配送网络,京东物流承诺到2025年,将在数十个市场实现两到三天的跨境配送。像By Rotation这样的P2P租赁业者正在经营实体取货点,以满足当日达的需求。政府对配送车辆排放气体的监管正在加速人口密集城市向电动货车的转型。随着品牌试点微型仓配中心,即时调度软体在实现两小时送达方面发挥着至关重要的作用。一家整合预测分析技术的供应商在2024年的试点计画中,将最后一公里配送成本降低了12%。
电子商务主导的SKU 激增需要先进的库存可见性。
时尚品牌管理着数千个管道的数千个SKU,这使得传统系统显得过时。沃尔玛的AI趋势分析引擎能够在几週内将社交讯号转化为采购订单,从而减少缓衝库存。已实施AI辅助需求计画的零售商报告称,存货周转提高了30%。库存过剩仍然是一个重大问题,加剧了降价压力。欧盟数位产品护照要求将在2026年之前强制执行精细化的产品追踪,这将进一步提高资料需求。为此,第三方物流公司正在整合控制塔平台,以同步订单、履行和退货流程,并将自身定位为技术合作伙伴,而非货运仲介业者。
高退货率推高逆向物流成本
预计到2024年,美国零售退货总额将达8,900亿美元,服饰业的平均退货率高达20.8%,仓储成本是运输成本的2.5倍。在英国,频繁退货每年造成的损失相当于86亿美元。 Happy Returns的AI分类系统可将处理时间缩短70%。然而,预计到2024年,退货诈骗将上升至15.14%,将促使RFID和电脑视觉认证技术的应用。为了最大限度地减少运输排放和处理成本,各大品牌正在试点针对低价值商品的「保留退款制度,并积极寻求与二手零售商伙伴关係,将退货转化为次市场库存。
细分市场分析
到2025年,运输业将占总收入的67.32%,支撑着规模达995.2亿美元的服装物流市场。道路运输,海运负责国际散货运输,而空运则主要服务于高价值和时效性货物的运输。随着托运人寻求减少范围3排放,替代燃料的采用正在促使合约结构进行重组。儘管运输业规模庞大,但由于运力波动和碳课税的影响,其利润率正面临越来越大的压力。
预计附加价值服务将以4.05%的复合年增长率(CAGR)实现最高成长,透过支持先前由品牌方自行完成的套装组装、贴标、维修和再销售等业务,推动服装物流市场的发展。像Ryder这样的供应商现在能够在全通路履约中心内提供包装、拆包、缝纫和品质检验等服务。这些能力将物流更深入地融入品牌运营,从而提高合约续约率和获利能力。将销售点(POS)资料与仓库管理系统集成,可实现需求驱动型包装,而永续性评估模组则可提供每个小包裹的碳排放资料。
区域分析
预计到2025年,亚太地区将占全球营收的40.58%,推动服饰物流市场规模达到599.9亿美元,并预计到2031年将以5.03%的复合年增长率成长。中国、越南、孟加拉和印度将主导出口,而区域内消费支出的成长正在加强区域分销网络。区域全面经济伙伴协定(RCEP)下的贸易优惠以及印尼和菲律宾港口基础设施的改善正在缩短前置作业时间。永续性法规,例如中国的“双能目标”,正促使工厂位置靠近港口,从而改变短途运输模式。
北美地区电子商务营运日趋成熟,自动化投资持续成长。加州内陆帝国和宾州利哈伊谷的劳动力短缺加速了机器人技术的应用,并降低了单位处理成本。墨西哥近岸外包的蓬勃发展(尤其是在巴希奥走廊沿线)正在推动跨境卡车运输路线的重新调整,并支持双边物流中心。在美国,各州为推广氢燃料卡车提供的激励措施与联邦工业税额扣抵相辅相成。
在欧洲,合规是重中之重,《企业永续发展报告指令》(CSRD) 和碳边境调节机制 (CBAM) 正推动运输方式转向铁路和内河航运。东欧的第三方物流(3PL) 公司正在扩大产能,以满足土耳其和摩洛哥日益增长的快时尚生产需求。欧盟排放交易体系下的碳定价将提高海运附加费,并促使港口仓库提高货柜装载效率。德国、法国和北欧国家电子商务的兴起将促进都市区低排放区内微型仓配的发展。
其他福利:
- Excel格式的市场预测(ME)表
- 3个月的分析师支持
目录
第一章 引言
- 研究假设和市场定义
- 调查范围
第二章调查方法
第三章执行摘要
第四章 市场情势
- 市场概览
- 市场驱动因素
- 从2025年起,人们对按需服装和即时配送的期望将大幅提升。
- 电子商务SKU的激增要求对库存有深入的了解。
- 永续性法规推动绿色物流投资
- 在美洲和欧洲扩大靠近市场的製造规模
- 利用人工智慧实现仓库自动化,降低单位搬运成本
- 服装租赁和二手商品交易模式的兴起将推动逆向物流的发展。
- 市场限制
- 高退货率推高逆向物流成本
- 运费波动和运力限制
- 仓储作业高度集中的地区劳动力短缺
- 范围 3 交通运输排放的监管审查
- 价值/供应链分析
- 监管环境
- 技术展望
- 波特五力模型
- 新进入者的威胁
- 供应商的议价能力
- 买方的议价能力
- 替代品的威胁
- 竞争对手之间的竞争
- 政府法规和政策
- 亮点-电子商务对传统服装物流供应链的影响
- 逆向物流评论与说明
- 新冠疫情与地缘政治事件对市场的影响
第五章 市场规模与成长预测
- 透过服务
- 运输
- 路
- 铁路
- 航空
- 海事和内河航道
- 仓储和配送服务
- 附加价值服务
- 运输
- 依产品类型
- 衣服
- 鞋类
- 配件
- 按地区
- 北美洲
- 我们
- 加拿大
- 墨西哥
- 南美洲
- 巴西
- 秘鲁
- 智利
- 阿根廷
- 南美洲其他地区
- 亚太地区
- 印度
- 中国
- 日本
- 澳洲
- 韩国
- 东南亚(新加坡、马来西亚、泰国、印尼、越南、菲律宾)
- 亚太其他地区
- 欧洲
- 英国
- 德国
- 法国
- 西班牙
- 义大利
- 比荷卢经济联盟(比利时、荷兰、卢森堡)
- 北欧国家(丹麦、芬兰、冰岛、挪威、瑞典)
- 其他欧洲
- 中东和非洲
- 阿拉伯聯合大公国
- 沙乌地阿拉伯
- 南非
- 奈及利亚
- 其他中东和非洲地区
- 北美洲
第六章 竞争情势
- 市场集中度
- 策略趋势
- 市占率分析
- 公司简介
- Ceva Logistics
- DSV
- Deutsche Post DHL Group
- Kuehne+Nagel
- Hellmann Worldwide Logistics
- Apparel Logistics Group Inc.
- PVS Fulfillment-Service GmbH
- Logwin AG
- GAC Group
- Nippon Express
- Genex Logistics
- Expeditors International of Washington Inc.
- BGROUP SRL
- FedEx Supply Chain
- GXO Logistics
- Bleckmann Logistics
- OIA Global
- XPO Logistics
- Lalamove
- JD Logistics
第七章 市场机会与未来展望
The Apparel Logistics Market was valued at USD 147.85 billion in 2025 and estimated to grow from USD 157.56 billion in 2026 to reach USD 216.44 billion by 2031, at a CAGR of 6.57% during the forecast period (2026-2031).
As digitalization, circular-economy models, and stricter environmental rules reshape global fashion supply chains. Sustained e-commerce growth, on-demand delivery expectations, and SKU proliferation are compelling providers to invest in real-time inventory visibility tools and last-mile optimization. Asia-Pacific retains supremacy owing to its extensive production base, yet nearshoring in the Americas and Europe is gradually redirecting trade flows. Transportation services remain indispensable, accounting for 68% of 2024 revenue, while value-added services such as AI-enabled forecasting and resale support are expanding fastest at 4.10%. Competitive intensity is rising as 3PLs broaden offerings into reverse logistics to counter a 20.8% apparel return rate in the United States. Regulatory scrutiny of Scope-3 emissions and volatile freight rates further complicate cost structures, spurring accelerated investment in low-carbon fuels and automation.
Global Apparel Logistics Market Trends and Insights
2025+ Surge in On-Demand Apparel and Instant Delivery Expectations
Quick-commerce platforms are set to grow 75-85% annually in India, hitting USD 6 billion GMV by FY 2025, and similar momentum is visible across Southeast Asia. Logistics providers are re-engineering last-mile networks, with JD Logistics pledging 2-3-day cross-border delivery to dozens of markets in 2025. Peer-to-peer rental players such as By Rotation now run physical pick-up points to satisfy same-day demand. Municipal rules on delivery-vehicle emissions accelerate the shift to electric vans in dense cities. As brands test micro-fulfillment centers, real-time routing software becomes decisive in meeting two-hour delivery windows. Providers integrating predictive analytics have trimmed last-mile costs by 12% during 2024 pilots.
E-Commerce-Driven SKU Proliferation Requiring Sophisticated Inventory Visibility
Fashion brands juggle thousands of SKUs across multiple channels, rendering legacy systems obsolete. Walmart's AI trend-to-product engine converts social signals into purchase orders within weeks, slashing buffer stock. Retailers deploying AI-assisted demand planning report 30% faster inventory velocity. Excess stock remains acute, magnifying markdown pressure. EU Digital Product Passport requirements mandate granular item tracking by 2026, further tightening data needs. In response, 3PLs bundle control-tower platforms that synchronize ordering, fulfillment, and returns, positioning themselves as tech partners rather than freight brokers.
High Returns Rate Inflating Reverse-Logistics Costs
US retail returns totaled USD 890 billion in 2024, with apparel averaging a 20.8% rate and carrying costs 2.5X greater than outbound fulfillment. Serial returners in the United Kingdom create USD 8.6 billion equivalent in annual costs. AI-driven sortation systems from Happy Returns reduce processing time 70%. However, return fraud climbed to 15.14% in 2024, forcing the adoption of RFID and computer-vision authentication. Brands are piloting "keep-it" refunds for low-value items to minimize transport emissions and handling overhead, while resale partnerships convert returns into secondary-market inventory.
Other drivers and restraints analyzed in the detailed report include:
- Sustainability Regulations Pushing Green Logistics Investments
- AI-Driven Warehouse Automation Lowering Per-Unit Handling Costs
- Volatile Freight Rates and Capacity Constraints
For complete list of drivers and restraints, kindly check the Table Of Contents.
Segment Analysis
Transportation generated 67.32% of 2025 revenue and anchors the apparel logistics market size at USD 99.52 billion. Road remains the backbone for intra-regional moves, while sea freight handles bulk international volumes; air retains a niche for high-value or time-critical stock. Adoption of alternative fuels is reshaping contract structures as shippers seek lower Scope-3 emissions. Despite its scale, transportation faces intensifying margin pressure from capacity volatility and carbon levies.
Value-added services posted the strongest 4.05% CAGR outlook, expanding the apparel logistics market by enabling kitting, labeling, repair, and recommerce tasks that once sat with brands. Providers like Ryder now bundle unpacking, sewing, and quality inspection within omnichannel fulfillment nodes. These functions embed logistics deeper into brand operations, driving stickier contracts and higher yields. Integration of point-of-sale data with warehouse management systems supports demand-driven packaging, while sustainability scoring modules attach carbon data to each parcel.
The Apparel Logistics Market Report is Segmented by Service (Transportation (Road, Rail, Air, Sea and Inland Waterways), Warehousing & Distribution Services, Value-Added Services), Product Type (Clothing, Footwear, Accessories), and Geography (North America, South America, Asia-Pacific, Europe, Middle East and Africa). The Market Forecasts are Provided in Terms of Value (USD).
Geography Analysis
Asia-Pacific held 40.58% of 2025 revenue and anchors the apparel logistics market size at USD 59.99 billion, rising at 5.03% CAGR through 2031. China, Vietnam, Bangladesh, and India dominate exports, yet intra-Asian consumer spending strengthens regional distribution networks. RCEP trade preferences and port infrastructure upgrades in Indonesia and the Philippines shorten lead times. Sustainability regulations, such as China's dual-control energy targets, push factories to near ports, altering drayage patterns.
North America combines mature e-commerce operations with on-going automation investments. Labor shortages in California's Inland Empire and Pennsylvania's Lehigh Valley accelerate adoption of robotics, lowering per-unit handling costs. Mexico's nearshoring boom, especially along the Bajio corridor, re-positions cross-border trucking lanes and supports bi-national distribution centers. U.S. state incentives for hydrogen trucking complement federal IRA credits.
Europe emphasizes regulatory compliance, with CSRD and CBAM guiding modal shifts toward rail and inland waterways. Eastern European 3PLs expand capacity to serve rising fast-fashion production in Turkey and Morocco. Carbon pricing in the EU Emissions Trading System raises ocean-freight surcharges, prompting more consolidation at port warehouses to optimize container loads. E-commerce penetration in Germany, France, and the Nordics supports micro-fulfillment deployment inside urban low-emission zones.
List of Companies Covered in this Report:
- Ceva Logistics
- DSV
- Deutsche Post DHL Group
- Kuehne + Nagel
- Hellmann Worldwide Logistics
- Apparel Logistics Group Inc.
- PVS Fulfillment-Service GmbH
- Logwin AG
- GAC Group
- Nippon Express
- Genex Logistics
- Expeditors International of Washington Inc.
- BGROUP SRL
- FedEx Supply Chain
- GXO Logistics
- Bleckmann Logistics
- OIA Global
- XPO Logistics
- Lalamove
- JD Logistics
Additional Benefits:
- The market estimate (ME) sheet in Excel format
- 3 months of analyst support
TABLE OF CONTENTS
1 Introduction
- 1.1 Study Assumptions and Market Definition
- 1.2 Scope of the Study
2 Research Methodology
3 Executive Summary
4 Market Landscape
- 4.1 Market Overview
- 4.2 Market Drivers
- 4.2.1 2025+ surge in on-demand apparel and instant delivery expectations
- 4.2.2 E-commerce-driven SKU proliferation requiring sophisticated inventory visibility
- 4.2.3 Sustainability regulations pushing green logistics investments
- 4.2.4 Expansion of near-market manufacturing in Americas and Europe
- 4.2.5 AI-driven warehouse automation lowering per-unit handling costs
- 4.2.6 Rise of apparel rental and recommerce models boosting reverse logistics
- 4.3 Market Restraints
- 4.3.1 High returns rate inflating reverse-logistics costs
- 4.3.2 Volatile freight rates and capacity constraints
- 4.3.3 Labor shortages in warehousing hotspots
- 4.3.4 Regulatory scrutiny of Scope-3 transport emissions
- 4.4 Value / Supply-Chain Analysis
- 4.5 Regulatory Landscape
- 4.6 Technological Outlook
- 4.7 Porter's Five Forces
- 4.7.1 Threat of New Entrants
- 4.7.2 Bargaining Power of Suppliers
- 4.7.3 Bargaining Power of Buyers
- 4.7.4 Threat of Substitutes
- 4.7.5 Competitive Rivalry
- 4.8 Government Regulations and Initiatives
- 4.9 Spotlight-Effect of E-commerce on Traditional Apparel Logistics Supply Chain
- 4.10 Review and Commentary on Reverse Logistics
- 4.11 Impact of COVID-19 and Geo-Political Events on the Market
5 Market Size and Growth Forecasts
- 5.1 By Service (Value)
- 5.1.1 Transportation
- 5.1.1.1 Road
- 5.1.1.2 Rail
- 5.1.1.3 Air
- 5.1.1.4 Sea and Inland Waterways
- 5.1.2 Warehousing and Distribution Services
- 5.1.3 Value-added Services
- 5.1.1 Transportation
- 5.2 By Product Type
- 5.2.1 Clothing
- 5.2.2 Footwear
- 5.2.3 Accessories
- 5.3 By Geography (Value)
- 5.3.1 North America
- 5.3.1.1 United States
- 5.3.1.2 Canada
- 5.3.1.3 Mexico
- 5.3.2 South America
- 5.3.2.1 Brazil
- 5.3.2.2 Peru
- 5.3.2.3 Chile
- 5.3.2.4 Argentina
- 5.3.2.5 Rest of South America
- 5.3.3 Asia-Pacific
- 5.3.3.1 India
- 5.3.3.2 China
- 5.3.3.3 Japan
- 5.3.3.4 Australia
- 5.3.3.5 South Korea
- 5.3.3.6 South East Asia (Singapore, Malaysia, Thailand, Indonesia, Vietnam, and Philippines)
- 5.3.3.7 Rest of Asia-Pacific
- 5.3.4 Europe
- 5.3.4.1 United Kingdom
- 5.3.4.2 Germany
- 5.3.4.3 France
- 5.3.4.4 Spain
- 5.3.4.5 Italy
- 5.3.4.6 BENELUX (Belgium, Netherlands, and Luxembourg)
- 5.3.4.7 NORDICS (Denmark, Finland, Iceland, Norway, and Sweden)
- 5.3.4.8 Rest of Europe
- 5.3.5 Middle East and Africa
- 5.3.5.1 United Arab of Emirates
- 5.3.5.2 Saudi Arabia
- 5.3.5.3 South Africa
- 5.3.5.4 Nigeria
- 5.3.5.5 Rest of Middle East And Africa
- 5.3.1 North America
6 Competitive Landscape
- 6.1 Market Concentration
- 6.2 Strategic Moves
- 6.3 Market Share Analysis
- 6.4 Company Profiles (includes Global Level Overview, Market Level Overview, Core Segments, Financials as available, Strategic Information, Market Rank/Share for key companies, Products and Services, and Recent Developments)
- 6.4.1 Ceva Logistics
- 6.4.2 DSV
- 6.4.3 Deutsche Post DHL Group
- 6.4.4 Kuehne + Nagel
- 6.4.5 Hellmann Worldwide Logistics
- 6.4.6 Apparel Logistics Group Inc.
- 6.4.7 PVS Fulfillment-Service GmbH
- 6.4.8 Logwin AG
- 6.4.9 GAC Group
- 6.4.10 Nippon Express
- 6.4.11 Genex Logistics
- 6.4.12 Expeditors International of Washington Inc.
- 6.4.13 BGROUP SRL
- 6.4.14 FedEx Supply Chain
- 6.4.15 GXO Logistics
- 6.4.16 Bleckmann Logistics
- 6.4.17 OIA Global
- 6.4.18 XPO Logistics
- 6.4.19 Lalamove
- 6.4.20 JD Logistics
7 Market Opportunities and Future Outlook
- 7.1 White-space and Unmet-need Assessment
 2026-2030年全球服饰物流市场
 可回收运输包装解决方案市场(按包装类型、材料、所有权、供应链阶段和最终用户划分),全球预测,2026-2032年时尚及奢侈品物流服务市场(依服务类型、顾客类型、通路、服务模式及运输方式划分)-2026-2032年全球预测服装物流市场依最终用户产业、组织规模、服务类型和运输方式划分-2025-2032年全球预测
 美国服装物流:市场占有率分析、产业趋势、统计数据、成长预测(2025-2030 年)
 服装物流市场规模、份额、趋势分析报告:按服务、运输方式、销售管道、最终用途、地区、细分市场预测,2024-2030
 全球服装物流市场