


 |
市场调查报告书
商品编码
1939045
生质燃料:市场占有率分析、产业趋势与统计、成长预测(2026-2031)Biofuels - Market Share Analysis, Industry Trends & Statistics, Growth Forecasts (2026 - 2031) |
||||||
※ 本网页内容可能与最新版本有所差异。详细情况请与我们联繫。
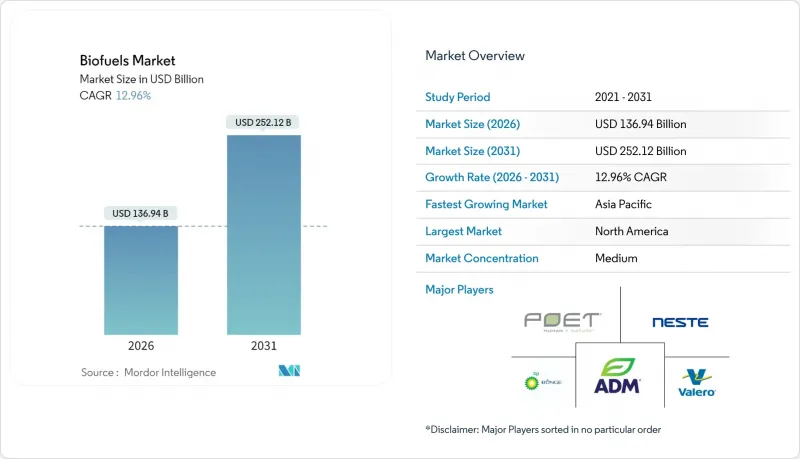
预计生质燃料市场规模将从 2025 年的 1,212.3 亿美元成长到 2026 年的 1,369.4 亿美元,到 2031 年将达到 2,521.2 亿美元,2026 年至 2031 年的复合年增长率为 12.96%。
交通运输领域(尤其是航空业)脱碳的压力日益增大,加上大型石油公司的大规模投资,正在推动产能扩张,从而降低推广应用的门槛。从第一代作物基燃料到废弃物基和合成生物学解决方案的快速技术转型,正在改善生命週期排放并降低原料风险。同时,北美政府的税收优惠政策和亚洲的掺混规定,正在鼓励签订长期承购协议,以稳定生产商的价格。主要企业宣布的43个炼油厂改造和新建设计划预计到2030年将新增数百万吨产能。这将加剧竞争,加速供应链重组,并缩小可再生和石化燃料之间的成本差距。
全球生质燃料市场趋势及展望
加强亚洲和南美洲的混合运输义务
亚洲和南美洲各国政府正在实施更高的生质柴油掺混比例,并调整原料分配和生产地点。光是印尼的B40计画预计就能将生质柴油年消费量提高到1,315千万公升,进而减少柴油进口,节省90亿美元的外汇支出。印度正迅速推进2025年达到20%的乙醇掺混比例,同时鼓励对蒸馏和物流设施的投资。菲律宾和泰国也正在推行类似的政策,而巴西则继续维持其传统的乙醇生产模式。这些政策有助于提高农村收入,降低原油进口成本,并透过建立可预测的需求来降低工厂扩张的风险。所有这些因素共同支撑着全球生质燃料市场的快速成长前景。
净零排放购电协议推动北美对可再生柴油的需求
如今,各大物流和零售品牌均已签订多年采购协议,以确保获得远超监管最低标准的低碳燃料供应。 DHL集团与Neste公司合作,计划到2030年每年采购30万吨永续航空燃料(SAF)。加州低碳燃料标准(LCFS)允许参与企业兑换温室气体排放信用额度,其价值通常高于实际燃料价格,进一步改善长期经济效益。这些企业承诺为生产商提供可预测的收入,并使其能够获得债务融资,用于在美国和加拿大各地建造新的加氢处理装置。
原料价格(大豆、菜籽、废弃食用油)的波动正在给生产商的利润率带来压力。
预计到2024年,大豆油、废食用油和牛油的价格波动幅度将达到40%至60%,这将挤压炼油商的利润空间,并使避险策略更加复杂。欧洲废油进口中与诈欺相关的中断推高了价格,同时也带来了可追溯性的挑战。生产商正透过多元化经营,转向林业废弃物和市政污泥等残余物来应对价格波动,但预处理过程需要资本投入且较为复杂。因此,短期盈利取决于原料来源组合的柔软性以及强劲的信用市场,以抵消大宗商品价格波动的影响。
细分市场分析
永续航空燃料 (SAF) 的供应量虽然小规模,但正以 34.98% 的复合年增长率增长,这反映了航空公司即时的排放需求以及相关政策的支持。生质乙醇仍占最大份额,这主要归功于其在美国 E10 和巴西 E27 混合燃料中的广泛应用。然而,加氢处理技术能够联产 SAF、可再生柴油和生物石脑油,这正推动资本朝向可直接替代现有管道生产的分子燃料转移。
由于在寒冷气候下与新型引擎系统有相容性问题,第二代生质柴油的成长已趋于平缓。与此同时,可再生柴油凭藉其更高的十六烷值和与化石柴油相媲美的基础设施建设,市场份额正在扩大。生物丙烷等高附加价值产品进一步提升了计划的经济效益。因此,在其他产业需求的驱动下,全球生质燃料市场正转向排碳权价值更高的燃料。
第一代生质燃料仍占全球销售额的67.62%,主要得益于巴西的甘蔗乙醇和美国的玉米乙醇。第一代生质燃料的全球市场规模预计将温和成长,但随着更先进技术的普及,其相对份额将会下降。第三代藻类生物燃料计划目前年复合成长率达15.92%,这得益于基因工程和光生物反应器技术的进步,使得生产成本降低了两位数。
近期大学研究表明,基因工程改造的微藻类可以将85%的废油转化为适用于加氢处理的脂质,从而有望减少土地利用问题。第二代纤维素生产设施,例如兰扎捷航空的乙醇制永续航空燃料(SAF)工厂,最终实现了商业规模产能,并展现出更高的酵素效率。第四代合成生物学仍处于商业化前期阶段,但已吸引创业投资资金,预计将实现直接利用捕获的二氧化碳合成燃料。
生质燃料市场报告按燃料类型(生质乙醇、生质柴油、可再生柴油等)、世代(第一代、第三代等)、原料(糖料作物、淀粉作物、藻类等)、技术(发酵、酯交换、加氢处理等)、应用(道路运输、航空、航运、发电和供热)以及地区(北美、欧洲、亚太地区等)进行细分。
区域分析
预计到2025年,北美将占全球生质燃料市场42.56%的份额,这主要得益于成熟的玉米乙醇工厂、大豆基可再生柴油的增长以及慷慨的税额扣抵。到2025年,可再生柴油产能将翻一番,达到52亿加仑,而加州的低碳燃料标准(LCFS)将消耗掉几乎全部的国内供应,从而形成稳定的价格底线。该地区政策的清晰性使生产商能够快速资金筹措,而强大的粮食加工基础设施则确保了原料的稳定供应。墨西哥近期延长了相关强制规定,加拿大也推出了无污染燃料法规,这些都将进一步提振该地区的需求。
在欧洲,《可再生能源指令III》设定了2030年可再生能源占比达到42.5%的目标,并透过逐步淘汰棕榈油作为原料来推动变革。德国将从2025年起禁止结转上年度的温室气体排放排放权,迫使相关企业立即购买先进生质燃料。对中国生质柴油征收反倾销税正在改变贸易路线,推高国产氢化植物油(HVO)的溢价,并鼓励扩大本地产能。一系列复杂的政策组合正在推动技术创新,而原料供应的限制则将产量成长限制在适度水准。
亚太地区以16.78%的复合年增长率领先全球。印尼的B40强制性政策每年将吸收1,315千万公升生质柴油,节省150亿美元的外汇支出,同时提高小规模棕榈油种植者的收入。印度计划在2025年实现20%的乙醇混合燃料比例,将提振对谷物和糖蜜乙醇的需求,并为1000座压缩沼气厂创造市场。中国企业,例如BP投资嘉澳生物燃料公司规划中的SAF生产线,显示了其致力于航空业脱碳的决心。丰富的农业残余物、上行风险以及有利的财政奖励,共同造就了亚洲在全球生质燃料市场中无可匹敌的成长引擎。
其他福利:
- Excel格式的市场预测(ME)表
- 3个月的分析师支持
目录
第一章 引言
- 研究假设和市场定义
- 调查范围
第二章调查方法
第三章执行摘要
第四章 市场情势
- 市场概览
- 市场驱动因素
- 加强亚洲和南美洲交通运输业的燃料掺混强制规定
- 净零排放购电协议(PPA)推动了北美地区可再生柴油的需求。
- 欧盟和美国《通货膨胀控制法案》中的永续航空燃料(SAF)税收优惠
- 欧盟逐步淘汰棕榈油基原料,推动对藻类和废油的投资。
- 生物石脑油在石油化学原料脱碳领域的兴起
- 市场限制
- 原料价格(大豆、菜籽、废弃食用油)的波动正在给生产商的利润率带来压力。
- 印度和印尼农业残余物收集的基础设施瓶颈
- 欧洲间接土地利用变化(ILUC)的永续性上限
- 在远距航空领域,与可直接取代的电子燃料竞争
- 供应链分析
- 监管和技术趋势
- 波特五力模型
- 供应商的议价能力
- 买方的议价能力
- 新进入者的威胁
- 替代品的威胁
- 竞争对手之间的竞争
第五章 市场规模和成长预测(价值和数量)
- 按燃料类型
- 生质乙醇
- 生质柴油(FAME)
- 可再生柴油/氢化植物油
- 永续航空燃料(SAF)
- 生物石脑油和其他可直接取代的生质燃料
- 按世代
- 第一代(醣类和淀粉)
- 第二代(纤维素基)
- 第三代(藻类基)
- 第四代(合成生物学/光生物学)
- 按原料
- 糖料作物(甘蔗、甜菜)
- 淀粉作物(玉米、小麦、木薯)
- 油籽(大豆、油菜籽、棕榈)
- 废弃食用油和动物脂肪
- 木质纤维素农业残渣
- 藻类
- 透过技术
- 发酵
- 酯交换反应
- 加氢处理(HVO/SAF)
- 气化和费托合成
- 热解与重整
- 按最终用途
- 道路运输
- 航空
- 船运
- 发电和供热
- 按地区
- 北美洲
- 我们
- 加拿大
- 墨西哥
- 欧洲
- 德国
- 法国
- 英国
- 丹麦
- 其他欧洲地区
- 亚太地区
- 中国
- 印度
- 印尼
- 日本
- 亚太其他地区
- 南美洲
- 巴西
- 阿根廷
- 智利
- 其他南美洲
- 中东和非洲
- 沙乌地阿拉伯
- 阿拉伯聯合大公国
- 南非
- 埃及
- 其他中东和非洲地区
- 北美洲
第六章 竞争情势
- 市场集中度
- 策略性倡议(併购、伙伴关係、购电协议)
- 市场占有率分析(主要企业的市场排名和份额)
- 公司简介
- Abengoa Bioenergy SA
- Archer Daniels Midland Co.
- BP plc
- Cargill Inc.
- Chevron Renewable Energy Group Inc.
- Cosan SA/Raizen
- Eni SpA(Eni Sustainable Mobility)
- Gevo Inc.
- Green Plains Inc.
- LanzaTech Global Inc.
- Neste Oyj
- POET LLC
- Petrobras
- Shell plc
- TotalEnergies SE
- Valero Energy Corp.(Diamond Green Diesel)
- Verbio Vereinigte BioEnergie AG
- Wilmar International Ltd.
- Aemetis Inc.
- Amyris Inc.
- Clariant AG
- Enerkem Inc.
- Pacific Ethanol(Alto Ingredients)
- Orsted A/S(Power-to-X Bio-methanol)
- Pacific Biodiesel Technologies
第七章 市场机会与未来展望
The Biofuels market is expected to grow from USD 121.23 billion in 2025 to USD 136.94 billion in 2026 and is forecast to reach USD 252.12 billion by 2031 at 12.96% CAGR over 2026-2031.
Growing decarbonization mandates in transportation, especially aviation, and scaled investments from oil majors are driving capacity additions that ease adoption barriers. Rapid shifts in technology from first-generation crop-based fuels toward waste-derived and synthetic biology solutions are improving life-cycle emissions and reducing feedstock risk. At the same time, government tax credits in North America and blending mandates in Asia are prompting long-term offtake contracts that stabilize prices for producers. Competitive intensity is rising because 43 refinery conversion and greenfield projects announced by leading petroleum companies will add multimillion-ton capacity before 2030, reshaping supply chains and narrowing cost gaps between renewable and fossil fuels.
Global Biofuels Market Trends and Insights
Transport-sector blend mandates intensifying in Asia & South America
Asian and South American governments are implementing higher blending requirements, which are reshaping feedstock allocation and production footprints. Indonesia's B40 program alone lifts biodiesel consumption to 13.15 million kiloliters annually, cutting diesel imports and saving USD 9 billion in foreign exchange. India is fast-tracking its move to 20% ethanol blending by 2025, which drives parallel investment in distillation and logistics assets. Similar policies in the Philippines and Thailand add regional momentum, while Brazil keeps its long-standing ethanol platform. These mandates support rural incomes, curb crude import bills, and establish predictable demand that de-risks plant expansions. Together, they underpin the steep growth outlook for the global biofuels market.
Net-zero-aligned corporate PPAs driving renewable diesel demand in North America
Major logistics and retail brands now sign multiyear purchase agreements that guarantee low-carbon fuel supply beyond regulatory minimums. DHL Group intends to source 300,000 tons of SAF annually by 2030 under a partnership with Neste . California's Low Carbon Fuel Standard enables participating firms to monetize greenhouse-gas credits, which are often valued above the physical fuel price, thereby further sweetening long-term economics. These corporate commitments provide producers with clearer revenue visibility, enabling them to secure debt financing for new hydrotreatment units across the United States and Canada.
Volatile Feedstock Prices (Soy, Rapeseed, UCO) Squeezing Producer Margins
Soybean oil, used cooking oil, and tallow prices swung 40-60% during 2024, eroding margins and complicating hedge strategies for refiners. Fraud-related disruptions in European waste-oil imports inflated prices while creating challenges to traceability. Producers are countering volatility by diversifying into residues such as forestry waste and municipal sludges, although preprocessing adds capital cost and complexity. Near-term profitability, therefore, depends on agile feedstock portfolios and robust credit markets that offset commodity swings.
Other drivers and restraints analyzed in the detailed report include:
- SAF tax incentives in the EU & U.S. Inflation Reduction Act
- Palm feedstock phase-out prompting algae & waste-oil investment in Europe
- Infrastructure bottlenecks in collecting agri-residues in India & Indonesia
For complete list of drivers and restraints, kindly check the Table Of Contents.
Segment Analysis
Sustainable aviation fuel volumes scale from a small base at a 34.98% CAGR, reflecting airlines' need for immediate emissions cuts and supportive mandates. Bioethanol retains the lion's share because it is entrenched in U.S. E10 and Brazilian E27 blends. Yet hydrotreatment's ability to co-produce SAF, renewable diesel, and bio-naphtha is shifting capital toward drop-in molecules that fit existing pipelines.
Second-generation biodiesel is plateauing because of compatibility issues with newer engine systems in cold climates. In contrast, renewable diesel gains market share thanks to its superior cetane numbers and parity with fossil diesel in terms of infrastructure. High-value co-products such as bio-propane further enhance project economics. The global biofuels market is therefore shifting toward fuels with cross-sector appeal and higher carbon credit valuation.
First-generation fuels still account for 67.62% of sales, driven primarily by sugarcane ethanol in Brazil and corn ethanol in the United States. The global biofuels market size for first-generation pathways is expected to rise modestly; however, the relative share will decline as advanced options scale. Third-generation algae projects now demonstrate 15.92% CAGR after genetics and photobioreactor advances cut production costs by double digits.
Recent university studies show that engineered microalgae can convert 85% of waste oil into lipids suitable for hydrotreatment, thereby reducing land-use concerns. Second-generation cellulosic facilities, such as LanzaJet's ethanol-to-SAF plant, are finally hitting commercial throughput and proving enzyme efficiency gains. Fourth-generation synthetic biology remains pre-commercial but attracts venture funding because it promises direct fuel synthesis from captured CO2.
The Biofuels Market Report is Segmented by Fuel Type (Bioethanol, Biodiesel, Renewable Diesel, and More), Generation (First-Generation, Third-Generation, and More), Feedstock (Sugar Crops, Starch Crops, Algae, and More), Technology (Fermentation, Trans-Esterification, Hydrotreatmen, and More), End-Use (Road Transport, Aviation, Marine, and Power Generation and Heating), and Geography (North America, Europe, Asia-Pacific, and More).
Geography Analysis
North America is expected to control 42.56% of the global biofuels market in 2025, driven by mature corn ethanol plants, the growth of soybean oil-based renewable diesel, and generous tax credits. Installed renewable diesel capacity doubles to 5.2 billion gallons by 2025, and California's LCFS consumes nearly the entire domestic pool, creating a stable price floor. The region's policy clarity enables producers to secure financing quickly, while robust grain handling infrastructure ensures a stable feedstock flow. Mexico's recent mandate extensions and Canada's clean fuel regulations further enlarge regional demand.
Europe is transforming as the Renewable Energy Directive III sets a 42.5% renewable energy target by 2030 and phases out the use of palm oil feedstocks. Germany banned carry-over of prior-year greenhouse-gas certificates starting in 2025, forcing obligated parties to purchase more advanced biofuels immediately. Anti-dumping duties on Chinese biodiesel reroute trade and raise premiums for domestic HVO, encouraging local capacity additions. The complex policy mix fosters technological innovation while keeping volume growth moderate due to feedstock constraints.
Asia-Pacific posts the highest regional CAGR at 16.78%. Indonesia's B40 mandate absorbs 13.15 million kiloliters of biodiesel annually and saves USD 15 billion in foreign exchange, while supporting the incomes of smallholder palm farmers . India's march toward 20% ethanol by 2025 boosts demand for grain and molasses ethanol and seeds the market for 1,000 compressed-biogas plants. China's joint ventures, such as BP's stake in Jiaao's upcoming SAF line, signal intent to decarbonize aviation. Ample agricultural residues, rising oil-price exposure, and supportive fiscal incentives combine to make Asia an unrivaled growth engine for the global biofuels market.
- Abengoa Bioenergy SA
- Archer Daniels Midland Co.
- BP p.l.c.
- Cargill Inc.
- Chevron Renewable Energy Group Inc.
- Cosan S.A. / Raizen
- Eni S.p.A. (Eni Sustainable Mobility)
- Gevo Inc.
- Green Plains Inc.
- LanzaTech Global Inc.
- Neste Oyj
- POET LLC
- Petrobras
- Shell p.l.c.
- TotalEnergies SE
- Valero Energy Corp. (Diamond Green Diesel)
- Verbio Vereinigte BioEnergie AG
- Wilmar International Ltd.
- Aemetis Inc.
- Amyris Inc.
- Clariant AG
- Enerkem Inc.
- Pacific Ethanol (Alto Ingredients)
- Orsted A/S (Power-to-X Bio-methanol)
- Pacific Biodiesel Technologies
Additional Benefits:
- The market estimate (ME) sheet in Excel format
- 3 months of analyst support
TABLE OF CONTENTS
1 Introduction
- 1.1 Study Assumptions & Market Definition
- 1.2 Scope of the Study
2 Research Methodology
3 Executive Summary
4 Market Landscape
- 4.1 Market Overview
- 4.2 Market Drivers
- 4.2.1 Transport-sector Blend Mandates Intensifying in Asia & South America
- 4.2.2 Net-Zero-Aligned Corporate PPAs Driving Renewable Diesel Demand in North America
- 4.2.3 SAF (Sustainable Aviation Fuel) Tax Incentives in the EU & U.S. Inflation Reduction Act
- 4.2.4 Phasing-Out of Palm-based Feedstocks Prompting Algae & Waste-Oil Investments in EU
- 4.2.5 Emergence of Bio-naphtha for Petro-Chem Feedstock Decarbonisation
- 4.3 Market Restraints
- 4.3.1 Volatile Feedstock Prices (Soy, Rapeseed, UCO) Squeezing Producer Margins
- 4.3.2 Infrastructure Bottlenecks in Collecting Agri-Residues in India & Indonesia
- 4.3.3 Indirect Land-Use-Change (ILUC) Sustainability Caps in Europe
- 4.3.4 Competition from Drop-in e-Fuels in Long-haul Aviation
- 4.4 Supply-Chain Analysis
- 4.5 Regulatory & Technological Outlook
- 4.6 Porter's Five Forces
- 4.6.1 Bargaining Power of Suppliers
- 4.6.2 Bargaining Power of Buyers
- 4.6.3 Threat of New Entrants
- 4.6.4 Threat of Substitutes
- 4.6.5 Competitive Rivalry
5 Market Size & Growth Forecasts (Value & Volume)
- 5.1 By Fuel Type
- 5.1.1 Bioethanol
- 5.1.2 Biodiesel (FAME)
- 5.1.3 Renewable Diesel / HVO
- 5.1.4 Sustainable Aviation Fuel (SAF)
- 5.1.5 Bio-naphtha and Other Drop-in Biofuels
- 5.2 By Generation
- 5.2.1 First-Generation (Sugar & Starch)
- 5.2.2 Second-Generation (Cellulosic)
- 5.2.3 Third-Generation (Algae-based)
- 5.2.4 Fourth-Generation (Synthetic Biology/Photobiological)
- 5.3 By Feedstock
- 5.3.1 Sugar Crops (Sugarcane, Sugar Beet)
- 5.3.2 Starch Crops (Corn, Wheat, Cassava)
- 5.3.3 Oilseeds (Soy, Rapeseed, Palm)
- 5.3.4 Used Cooking Oil and Animal Fat
- 5.3.5 Lignocellulosic Agri-Residues
- 5.3.6 Algae
- 5.4 By Technology
- 5.4.1 Fermentation
- 5.4.2 Trans-esterification
- 5.4.3 Hydrotreatment (HVO/SAF)
- 5.4.4 Gasification and FT-Synthesis
- 5.4.5 Pyrolysis and Upgrading
- 5.5 By End-use Sector
- 5.5.1 Road Transport
- 5.5.2 Aviation
- 5.5.3 Marine
- 5.5.4 Power Generation and Heating
- 5.6 By Geography
- 5.6.1 North America
- 5.6.1.1 United States
- 5.6.1.2 Canada
- 5.6.1.3 Mexico
- 5.6.2 Europe
- 5.6.2.1 Germany
- 5.6.2.2 France
- 5.6.2.3 United Kingdom
- 5.6.2.4 Denmark
- 5.6.2.5 Rest of Europe
- 5.6.3 Asia-Pacific
- 5.6.3.1 China
- 5.6.3.2 India
- 5.6.3.3 Indonesia
- 5.6.3.4 Japan
- 5.6.3.5 Rest of Asia-Pacific
- 5.6.4 South America
- 5.6.4.1 Brazil
- 5.6.4.2 Argentina
- 5.6.4.3 Chile
- 5.6.4.4 Rest of South America
- 5.6.5 Middle East and Africa
- 5.6.5.1 Saudi Arabia
- 5.6.5.2 United Arab Emirates
- 5.6.5.3 South Africa
- 5.6.5.4 Egypt
- 5.6.5.5 Rest of Middle East and Africa
- 5.6.1 North America
6 Competitive Landscape
- 6.1 Market Concentration
- 6.2 Strategic Moves (M&A, Partnerships, PPAs)
- 6.3 Market Share Analysis (Market Rank/Share for key companies)
- 6.4 Company Profiles (includes Global level Overview, Market level overview, Core Segments, Financials as available, Strategic Information, Products & Services, and Recent Developments)
- 6.4.1 Abengoa Bioenergy SA
- 6.4.2 Archer Daniels Midland Co.
- 6.4.3 BP p.l.c.
- 6.4.4 Cargill Inc.
- 6.4.5 Chevron Renewable Energy Group Inc.
- 6.4.6 Cosan S.A. / Raizen
- 6.4.7 Eni S.p.A. (Eni Sustainable Mobility)
- 6.4.8 Gevo Inc.
- 6.4.9 Green Plains Inc.
- 6.4.10 LanzaTech Global Inc.
- 6.4.11 Neste Oyj
- 6.4.12 POET LLC
- 6.4.13 Petrobras
- 6.4.14 Shell p.l.c.
- 6.4.15 TotalEnergies SE
- 6.4.16 Valero Energy Corp. (Diamond Green Diesel)
- 6.4.17 Verbio Vereinigte BioEnergie AG
- 6.4.18 Wilmar International Ltd.
- 6.4.19 Aemetis Inc.
- 6.4.20 Amyris Inc.
- 6.4.21 Clariant AG
- 6.4.22 Enerkem Inc.
- 6.4.23 Pacific Ethanol (Alto Ingredients)
- 6.4.24 Orsted A/S (Power-to-X Bio-methanol)
- 6.4.25 Pacific Biodiesel Technologies
7 Market Opportunities & Future Outlook
- 7.1 White-space & Unmet-Need Assessment
- 7.2 Next-Gen Electro-Bio-Refineries Integrating Green H2
 生质燃料市场:2026-2032年全球市场预测(依生质燃料类型、製造流程、形态、原料类型、应用、最终用途及通路划分)乳化燃料市场:2026-2032年全球市场预测(按燃料类型、混合比例、分销管道、应用和最终用户划分)
 单细胞油市场规模、份额、成长及全球产业分析:按类型和应用、区域洞察及2026-2034年预测
 燃油品质感测器-全球市场份额和排名、总销售量和需求预测(2026-2032 年)
 2026年全球生质燃料催化剂市场研究报告
 交通运输用生质燃料的市场机会、成长要素、产业趋势分析及 2026-2035 年预测。全球交通运输用生质燃料市场:规模、份额、趋势和成长分析报告(2026-2034年)全球生物氢市场规模、份额、趋势和成长分析报告(2026-2034年)全球生质燃料市场规模、份额、趋势和成长分析报告(2026-2034年)
 日本生质燃料市场规模、份额、趋势和预测:按类型、原材料和地区划分,2026-2034年