


 |
市场调查报告书
商品编码
1939137
智慧工厂:市场占有率分析、产业趋势与统计、成长预测(2026-2031)Smart Factory - Market Share Analysis, Industry Trends & Statistics, Growth Forecasts (2026 - 2031) |
||||||
※ 本网页内容可能与最新版本有所差异。详细情况请与我们联繫。
预计到 2026 年,智慧工厂市场规模将达到 4,266.5 亿美元,高于 2025 年的 3,891.4 亿美元,预计到 2031 年将达到 6,758.2 亿美元。
预计2026年至2031年年复合成长率(CAGR)为9.64%。
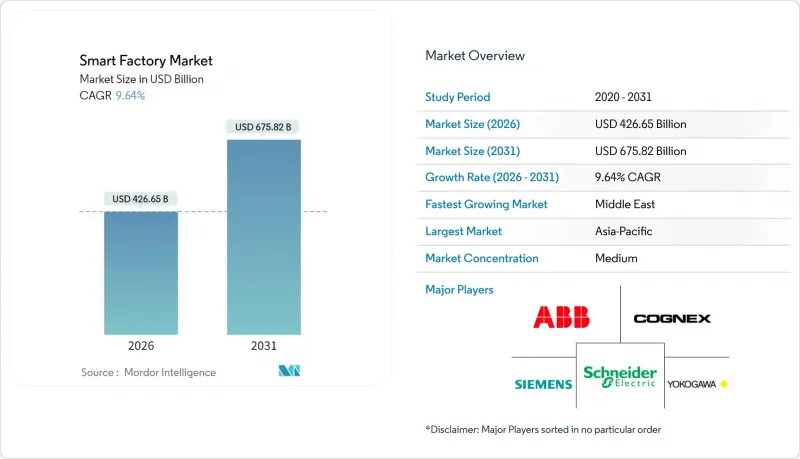
对自主和数据驱动型生产系统的强劲需求、感测器和边缘人工智慧成本的下降以及政策奖励的支持,共同推动了这一成长趋势。製造商正在采用工业IoT平台、数位双胞胎和机器视觉引导机器人,以缩短换线时间、降低能耗并减少离散製造和流程产业的废弃物。东南亚和中东地区的新投资正在加速成长,而由于碳定价机制的加强,欧洲和北美地区现有设施的维修也势头强劲。竞争格局有利于能够提供硬体、软体和网路安全保全服务整合解决方案的供应商,从而加快製造商的投资回报週期。
全球智慧工厂市场趋势与洞察
工业IoT平台的广泛应用
工业IoT平台整合了感测器、致动器和控制系统,建构即时数据管道,从而驱动预测性维护和自主优化。标准化通讯协定和边缘网关最大限度地降低了部署复杂性,并实现了跨传统资产的经济高效部署。例如,Guidewheel 在 2024 年筹集了 3,100 万美元,用于加速其即插即用的 FactoryOps 解决方案的开发,该方案无需重新布线即可传输机器资料。製造执行系统 (MES) 越来越多地整合物联网连接器,负责人吞吐量、品质和能源指标的统一视图。专用 5G 网路的广泛应用进一步增强了物联网的价值提案,实现了汽车组装上安全的人机协作所需的亚毫秒延迟。国家补贴计划,例如印度的食品加工生产关联奖励计划 (PLI),正在降低早期财务门槛,并鼓励中小企业更多地采用物联网技术。
端到端能源优化的需求
不断上涨的电费和净零排放目标使能源效率成为经营团队的首要任务。智慧工厂平台透过应用基于人工智慧的预测、自动负载平衡和功率因数校正,可将能耗降低20%至40%。宝马雷根斯堡工厂在实施一套连接400个感测器的AI能源管理系统后,电力消耗降低了30%。数位双胞胎技术允许在设备安装前建造动态的热流和气流模型,从而减少空调设备的过度设计,避免资金浪费。参与需量反应计划可以帮助工厂调整生产计划并稳定电网,从而产生额外收入。欧盟的绿色税收优惠政策可以加快投资回报,鼓励製造商用智慧逆变器取代固定速度驱动装置,并采用能够为低碳生产提供最佳时机提案的节能型MES模组。
改造现有工厂需要大量的初始资本投资。
将一座2010年以前建成的工厂改造为互联工厂通常需要花费超过1000万美元,其中包括电气升级、网路布线和停机时间。传统的PLC可能没有乙太网路端口,需要客製化韧体和通讯协定转换器,这会增加工程工时。Schneider Electric估计,现有工厂的投资回收期长达五年,而新建设的投资回收期仅为两年,这给资金有限的中型企业带来了一定的障碍。虽然模组化维修套件和订阅定价模式正在减轻负担,但宏观经济的不确定性仍然让财务长保持谨慎。
细分市场分析
工业机器人是最大的收入来源,预计到2025年将占据智慧工厂市场份额的31.35%。需求主要来自关节灵活、协作性强的机器人,它们能够减轻工人重复性且对人体工学要求高的任务。随着终端用户利用模组化硬体实现不同型号之间的无缝衔接,无需重新改造即可使用,机器人技术驱动的智慧工厂市场规模正在稳步增长。儘管目前机器视觉系统规模较小,但预计到2031年,在深度学习相机价格下降的推动下,其复合年增长率将达到10.08%。整合机器人和视觉功能的单元能够减少检测工作量,并将一次性合格率提升至六标准差水准。随着原始设备製造商(OEM)不断整合节能韧体,智慧驱动器和伺服马达等控制组件正经历良性更新。感测器阵列的广泛应用仍在继续,它们能够将振动、温度和湿度数据传输到预测性维护仪表板,从而防止非计划性停机。
私有5G连接与时间敏感型网路技术的整合将为自主移动机器人提供确定性的无线链路,从而实现按需交付。积层製造将促进渐进式成长,尤其是在航太工具和医疗植入。同时,外骨骼和穿戴式扫描仪在轻型组装环境中的出现,模糊了机器人技术与人类增强之间的界线。整体产品趋势反映出自动化系统正从孤立的「孤岛」转变为整合生态系统转变,其中边缘运算节点能够即时协调视觉、运动和品质分析。
区域分析
到2025年,亚太地区将占全球收入份额的40.20%,巩固中国作为全球製造业核心的地位。 「中国製造2025」等强而有力的政府政策正在津贴智慧工厂维修,而韩国和台湾则大力投资3D视觉技术和半导体製造工厂。越南、泰国和印尼透过税收优惠和数位化产业园区吸引外商直接投资。该地区控制着全球80%的稀土元素磁体提炼量,这进一步凸显了其主导地位,也为当地机器人製造商提供了供应链优势。网路安全和劳动力技能提升仍然是挑战,但政策制定者正在启动全国性的技能提升计划,以应对人才短缺问题。
中东是成长最快的地区,年复合成长率达10.02%。沙乌地阿拉伯1300亿美元的国家工业战略和阿联酋的「3000亿美元行动」计画正将大量资金投入石化联合企业和先进材料工厂。待开发区工厂从一开始就能采用模组化、网路安全架构,避免了代价高昂的传统维修。主权财富基金正与欧洲和亚洲的供应商合作,建立合资企业,以实现机器人组装和製造执行系统(MES)软体客製化的本地化。沿岸地区独特的高温高尘环境,对耐环境腐蚀的防护罩和先进的冷却解决方案提出了独特的需求。
随着製造业回流北美的趋势日益明显,北美市场蓄势待发。 《晶片与科学法案》将向配备封闭回路型辐射控制和人工智慧缺陷分类功能的新型晶圆厂注入数十亿美元资金。汽车製造商正投资电池组生产线和软体定义车辆架构,这些都需要高频宽的工厂内部网路。欧洲製造商为响应碳中和的《55岁以上人群适用性法案》,持续升级其工厂,并利用绿色税额扣抵和能源价格对冲来证明智慧工厂预算的合理性。南美洲和非洲市场虽然规模较小,但仍充满潜力,各国政府正寻求税收优惠和公私合营,以减少对资源出口的依赖。
其他福利:
- Excel格式的市场预测(ME)表
- 3个月的分析师支持
目录
第一章 引言
- 研究假设和市场定义
- 调查范围
第二章调查方法
第三章执行摘要
第四章 市场情势
- 市场概览
- 市场驱动因素
- 工业IoT平台的广泛应用
- 端到端能源优化的需求
- 加大政府对智慧製造的奖励
- 用于即时品管的边缘AI晶片
- 开放原始码数位双胞胎可降低整合成本
- 在绿色税收制度下维修现有工厂
- 市场限制
- 改造现有设施需要较高的初始资本投入。
- OT网路中的网路安全漏洞
- 具备互通能力的OT-IT人才短缺
- 机器人致动器稀土供应不稳定
- 产业价值链分析
- 宏观经济因素的影响
- 监管环境
- 技术展望
- 波特五力分析
- 供应商的议价能力
- 买方的议价能力
- 新进入者的威胁
- 替代品的威胁
- 竞争强度
第五章 市场规模与成长预测
- 依产品类型
- 机器视觉系统
- 相机
- 处理器
- 软体
- 围栏
- 影像撷取卡
- 整合服务
- 照明
- 工业机器人
- 关节机器人
- 笛卡儿机器人
- 圆柱形机器人
- SCARA机器人
- 并联机器人
- 协作工业机器人
- 控制设备
- 继电器和开关
- 伺服马达和驱动器
- 感应器
- 通讯科技
- 有线
- 无线的
- 其他产品类型
- 机器视觉系统
- 透过技术
- 产品生命週期管理(PLM)
- 人机介面(HMI)
- 企业资源规划(ERP)
- 製造执行系统(MES)
- 分散式控制系统(DCS)
- 监控与数据采集(SCADA)
- 可程式逻辑控制器(PLC)
- 其他技术
- 按最终用户行业划分
- 车
- 半导体
- 石油和天然气
- 化工/石油化工
- 製药
- 航太与国防
- 食品/饮料
- 矿业
- 其他终端用户产业
- 按地区
- 北美洲
- 我们
- 加拿大
- 墨西哥
- 南美洲
- 巴西
- 阿根廷
- 南美洲其他地区
- 欧洲
- 德国
- 英国
- 法国
- 义大利
- 其他欧洲地区
- 亚太地区
- 中国
- 日本
- 印度
- 韩国
- 澳洲和纽西兰
- 亚太其他地区
- 中东
- 沙乌地阿拉伯
- 阿拉伯聯合大公国
- 土耳其
- 其他中东地区
- 非洲
- 南非
- 奈及利亚
- 肯亚
- 其他非洲地区
- 北美洲
第六章 竞争情势
- 市场集中度
- 策略趋势
- 市占率分析
- 公司简介
- Siemens AG
- ABB Ltd
- Schneider Electric SE
- Rockwell Automation Inc.
- Honeywell International Inc.
- Mitsubishi Electric Corporation
- Fanuc Corporation
- Emerson Electric Co.
- Yokogawa Electric Corporation
- KUKA AG
- Cognex Corporation
- Robert Bosch GmbH
- Teledyne FLIR LLC
- General Electric Company
- Cisco Systems Inc.
- SAP SE
- PTC Inc.
- Dassault Systemes SE
- Intel Corporation
- Hewlett Packard Enterprise Company
第七章 市场机会与未来展望
The smart factory market size in 2026 is estimated at USD 426.65 billion, growing from 2025 value of USD 389.14 billion with 2031 projections showing USD 675.82 billion, growing at 9.64% CAGR over 2026-2031.
Robust demand for autonomous, data-driven production systems, falling sensor and edge AI costs, and supportive policy incentives underpin this trajectory. Manufacturers deploy industrial IoT platforms, digital twins, and machine-vision-guided robotics to shrink changeover times, cut energy use, and reduce scrap across discrete and process industries. Greenfield investments accelerate in Southeast Asia and the Middle East, while brownfield retrofits gather momentum in Europe and North America as carbon-pricing regimes tighten. Competitive dynamics favor vendors able to bundle hardware, software, and cybersecurity services into integrated offerings that shorten payback periods for manufacturers.
Global Smart Factory Market Trends and Insights
Growing Adoption of Industrial IoT Platforms
Industrial IoT platforms unify sensors, actuators, and control systems, creating real-time data pipelines that drive predictive maintenance and autonomous optimization. Standardized protocols and edge gateways minimize deployment complexity, enabling cost-effective rollout across legacy equipment. Guidewheel, for example, raised USD 31 million in 2024 to accelerate its plug-and-play FactoryOps solution that streams machine data without invasive rewiring. Manufacturing execution systems increasingly embed IoT connectors, giving planners a single pane of glass for throughput, quality, and energy metrics. The spread of private 5G networks further strengthens IoT value propositions by delivering sub-millisecond latency required for safe human-robot collaboration on automotive assembly lines. National subsidy programs such as India's Production-Linked Incentive Scheme for food processing lower early-stage financial barriers and broaden adoption among small and medium enterprises.
Demand for End-to-End Energy Optimization
Rising electricity tariffs and net-zero targets turn energy efficiency into a board-level priority. Smart factory platforms cut consumption 20-40% by applying AI-based forecasting, automated load-balancing, and power-factor correction. BMW's Regensburg plant reports 30% lower electricity use after deploying an AI energy management system connected to 400 sensors. Digital twins let engineers model thermal and airflow dynamics before equipment installation, reducing HVAC oversizing and avoiding capital waste. Participation in demand-response programs generates ancillary revenue as factories flex production schedules to support grid stability. European Union green-tax credits accelerate return on investment, prompting manufacturers to replace fixed-speed drives with smart inverters and to install energy-aware MES modules that recommend low-carbon production windows.
High Upfront CAPEX for Brownfield Transformation
Converting pre-2010 factories into connected plants often costs more than USD 10 million once electrical upgrades, network cabling, and downtime are included. Legacy PLCs may lack Ethernet ports, forcing custom firmware and protocol converters that add engineering hours. Schneider Electric estimates brownfield payback can stretch to five years versus two years for greenfield builds, discouraging mid-market firms with limited cash buffers. Modular retrofit kits and subscription pricing models partially ease the burden, yet CFOs remain cautious amid macroeconomic uncertainty.
Other drivers and restraints analyzed in the detailed report include:
- Rising Government Incentives for Smart Manufacturing
- Edge AI Chips Enabling Real-Time Quality Control
- Cybersecurity Vulnerabilities within OT Networks
For complete list of drivers and restraints, kindly check the Table Of Contents.
Segment Analysis
Industrial robotics generated the largest revenue slice, accounting for 31.35% smart factory market share in 2025. Demand stems from articulated and collaborative units that lift repetitive ergonomically taxing tasks from workers. The smart factory market size attributed to robotics grows steadily as end-users exploit modular hardware that can shift across models without re-tooling. Machine vision systems, though smaller today, register an 10.08% CAGR through 2031 as deep-learning cameras become affordable. Integrated robot-vision cells reduce inspection labor and push first-pass yield toward six sigma. Control components such as smart drives and servo motors see healthy replacement cycles as OEMs embed power-saving firmware. Sensor arrays continue broad deployment, feeding vibration, temperature, and humidity data into predictive maintenance dashboards that prevent unplanned downtime.
The convergence of private 5G connectivity and time-sensitive networking creates deterministic wireless links for autonomous mobile robots that deliver kits just-in-sequence. Additive manufacturing contributes incremental growth, especially in aerospace tooling and medical implants requiring customized geometries. Meanwhile, exoskeletons and wearable scanners emerge in light-assembly environments, blurring lines between robotics and human augmentation. The overall product landscape reflects a shift from standalone automation islands to orchestrated ecosystems where edge compute nodes coordinate vision, motion, and quality analytics in real time.
The Smart Factory Market Report is Segmented by Product Type (Machine Vision Systems, Industrial Robotics, Control Devices, Sensors, and More), Technology (PLM, HMI, ERP, MES, DCS, SCADA, PLC, and More), End-User Industry (Automotive, Semiconductors, Oil and Gas, Chemical and Petrochemical, Pharmaceutical, Aerospace and Defense, Food and Beverage, and More), and Geography. The Market Forecasts are Provided in Terms of Value (USD).
Geography Analysis
Asia Pacific captured 40.20% share of 2025 revenue as China cemented its position as the global manufacturing nucleus. Robust governmental agendas such as "Made in China 2025" subsidize smart factory retrofits, while South Korea and Taiwan pour resources into 3D vision and semiconductor fabs. Vietnam, Thailand, and Indonesia lure foreign direct investment with tax holidays and digital-friendly industrial parks. The region's dominance is further underpinned by its control of 80% of rare-earth magnet refining, giving local robotics producers supply-chain leverage. Cybersecurity and workforce reskilling remain pain points, but policy authorities launch nationwide upskilling programs to address talent gaps.
The Middle East is the fastest-growing region at a 10.02% CAGR. Saudi Arabia's USD 130 billion National Industrial Strategy and the UAE's Operation 300bn funnel capital into petrochemical complexes and advanced materials plants. Greenfield construction means factories can embed modular, cyber-secure architectures from day one, avoiding costly legacy remediation. Sovereign wealth funds partner with European and Asian vendors, establishing joint ventures that localize robot assembly and MES software customization. The heat and dust characteristic of Gulf environments drive unique demand for ruggedized enclosures and advanced cooling solutions.
North American momentum accelerates as reshoring gains ground. The CHIPS and Science Act channels billions into new fabs equipped with closed-loop lithography control and AI defect classification. Automotive OEMs invest in battery pack lines and software-defined vehicle architectures that demand high-bandwidth in-plant networks. European manufacturers continue upgrading factories in response to carbon "Fit for 55" legislation, leveraging green-tax credits and energy-price hedging to justify smart factory budgets. South America and Africa remain smaller but promising as governments explore tax incentives and public-private partnerships to diversify away from commodity exports.
- Siemens AG
- ABB Ltd
- Schneider Electric SE
- Rockwell Automation Inc.
- Honeywell International Inc.
- Mitsubishi Electric Corporation
- Fanuc Corporation
- Emerson Electric Co.
- Yokogawa Electric Corporation
- KUKA AG
- Cognex Corporation
- Robert Bosch GmbH
- Teledyne FLIR LLC
- General Electric Company
- Cisco Systems Inc.
- SAP SE
- PTC Inc.
- Dassault Systemes SE
- Intel Corporation
- Hewlett Packard Enterprise Company
Additional Benefits:
- The market estimate (ME) sheet in Excel format
- 3 months of analyst support
TABLE OF CONTENTS
1 INTRODUCTION
- 1.1 Study Assumptions and Market Definition
- 1.2 Scope of the Study
2 RESEARCH METHODOLOGY
3 EXECUTIVE SUMMARY
4 MARKET LANDSCAPE
- 4.1 Market Overview
- 4.2 Market Drivers
- 4.2.1 Growing adoption of industrial IoT platforms
- 4.2.2 Demand for end-to-end energy optimisation
- 4.2.3 Rising government incentives for smart manufacturing
- 4.2.4 Edge AI chips enabling real-time quality control
- 4.2.5 Open-source digital twins lowering integration cost
- 4.2.6 Green-tax-driven retrofit of legacy factories
- 4.3 Market Restraints
- 4.3.1 High upfront CAPEX for brownfield transformation
- 4.3.2 Cybersecurity vulnerabilities within OT networks
- 4.3.3 Shortage of interoperable OT-IT talent
- 4.3.4 Volatile rare-earth supply for robotics actuators
- 4.4 Industry Value Chain Analysis
- 4.5 Impact of Macroeconomic Factors
- 4.6 Regulatory Landscape
- 4.7 Technological Outlook
- 4.8 Porter's Five Forces Analysis
- 4.8.1 Bargaining Power of Suppliers
- 4.8.2 Bargaining Power of Buyers
- 4.8.3 Threat of New Entrants
- 4.8.4 Threat of Substitute Products
- 4.8.5 Intensity of Competition
5 MARKET SIZE AND GROWTH FORECASTS (VALUE)
- 5.1 By Product Type
- 5.1.1 Machine Vision Systems
- 5.1.1.1 Cameras
- 5.1.1.2 Processors
- 5.1.1.3 Software
- 5.1.1.4 Enclosures
- 5.1.1.5 Frame Grabbers
- 5.1.1.6 Integration Services
- 5.1.1.7 Lighting
- 5.1.2 Industrial Robotics
- 5.1.2.1 Articulated Robots
- 5.1.2.2 Cartesian Robots
- 5.1.2.3 Cylindrical Robots
- 5.1.2.4 SCARA Robots
- 5.1.2.5 Parallel Robots
- 5.1.2.6 Collaborative Industry Robots
- 5.1.3 Control Devices
- 5.1.3.1 Relays and Switches
- 5.1.3.2 Servo Motors and Drives
- 5.1.4 Sensors
- 5.1.5 Communication Technologies
- 5.1.5.1 Wired
- 5.1.5.2 Wireless
- 5.1.6 Other Product Types
- 5.1.1 Machine Vision Systems
- 5.2 By Technology
- 5.2.1 Product Lifecycle Management (PLM)
- 5.2.2 Human Machine Interface (HMI)
- 5.2.3 Enterprise Resource Planning (ERP)
- 5.2.4 Manufacturing Execution System (MES)
- 5.2.5 Distributed Control System (DCS)
- 5.2.6 Supervisory Control and Data Acquisition (SCADA)
- 5.2.7 Programmable Logic Controller (PLC)
- 5.2.8 Other Technologies
- 5.3 By End-user Industry
- 5.3.1 Automotive
- 5.3.2 Semiconductors
- 5.3.3 Oil and Gas
- 5.3.4 Chemical and Petrochemical
- 5.3.5 Pharmaceutical
- 5.3.6 Aerospace and Defense
- 5.3.7 Food and Beverage
- 5.3.8 Mining
- 5.3.9 Other End-user Industries
- 5.4 By Geography
- 5.4.1 North America
- 5.4.1.1 United States
- 5.4.1.2 Canada
- 5.4.1.3 Mexico
- 5.4.2 South America
- 5.4.2.1 Brazil
- 5.4.2.2 Argentina
- 5.4.2.3 Rest of South America
- 5.4.3 Europe
- 5.4.3.1 Germany
- 5.4.3.2 United Kingdom
- 5.4.3.3 France
- 5.4.3.4 Italy
- 5.4.3.5 Rest of Europe
- 5.4.4 Asia Pacific
- 5.4.4.1 China
- 5.4.4.2 Japan
- 5.4.4.3 India
- 5.4.4.4 South Korea
- 5.4.4.5 Australia and New Zealand
- 5.4.4.6 Rest of Asia Pacific
- 5.4.5 Middle East
- 5.4.5.1 Saudi Arabia
- 5.4.5.2 United Arab Emirates
- 5.4.5.3 Turkey
- 5.4.5.4 Rest of Middle East
- 5.4.6 Africa
- 5.4.6.1 South Africa
- 5.4.6.2 Nigeria
- 5.4.6.3 Kenya
- 5.4.6.4 Rest of Africa
- 5.4.1 North America
6 COMPETITIVE LANDSCAPE
- 6.1 Market Concentration
- 6.2 Strategic Moves
- 6.3 Market Share Analysis
- 6.4 Company Profiles (includes Global level Overview, Market level overview, Core Segments, Financials as available, Strategic Information, Market Rank/Share for key companies, Products and Services, and Recent Developments)
- 6.4.1 Siemens AG
- 6.4.2 ABB Ltd
- 6.4.3 Schneider Electric SE
- 6.4.4 Rockwell Automation Inc.
- 6.4.5 Honeywell International Inc.
- 6.4.6 Mitsubishi Electric Corporation
- 6.4.7 Fanuc Corporation
- 6.4.8 Emerson Electric Co.
- 6.4.9 Yokogawa Electric Corporation
- 6.4.10 KUKA AG
- 6.4.11 Cognex Corporation
- 6.4.12 Robert Bosch GmbH
- 6.4.13 Teledyne FLIR LLC
- 6.4.14 General Electric Company
- 6.4.15 Cisco Systems Inc.
- 6.4.16 SAP SE
- 6.4.17 PTC Inc.
- 6.4.18 Dassault Systemes SE
- 6.4.19 Intel Corporation
- 6.4.20 Hewlett Packard Enterprise Company
7 MARKET OPPORTUNITIES AND FUTURE OUTLOOK
- 7.1 White-space and Unmet-need Assessment
 2026年全球智慧工厂市场报告
 智慧工厂市场分析及预测(至2035年):按类型、产品类型、服务、技术、组件、应用、流程、部署类型、最终用户和解决方案划分
 全球智慧工厂市场:市场规模、占有率、成长率、产业分析、依类型、应用和地区划分的分析以及未来预测(2026-2034)
 智慧工厂市场-全球产业规模、份额、趋势、机会及预测(依产品、技术、终端用户产业、地区及竞争格局划分,2021-2031年)
 日本智慧工厂市场报告(按现场设备、技术、最终用户产业和地区划分,2026-2034年)
 智慧工厂市场机会、成长驱动因素、产业趋势分析及预测(2025-2034年)2025 年至 2033 年智慧工厂市场规模、份额、趋势及预测(按现场设备、技术、最终用途产业及地区划分)
 全球智慧工厂市场(按组件、技术、连接性、公司规模、部署、应用领域和最终用途)预测 2025-2030
 智慧工厂市场:按组件、解决方案、製造业和地区划分
 全球智慧工厂市场(按组件和解决方案)预测(至 2030 年)