


 |
市场调查报告书
商品编码
1939608
太阳能逆变器:市场占有率分析、产业趋势与统计、成长预测(2026-2031)Solar PV Inverters - Market Share Analysis, Industry Trends & Statistics, Growth Forecasts (2026 - 2031) |
||||||
※ 本网页内容可能与最新版本有所差异。详细情况请与我们联繫。
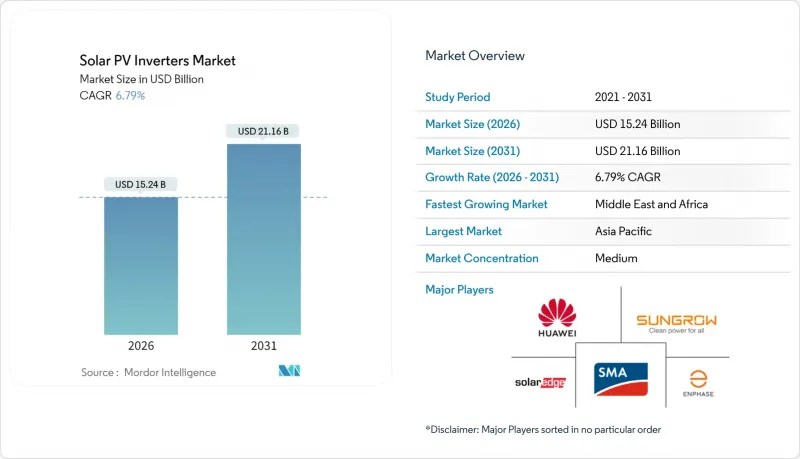
预计太阳能逆变器市场将从 2025 年的 142.7 亿美元成长到 2026 年的 152.4 亿美元,到 2031 年将达到 211.6 亿美元,2026 年至 2031 年的复合年增长率为 6.79%。
市场扩张的驱动力在于,从简单的直流 (DC) 转换到交流 (AC) 转换,再到智慧电网整形解决方案的转变,这些解决方案既能保护电能质量,又能为业主创造新的收入来源。亚太地区是全球需求的基础,而中东地区由于处于大规模公共产业计划和电网现代化计画,目前是成长最快的地区。日本强劲的升级週期、印度强制屋顶安装以及美国和欧洲高压设计的普及,都在推动近期销售增长;而中国持续的碳化硅/IGBT供不应求和日益增长的弃电,则抑制了市场扩张的速度。儘管存在这些不利因素,但先进电网支援功能的溢价仍然推动了太阳能逆变器市场的整体收入成长。
全球太阳能逆变器市场趋势与分析
大型计划中快速采用高压1500V串列型逆变器(美国、西班牙)
为了降低系统总成本并提高功率密度,电力开发商越来越多地采用 1500V 和 2000V 直流架构(试点阶段)。 GE Vernova 的 2000V 平台可将功率输出提高 30%,进而降低平准化能源成本。这种电压转型使得 1000V 阵列在新建设项目中经济效益下降,并推动了维修计划,尤其是在土地和电网余裕允许更大规模组件的地区。半导体需求的成长导致碳化硅 (SiC) 装置供应趋紧,使得各大品牌的热设计专业知识具有重要的策略意义。
印度强製商业建筑安装屋顶太阳能係统将提振对100kW以下逆变器的需求。
印度政策强制要求新建和现有商业建筑安装屋顶光伏阵列,从而持续推动对100kW以下逆变器的需求。 2024财年新增4GW的装置容量创下历史新高,充分展现了该市场的规模。印度政府计划在2026年建成110GW的电池和组件产能,旨在透过进口替代来扶持国内製造商,从而强化本地价值链。儘管部分邦仍面临实施方面的挑战,但标准化的安装方法为住宅用户的更广泛应用提供了借鉴。
高电流SiC/IGBT功率模组持续供不应求和价格波动
碳化硅晶圆供应紧张是高效逆变器发展的阻碍因素,并持续推高元件成本。 Wolfspeed的财务困境加剧了市场风险,但英飞凌持续转向成本效益更高的200mm碳化硅晶圆,预示着2026年后供应紧张的局面有望缓解。与能够转向硅基替代方案的垂直整合型中国製造商相比,严重依赖先进半导体实现併网功能的欧美製造商面临更严峻的利润压缩。
细分市场分析
儘管集中式逆变器在2025年仍将以54.30%的市占率保持其主导地位,但随着组件级电子技术从早期采用者走向主流,微型逆变器预计将以7.96%的复合年增长率成长。 Enphase在2025年出货了超过650万台美国本土微型逆变器,符合美国在地化标准,展现了该领域的商业规模。在太阳能逆变器市场,那些将ASIC设计、无线资料通讯和散热设计整合到紧凑型机壳中的公司正在崛起。虽然由于弃电限制,集中式架构在中国的需求趋于平缓,但在其他地区的电力计划中,尤其是在那些优先考虑电站级控制和具有竞争力的资本投资的地区,集中式架构仍然占据一席之地。
微电子领域的竞争日益激烈,其障碍并非来自硬体成本,而是来自韧体的复杂性和安全认证。因此,低成本参与企业难以跟上快速推出的新功能,例如快速关断和电池介面模式。儘管太阳能逆变器的销售成长强劲,但预计其架构仍将保持多样化,微型逆变器预计在未来十年内都难以超越组串式平台。
到2025年,公用事业电站将占总出货量的62.25%,反映出透过长期购电协议(PPA)落实的一系列大型计划。随着电网服务和净计费方案改善家庭经济状况,住宅係统预计仍将以每年7.45%的速度成长。印度的「总理阳光之家」(Pradhan Mantri Surya Ghar)计画的目标是到2027年3月实现30吉瓦的屋顶光伏阵列装置容量,而澳洲的电池储能扩张计画也在推动安装速度。商业屋顶光电系统将受益于印度的政策,但在其他地区则面临挑战,因为保守的融资条款导致投资回收期较长。
在孤岛运作模式下,产消者越来越重视双向功能和容错能力,逆变器厂商也积极推广电池控制逻辑的整合。这推高了平均售价,弥补了大规模装机量成长放缓的影响,并支撑了整个太阳能逆变器市场的收入成长。同时,电力公司的研发重点转向1500V和2000V平台,并整合类似STATCOM的功能,以满足更严格的併网标准。
太阳能逆变器市场报告按逆变器类型(集中式逆变器、串列型逆变器、微型逆变器、混合/电池逆变器)、相数(单相和三相)、连接类型(併网和离网)、应用(住宅、商业/工业、大型发电厂)和地区(北美、欧洲、亚太、南美、中东和非洲)进行细分。
区域分析
亚太地区预计在2025年占全球出货量的54.40%,主要得益于中国垂直整合的供应链以及印度政策主导的屋顶光伏安装项目。儘管中国新的市场化关税机制可能会减缓新装置量,但由于包含储能係统和高压组串的维修需求,预计出货量将会回升。印度的製造能力预计到2026年将达到110吉瓦,这将加强国内采购体系,并保护当地太阳能逆变器市场免受进口波动的影响。然而,监管执行方面的区域差异限制了即时利益。
到2031年,中东地区将以9.31%的复合年增长率实现最快成长,吉瓦级计划与经济多元化蓝图相契合。严酷的沙漠环境推动了对耐高温设计的需求,为专注于封闭式配电柜解决方案的欧洲原始设备製造商(OEM)提供了市场空间。沙乌地阿拉伯和阿联酋加强电网建设的措施正在提升低压穿越性能和无功功率管理规范,要求供应商的产品符合更严格的公用事业标准。北美和欧洲拥有成熟的安装基础,新增需求主要由替换和维修週期主导。美国《通货膨胀控制法案》的国内含量激励措施正在加速本地生产,德克萨斯州、南卡罗来纳州和亚利桑那州的工厂计划到2026年实现年产量远超30吉瓦。随着德国和西班牙等欧洲市场可再生能源渗透率超过50%,电网建置能力变得越来越重要,即使新建设成长趋于平缓,供应商也能获得更高的平均售价(ASP)。
其他福利:
- Excel格式的市场预测(ME)表
- 3个月的分析师支持
目录
第一章 引言
- 研究假设和市场定义
- 调查范围
第二章调查方法
第三章执行摘要
第四章 市场情势
- 市场概览
- 市场驱动因素
- 快速采用高压1500V串列型逆变器(美国和西班牙的大型计划)
- 印度强製商业建筑安装屋顶太阳能係统将提振对100kW逆变器的需求。
- 2012年至2016年日本上网电价补贴政策(FIT)实施期间安装的逆变器采取了积极的更换週期。
- 先进电网支援功能的整合提高了欧洲的平均售价。
- 澳洲混合太阳能和储能解决方案的成长正在推动对双向逆变器的需求。
- 巴西的在地化激励措施促进了集中式逆变器的国内生产。
- 市场限制
- 高电流SiC/IGBT功率模组持续供不应求和价格波动
- 中国西北地区限电措施加剧,导致集中式逆变器订单减少。
- 美国分散的互联互通规则推高了认证成本。
- 德国对屋顶直流电路的消防安全担忧正在减缓微型逆变器的普及。
- 供应链分析
- 监理展望
- 技术展望
- 波特五力模型
- 供应商的议价能力
- 消费者议价能力
- 新进入者的威胁
- 替代品的威胁
- 竞争对手之间的竞争
第五章 市场规模与成长预测
- 按逆变器类型
- 中央逆变器
- 串列型逆变器
- 微型逆变器
- 混合动力/电池相容型逆变器
- 按阶段
- 单相
- 三相
- 按连线类型
- 电网互联
- 离网
- 透过使用
- 住宅
- 商业和工业
- 公用事业规模
- 按地区
- 北美洲
- 我们
- 加拿大
- 墨西哥
- 欧洲
- 英国
- 德国
- 法国
- 西班牙
- 北欧国家
- 俄罗斯
- 其他欧洲地区
- 亚太地区
- 中国
- 印度
- 日本
- 韩国
- 马来西亚
- 泰国
- 印尼
- 越南
- 澳洲
- 亚太其他地区
- 南美洲
- 巴西
- 阿根廷
- 哥伦比亚
- 其他南美洲
- 中东和非洲
- 阿拉伯聯合大公国
- 沙乌地阿拉伯
- 南非
- 埃及
- 其他中东和非洲地区
- 北美洲
第六章 竞争情势
- 市场集中度
- 策略性倡议(併购、联盟、购电协议)
- 市场占有率分析(主要企业的市场排名和份额)
- 公司简介
- Huawei Technologies Co., Ltd.
- Sungrow Power Supply Co., Ltd.
- SMA Solar Technology AG
- SolarEdge Technologies Inc.
- Enphase Energy Inc.
- FIMER SpA
- Delta Electronics, Inc.
- Growatt New Energy Technology Co., Ltd.
- Ginlong(Solis)Technologies
- TMEIC Corporation
- Mitsubishi Electric Corporation
- Schneider Electric SE
- Siemens AG
- Eaton Corporation plc
- Hitachi Energy Ltd.
- Omron Corporation
- Power Electronics Espana SL
- Chint Power Systems Co., Ltd.
- GoodWe Technologies Co., Ltd.
- GE Vernova
- Canadian Solar Inc.(CSI Solar)
- Toshiba Mitsubishi-Electric Industrial Systems Corp.(TMEIC)
- Kepco KPS(South Korea)
第七章 市场机会与未来展望
The Solar PV Inverters market is expected to grow from USD 14.27 billion in 2025 to USD 15.24 billion in 2026 and is forecast to reach USD 21.16 billion by 2031 at 6.79% CAGR over 2026-2031.
The market's expansion is underpinned by a move from simple DC-to-AC conversion toward smart, grid-forming solutions that safeguard power quality and unlock new revenue streams for owners. Asia-Pacific anchors global demand, yet the Middle East is now the fastest-growing territory as large utility projects intersect with grid-modernization agendas. Robust replacement cycles in Japan, rooftop mandates in India, and higher-voltage designs across the United States and Europe amplify near-term unit volumes, while persistent SiC/IGBT shortages and rising curtailment in China temper the pace of expansion. Despite those headwinds, premium pricing for advanced grid-support functions keeps aggregate revenue upward in the solar PV inverter market .
Global Solar PV Inverters Market Trends and Insights
Rapid adoption of high-voltage 1 500 V string inverters in utility-scale projects (US, Spain)
Utility developers increasingly specify 1,500 V-and pilot 2,000 V-DC architectures to lower balance-of-system costs and boost power density. GE Vernova's 2,000 V platform showcases a 30% output gain that decreases levelized energy costs. This voltage migration renders 1,000 V arrays economically obsolete on new-build sites and spurs retrofit projects, especially where land and grid headroom allow bigger block sizes. Heightened semiconductor demand follows, tightening the supply of SiC devices and elevating the strategic importance of thermal design expertise among leading brands.
Mandatory rooftop-solar mandates in India's commercial buildings boosting <=100 kW inverter demand
India's policy obliges new and existing commercial structures to install rooftop arrays, driving the sustained need for <=100 kW inverters. Record additions of 4 GW in fiscal 2024 signal the scale of the opportunity . Domestic manufacturers benefit from import-substitution targets embedded in the country's 110 GW cell-and-module build-out by 2026, reinforcing the local value chain. While implementation gaps remain across several states, standardized installation practices create a template for broader residential uptake.
Persistent shortages & price volatility of high-current SiC / IGBT power modules
SiC wafer supply tightness continues to constrain high-efficiency inverters and amplify bill-of-material costs. Wolfspeed's financial distress heightens risk perceptions, whereas Infineon's switch to cost-effective 200 mm SiC wafers signals relief from 2026 onward . European and North American producers, dependent on advanced semiconductors for grid-forming functionality, experience sharper margin compression than vertically integrated Chinese peers able to fall back on silicon alternatives.
Other drivers and restraints analyzed in the detailed report include:
- Aggressive replacement cycle of inverters installed during Japan's 2012-2016 FIT boom
- Integration of advanced grid-support functions lifting ASPs in Europe
- Rising curtailment in China's northwest dampening central-inverter orders
For complete list of drivers and restraints, kindly check the Table Of Contents.
Segment Analysis
Central units retained a 54.30% revenue lead in 2025, yet microinverters are forecast to grow at an 7.96% CAGR as module-level electronics move beyond the early-adopter niche. Enphase shipped more than 6.5 million domestic microinverters in 2025, satisfying US localization criteria and underlining the segment's commercial scale . The solar PV inverter market rewards firms that combine ASIC design, wireless data, and thermal engineering in a miniature footprint. Central architectures now confront flattish demand in China due to curtailment but remain anchored in utility projects elsewhere, especially where plant-level controls and competitive capex remain priorities.
Competitive intensity is pronounced in microelectronics; barriers arise from firmware sophistication and safety certifications rather than raw hardware cost. Consequently, low-price entrants struggle to keep pace with rapid feature rollouts such as rapid shutdown and battery interface modes. Despite robust volume growth, microinverters are not likely to eclipse string platforms before the next decade, keeping the solar PV inverter market diversified by architecture.
Utility plants captured 62.25% of 2025 shipments, reflecting large project pipelines locked under long-term PPAs. Even so, residential systems should expand by 7.45% annually as grid services and net-billing frameworks enhance household economics. India's Pradhan Mantri Surya Ghar program targets 30 GW of rooftop arrays by March 2027, while Australia's battery add-on trend lifts attachment rates. Commercial rooftops ride India's rooftop mandate wave but face cautious finance terms in other regions that stretch payback timelines.
Prosumers increasingly value bidirectional capability and island-mode resilience, prompting inverter OEMs to integrate battery control logic. The resulting ASP uplift compensates for slower macro installation growth, supporting aggregate revenue progression inside the solar PV inverter market. Utility developers, meanwhile, focus on 1,500 V and 2,000 V platforms, coupling them with STATCOM-like functionalities to meet stricter grid-code compliance.
The Solar PV Inverter Market Report is Segmented by Inverter Type (Central Inverters, String Inverters, Micro Inverters, and Hybrid/Battery-Ready Inverters), Phase (Single-Phase and Three-Phase), Connection Type (On-Grid and Off-Grid), Application (Residential, Commercial and Industrial, and Utility-Scale), and Geography (North America, Europe, Asia-Pacific, South America, and Middle East and Africa).
Geography Analysis
Asia-Pacific generated 54.40% of 2025 shipments, underpinned by China's vertically integrated supply chain and India's policy-driven rooftop push. While China's new market-based tariff regime may slow greenfield installations, volume resilience stems from retrofits that embed storage and higher-voltage strings. India's manufacturing capacity, set to reach 110 GW by 2026, tightens domestic procurement loops and shields the local solar PV inverter market from import volatility, although regional disparities in regulatory execution temper immediate gains.
The Middle East, clocking the quickest 9.31% CAGR through 2031, aligns gigawatt-scale projects with economic diversification blueprints. Harsh desert conditions drive demand for high-derating-temperature designs, opening niches for European OEMs specializing in sealed cubicle solutions. Grid-reinforcement efforts in Saudi Arabia and the United Arab Emirates elevate low-voltage ride-through and reactive-power management specifications, pressing vendors to certify products against stricter utility benchmarks. North America and Europe operate in a mature install base where replacement and retrofit cycles dominate incremental demand. The US Inflation Reduction Act's domestic content credits accelerate localized production, with Texas, South Carolina, and Arizona facilities targeting annual output well above 30 GW by 2026. Europe's renewable penetration surpassing 50% in markets such as Germany and Spain raises the value of grid-forming features, allowing vendors to pass through higher ASPs even as new-build volumes plateau.
- Huawei Technologies Co., Ltd.
- Sungrow Power Supply Co., Ltd.
- SMA Solar Technology AG
- SolarEdge Technologies Inc.
- Enphase Energy Inc.
- FIMER SpA
- Delta Electronics, Inc.
- Growatt New Energy Technology Co., Ltd.
- Ginlong (Solis) Technologies
- TMEIC Corporation
- Mitsubishi Electric Corporation
- Schneider Electric SE
- Siemens AG
- Eaton Corporation plc
- Hitachi Energy Ltd.
- Omron Corporation
- Power Electronics Espana S.L.
- Chint Power Systems Co., Ltd.
- GoodWe Technologies Co., Ltd.
- GE Vernova
- Canadian Solar Inc. (CSI Solar)
- Toshiba Mitsubishi-Electric Industrial Systems Corp. (TMEIC)
- Kepco KPS (South Korea)
Additional Benefits:
- The market estimate (ME) sheet in Excel format
- 3 months of analyst support
TABLE OF CONTENTS
1 Introduction
- 1.1 Study Assumptions & Market Definition
- 1.2 Scope of the Study
2 Research Methodology
3 Executive Summary
4 Market Landscape
- 4.1 Market Overview
- 4.2 Market Drivers
- 4.2.1 Rapid adoption of high-voltage 1 500 V string inverters in utility-scale projects (US, Spain)
- 4.2.2 Mandatory rooftop-solar mandates in India's commercial buildings boosting ?100 kW inverter demand
- 4.2.3 Aggressive replacement cycle of inverters installed during Japan's 2012-2016 FIT boom
- 4.2.4 Integration of advanced grid-support functions lifting ASPs in Europe
- 4.2.5 Growth of hybrid PV-storage solutions driving bidirectional inverters in Australia
- 4.2.6 Localization incentives in Brazil encouraging domestic manufacture of central inverters
- 4.3 Market Restraints
- 4.3.1 Persistent shortages & price volatility of high-current SiC / IGBT power modules
- 4.3.2 Rising curtailment in China's northwest dampening central-inverter orders
- 4.3.3 Fragmented US interconnection codes inflating certification costs
- 4.3.4 Fire-safety concerns on rooftop DC circuits slowing microinverter uptake in Germany
- 4.4 Supply-Chain Analysis
- 4.5 Regulatory Outlook
- 4.6 Technological Outlook
- 4.7 Porter's Five Forces
- 4.7.1 Bargaining Power of Suppliers
- 4.7.2 Bargaining Power of Consumers
- 4.7.3 Threat of New Entrants
- 4.7.4 Threat of Substitutes
- 4.7.5 Intensity of Competitive Rivalry
5 Market Size & Growth Forecasts
- 5.1 By Inverter Type
- 5.1.1 Central Inverters
- 5.1.2 String Inverters
- 5.1.3 Microinverters
- 5.1.4 Hybrid/Battery-Ready Inverters
- 5.2 By Phase
- 5.2.1 Single-Phase
- 5.2.2 Three-Phase
- 5.3 By Connection Type
- 5.3.1 On-Grid
- 5.3.2 Off-Grid
- 5.4 By Application
- 5.4.1 Residential
- 5.4.2 Commercial and Industrial
- 5.4.3 Utility-Scale
- 5.5 By Geography
- 5.5.1 North America
- 5.5.1.1 United States
- 5.5.1.2 Canada
- 5.5.1.3 Mexico
- 5.5.2 Europe
- 5.5.2.1 United Kingdom
- 5.5.2.2 Germany
- 5.5.2.3 France
- 5.5.2.4 Spain
- 5.5.2.5 Nordic Countries
- 5.5.2.6 Russia
- 5.5.2.7 Rest of Europe
- 5.5.3 Asia-Pacific
- 5.5.3.1 China
- 5.5.3.2 India
- 5.5.3.3 Japan
- 5.5.3.4 South Korea
- 5.5.3.5 Malaysia
- 5.5.3.6 Thailand
- 5.5.3.7 Indonesia
- 5.5.3.8 Vietnam
- 5.5.3.9 Australia
- 5.5.3.10 Rest of Asia-Pacific
- 5.5.4 South America
- 5.5.4.1 Brazil
- 5.5.4.2 Argentina
- 5.5.4.3 Colombia
- 5.5.4.4 Rest of South America
- 5.5.5 Middle East and Africa
- 5.5.5.1 United Arab Emirates
- 5.5.5.2 Saudi Arabia
- 5.5.5.3 South Africa
- 5.5.5.4 Egypt
- 5.5.5.5 Rest of Middle East and Africa
- 5.5.1 North America
6 Competitive Landscape
- 6.1 Market Concentration
- 6.2 Strategic Moves (M&A, Partnerships, PPAs)
- 6.3 Market Share Analysis (Market Rank/Share for key companies)
- 6.4 Company Profiles (includes Global level Overview, Market level overview, Core Segments, Financials as available, Strategic Information, Products & Services, and Recent Developments)
- 6.4.1 Huawei Technologies Co., Ltd.
- 6.4.2 Sungrow Power Supply Co., Ltd.
- 6.4.3 SMA Solar Technology AG
- 6.4.4 SolarEdge Technologies Inc.
- 6.4.5 Enphase Energy Inc.
- 6.4.6 FIMER SpA
- 6.4.7 Delta Electronics, Inc.
- 6.4.8 Growatt New Energy Technology Co., Ltd.
- 6.4.9 Ginlong (Solis) Technologies
- 6.4.10 TMEIC Corporation
- 6.4.11 Mitsubishi Electric Corporation
- 6.4.12 Schneider Electric SE
- 6.4.13 Siemens AG
- 6.4.14 Eaton Corporation plc
- 6.4.15 Hitachi Energy Ltd.
- 6.4.16 Omron Corporation
- 6.4.17 Power Electronics Espana S.L.
- 6.4.18 Chint Power Systems Co., Ltd.
- 6.4.19 GoodWe Technologies Co., Ltd.
- 6.4.20 GE Vernova
- 6.4.21 Canadian Solar Inc. (CSI Solar)
- 6.4.22 Toshiba Mitsubishi-Electric Industrial Systems Corp. (TMEIC)
- 6.4.23 Kepco KPS (South Korea)
7 Market Opportunities & Future Outlook
- 7.1 White-Space & Unmet-Need Assessment
 太阳能逆变器市场:按产品、组件、类型、相数、输出、销售管道和应用划分-2026-2032年全球市场预测太阳能逆变器市场:2026-2032年全球市场预测(依逆变器类型、相数、额定输出、系统类型、输出电压、应用、安装方式及销售管道)太阳能逆变器测试解决方案市场:按应用、逆变器类型、输出额定值和测试类型划分,全球预测(2026-2032年)
 太阳能逆变器市场机会、成长要素、产业趋势分析及2026年至2035年预测。
 2026-2034年全球商用和工业用太阳能逆变器市场规模、份额、趋势和成长分析报告2026-2034年全球独立式太阳能逆变器市场规模、份额、趋势和成长分析报告全球太阳能微型逆变器市场规模、份额、趋势和成长分析报告(2026-2034年)全球太阳能逆变器市场规模、份额、趋势和成长分析报告(2026-2034)
 日本太阳能逆变器市场规模、份额、趋势和预测:按逆变器类型、应用和地区划分,2026-2034年
 2026年全球住宅太阳能逆变器市场报告