


 |
市场调查报告书
商品编码
1940693
二手及翻新智慧型手机:市占率分析、产业趋势及统计、成长预测(2026-2031)Used And Refurbished Smartphone - Market Share Analysis, Industry Trends & Statistics, Growth Forecasts (2026 - 2031) |
||||||
※ 本网页内容可能与最新版本有所差异。详细情况请与我们联繫。
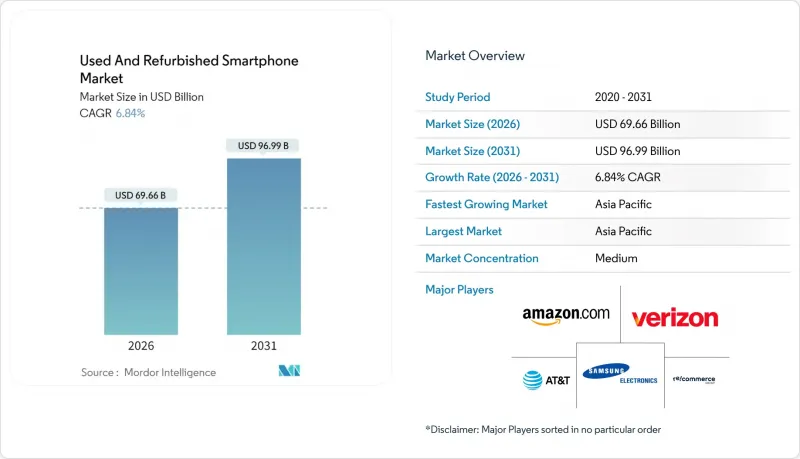
预计二手和翻新智慧型手机市场将从 2025 年的 652 亿美元成长到 2026 年的 696.6 亿美元,到 2031 年将达到 969.9 亿美元,2026 年至 2031 年的复合年增长率为 6.84%。
就出货量而言,市场规模预计将从2025年的3.15亿部成长到2030年的4.3亿部,在预测期内(2025-2030年)的复合年增长率(CAGR)为6.42%。亚太地区的成长动力主要来自高价新机、不断扩大的OEM以旧换新计画以及旨在遏制电子废弃物的监管压力。售价超过1,300美元的旗舰机型促使价格敏感型消费者转向认证二手设备,而5G升级週期也为二手市场带来了稳定的准新机供应。线上市场简化了评级、保固和退货流程,缩小了先前阻碍市场成长的可靠性差距。企业和消费者一样,也开始接受设备再利用,以实现排放目标并降低硬体预算。这些因素共同推动了二手和翻新智慧型手机市场的强劲成长。
全球二手及翻新智慧型手机市场趋势与洞察
智慧型手机价格上涨,缩小了消费者所能负担的价格范围。
像 iPhone 16 Pro Max 这样的旗舰机型售价高达 1,399.99 美元,令许多消费者望而却步。而同款机型的认证二手版本售价则低 30% 至 40%,进一步拉大了价格差距,从而推动了二手和翻新智慧型手机市场的发展。在新兴经济体,进口翻新产品往往是实现 5G 连接的唯一经济可行的途径,这使得更高的价格成为推动结构性成长的催化剂。
OEM认证计画重新定义品质标准
包括苹果和三星在内的原始设备製造商(OEM)透过提供新电池、外观修復和一年保修,提振了消费者信心并规范了设备等级。欧洲投资银行于2024年向Swappie提供的1,700万欧元贷款,也印证了投资人对大规模翻新模式的信心。
消费者对可靠性的担忧仍然存在。
即使有原厂保修,65%的潜在买家仍将电池劣化和防水性能下降列为他们最担心的问题,这阻碍了新进入翻新机市场的企业。因此,宣传活动教育活动和提供延长保固服务对于降低消费者的风险认知仍然至关重要。
细分市场分析
认证二手设备正以7.28%的复合年增长率成长,但普通二手设备仍占主导地位,市占率高达60.85%。由于Phonecheck等自动化诊断解决方案(仅需2分钟即可完成检测),认证二手和翻新智慧型手机的市场规模正在不断扩大。消费者越来越倾向将OEM认证视为与全新品质相同的标准,因此也愿意支付更高的价格。
儘管低端设备的点对点交易仍然是主流,但更严格的进口限制和欧盟的「维修权」政策预计将推动透过专业剪切机进行的交易增加。这种结构性变化正在缩小品质差距,并提高品牌和有保障产品的价值。
到2025年,线上通路将占销售额的38.22%,反映出消费者偏好便利的点击出货服务和透明的退货政策。通讯业者的以旧换新服务将成为库存来源,光是AT&T一家公司在2024年就回收了1,250万台设备。 OEM零售店虽然规模较小,但将成为成长最快的管道,年复合成长率达8.88%,因为品牌可以在保障用户体验的同时,直接实现二手需求的变现。
实体店对那些重视亲眼所见、亲手触摸商品的消费者来说仍然至关重要,尤其是在数位支付普及速度缓慢的新兴市场。融合线上线下购物体验的策略,例如透过自助支付终端提供即时支付选项,正逐渐成为推动这一转变的有效途径。
二手及翻新智慧型手机市场报告按设备状况(二手、翻新/认证二手)、销售管道(线上市场、线下零售商等)、价格区间(100美元以下、100-199美元、200-399美元、200美元以上)、最终用户(消费者/个人、企业/公司、政府/机构)和地区进行分析。市场预测以价值(美元)和销售量(出货量)两种单位呈现。
区域分析
亚太地区将在2025年占据最大的市场份额,达到41.05%,这反映了该地区较高的行动网路普及率和5G的快速部署。日本在2024年二手车销量将达到315万辆,比上年增长15.5%,这主要得益于其零售分销网络的扩张以及对认证二手产品的积极营销。中国主要电商平台正增设二手产品专区,加速二手车市场的普及。
在印度,供不应求导致需求无法满足,预计2025年销售量将下降5%至7%。儘管Cashify累计的收入为95.5亿印度卢比(约1.18亿美元),但这仍凸显了回收网路的重要性。东南亚智慧型手机年增长率高达20%,加上人口结构年轻化和数据消费量不断增长,预计将使该地区在二手和翻新智慧型手机市场占据相当大的份额。
北美地区的通讯业者计画已经相当成熟,但仍有70%的用户持有二手设备,这表明存在潜在的供应来源。企业回收计划和维修权立法可能会推动更多分销管道的拓展。欧洲将受益于2025年6月生效的生态设计指令,该指令通过七年的零件供应义务,降低翻新成本并延长设备使用寿命。
其他福利:
- Excel格式的市场预测(ME)表
- 3个月的分析师支持
目录
第一章 引言
- 研究假设和市场定义
- 调查范围
第二章调查方法
第三章执行摘要
第四章 市场情势
- 市场概览
- 市场驱动因素
- 智慧型手机零售价格上涨推动了次市场需求。
- 拓展线上市场,实现更便利的交易
- 原始设备製造商主导的以旧换新和认证再製造计划
- 永续性法规与消费者环保意识
- 5G将加速设备更换週期,导致二手设备供应增加。
- 一种面向企业的设备租赁模式,可提供高品质的库存。
- 市场限制
- 消费者关注品质和保固问题
- 假零件和灰色经销商日益增加。
- 软体安全锁限制了翻新产品的可行性。
- 加强对电子废弃物进出口的监管
- 价值链分析
- 监管环境
- 技术展望
- 分销通路趋势(OEM 与第三方平台)
- 5G将如何影响二手和翻新智慧型手机
- 波特五力分析
- 供应商的议价能力
- 消费者议价能力
- 新进入者的威胁
- 竞争对手之间的竞争
- 替代品的威胁
- 影响市场的宏观经济因素
第五章 市场规模与成长预测
- 按设备状态
- 用过的
- 翻新/认证二手
- 按销售管道
- 网路市集
- 线下零售商
- 通讯业者/承运商以旧换新计划
- OEM认证翻新店
- 批发/B2B
- 按价格范围
- 100美元以下
- 100-199美元
- 200-399美元
- 400-599美元
- 超过 600 美元
- 最终用户
- 消费者/个人
- 商业/企业
- 政府/机构
- 按地区
- 北美洲
- 我们
- 加拿大
- 墨西哥
- 南美洲
- 巴西
- 阿根廷
- 南美洲其他地区
- 欧洲
- 德国
- 英国
- 法国
- 义大利
- 西班牙
- 俄罗斯
- 其他欧洲地区
- 亚太地区
- 中国
- 印度
- 日本
- 韩国
- 东南亚
- 亚太其他地区
- 中东
- 沙乌地阿拉伯
- 阿拉伯聯合大公国
- 土耳其
- 其他中东地区
- 非洲
- 南非
- 奈及利亚
- 埃及
- 其他非洲地区
- 北美洲
第六章 竞争情势
- 市场集中度
- 策略趋势
- 市占率分析
- 公司简介
- Apple Inc.
- Samsung Electronics Co., Ltd.
- Back Market, Inc.
- Amazon.com, Inc.
- Recommerce Group
- Verizon Communications Inc.
- AT&T Inc.
- Best Buy Co., Inc.
- Alibaba Group Holding Ltd.
- Swappie Oy
- Cashify(Manak Waste Management Private Limited)
- Gazelle(ecoATM, LLC)
- Likewize Corp.(Brightstar Corp.)
- Trocafone, Inc.
- musicMagpie plc(Decluttr)
- FoneGiant Limited
- Reboxed Ltd.
第七章 市场机会与未来展望
The Used And Refurbished Smartphone market is expected to grow from USD 65.20 billion in 2025 to USD 69.66 billion in 2026 and is forecast to reach USD 96.99 billion by 2031 at 6.84% CAGR over 2026-2031.
In terms of shipment volume, the market is expected to grow from 315 million units in 2025 to 430 million units by 2030, at a CAGR of 6.42% during the forecast period (2025-2030). Asia-Pacific region buoyed by high new-device prices, growing OEM trade-in programs, and regulatory pressure to curb e-waste. Flagship devices priced above USD 1,300 push price-sensitive buyers toward certified alternatives, while 5G upgrade cycles recycle a steady flow of near-new handsets into the secondary channel. Online marketplaces have streamlined grading, warranty, and returns, shrinking the trust gap that once limited growth. Enterprises are joining consumers in device reuse to hit emissions goals and trim hardware budgets. Collectively, these forces position the used and refurbished smartphones market for resilient, broad-based expansion.
Global Used And Refurbished Smartphone Market Trends and Insights
Rising Smartphone Prices Narrow the Affordability Window
Flagship devices such as the iPhone 16 Pro Max list at USD 1,399.99, placing premium hardware beyond reach for many buyers . Certified units of the same model sell 30-40% lower, widening the value gap that fuels the used and refurbished smartphones market. In emerging economies, refurbished imports often represent the only financially viable path to 5G connectivity, turning price inflation into a structural growth catalyst.
OEM Certification Programs Reset Quality Expectations
Apple, Samsung, and other OEMs guarantee new batteries, cosmetic refurbishing, and full-year warranties, lifting consumer confidence and standardizing device grades. Financing from the European Investment Bank, EUR 17 million to Swappie in 2024, underscores investor belief in scale refurbishment models .
Consumer Concerns About Reliability Persist
Even with OEM guarantees, 65% of prospective buyers cite battery degradation and waterproofing loss as top worries, dampening adoption in first-time refurb markets . Educational campaigns and extended warranties remain essential to lower perceived risk.
Other drivers and restraints analyzed in the detailed report include:
- 5G Upgrade Waves Boost Supply Quality
- Online Marketplaces Remove Transaction Friction
- Counterfeit Components Undercut Trust
For complete list of drivers and restraints, kindly check the Table Of Contents.
Segment Analysis
Certified pre-owned units are accelerating at a 7.28% CAGR, while standard used phones still dominate volume at 60.85%. The used and refurbished smartphones market size for certified devices is lifted by automated testing solutions such as Phonecheck that complete diagnostics in two minutes. Increasingly, buyers equate OEM certification with near-new quality, enabling premium pricing.
Peer-to-peer resales remain popular for low-value handsets, yet stringent import laws and upcoming EU right-to-repair mandates are expected to push more trade through professional refurbishers. This structural shift narrows the quality gap and pushes value toward branded, warrantied inventory.
Online portals accounted for 38.22% of 2025 turnover, reflecting consumer preference for click-to-door convenience and transparent return policies. Carrier trade-in desks feed inventory pipelines; AT&T alone collected 12.5 million devices in 2024. OEM storefronts, though smaller, are the fastest-growing channel at 8.88% CAGR as brands monetize secondary demand directly while safeguarding user experience.
Physical retailers retain relevance for shoppers who value in-hand inspection, especially in emerging markets where digital payment penetration lags. Blended online-offline strategies, including kiosk-based instant payment options, are gaining traction to ease the transition.
The Used and Refurbished Smartphone Market Report is Segmented by Device Condition (Used, Refurbished/Certified Pre-Owned), Sales Channel (Online Marketplaces, Offline Retailers, and More), Price Band (< USD 100, USD 100-199, USD 200-399, and More), End User (Consumer/Individual, Business/Enterprise, Government/Institutional), and Geography. The Market Forecasts are Provided in Terms of Value (USD) and Volume (Shipments).
Geography Analysis
Asia-Pacific generated the largest share at 41.05% in 2025, reflecting deep mobile penetration and rapid 5G rollouts. Japan logged 3.15 million secondary sales in fiscal year 2024, up 15.5% year on year, aided by wide retail distribution and aggressive marketing of certified stock. China's e-commerce giants have added dedicated refurbished sections, accelerating mainstream acceptance.
India shows unmet demand constrained by supply gaps; unit volumes dipped 5-7% in 2025 despite Cashify posting INR 955 crore (USD 118 million) revenue, underscoring the importance of collection networks. Southeast Asia, with 20% annual smartphone growth, combines young demographics with rising data consumption, positioning the region for outsized share gains within the used and refurbished smartphones market.
North America leverages mature carrier programs, yet 70% of owners still retain retired devices, signaling latent supply. Corporate take-back schemes and right-to-repair laws could unlock additional flow. Europe benefits from the Ecodesign Directive, effective June 2025, which requires spare-parts availability for seven years, lowering refurbishment costs and enhancing device lifetimes.
- Apple Inc.
- Samsung Electronics Co., Ltd.
- Back Market, Inc.
- Amazon.com, Inc.
- Recommerce Group
- Verizon Communications Inc.
- AT&T Inc.
- Best Buy Co., Inc.
- Alibaba Group Holding Ltd.
- Swappie Oy
- Cashify (Manak Waste Management Private Limited)
- Gazelle (ecoATM, LLC)
- Likewize Corp. (Brightstar Corp.)
- Trocafone, Inc.
- musicMagpie plc (Decluttr)
- FoneGiant Limited
- Reboxed Ltd.
Additional Benefits:
- The market estimate (ME) sheet in Excel format
- 3 months of analyst support
TABLE OF CONTENTS
1 INTRODUCTION
- 1.1 Study Assumptions and Market Definition
- 1.2 Scope of the Study
2 RESEARCH METHODOLOGY
3 EXECUTIVE SUMMARY
4 MARKET LANDSCAPE
- 4.1 Market Overview
- 4.2 Market Drivers
- 4.2.1 Rising smartphone retail prices driving secondary-market demand
- 4.2.2 Expansion of online marketplaces enabling convenient transactions
- 4.2.3 OEM-led trade-in and certified refurbishment programs
- 4.2.4 Sustainability regulations and consumer eco-consciousness
- 4.2.5 5G-driven device replacement cycles increasing used-phone supply
- 4.2.6 Enterprise device-leasing models feeding high-grade inventory
- 4.3 Market Restraints
- 4.3.1 Consumer concerns around quality and warranties
- 4.3.2 Proliferation of counterfeit parts and grey-market sellers
- 4.3.3 Software security locks limiting refurb viability
- 4.3.4 Tightening e-waste import/export regulations
- 4.4 Value Chain Analysis
- 4.5 Regulatory Landscape
- 4.6 Technological Outlook
- 4.7 Distribution Channel Landscape (OEMs vs Third-Party Platforms)
- 4.8 Impact of 5G on Used and Refurbished Smartphones
- 4.9 Porter's Five Forces Analysis
- 4.9.1 Bargaining Power of Suppliers
- 4.9.2 Bargaining Power of Consumers
- 4.9.3 Threat of New Entrants
- 4.9.4 Intensity of Competitive Rivalry
- 4.9.5 Threat of Substitutes
- 4.10 Impact of Macroeconomic Factors on the Market
5 MARKET SIZE AND GROWTH FORECASTS (VALUE)
- 5.1 By Device Condition
- 5.1.1 Used
- 5.1.2 Refurbished/Certified Pre-Owned
- 5.2 By Sales Channel
- 5.2.1 Online Marketplaces
- 5.2.2 Offline Retailers
- 5.2.3 Carrier/Operator Trade-In Programs
- 5.2.4 OEM Certified Refurbished Stores
- 5.2.5 Wholesale/B2B
- 5.3 By Price Band
- 5.3.1 < USD 100
- 5.3.2 USD 100-199
- 5.3.3 USD 200-399
- 5.3.4 USD 400-599
- 5.3.5 >= USD 600
- 5.4 By End User
- 5.4.1 Consumer/Individual
- 5.4.2 Business/Enterprise
- 5.4.3 Government/Institutional
- 5.5 By Geography
- 5.5.1 North America
- 5.5.1.1 United States
- 5.5.1.2 Canada
- 5.5.1.3 Mexico
- 5.5.2 South America
- 5.5.2.1 Brazil
- 5.5.2.2 Argentina
- 5.5.2.3 Rest of South America
- 5.5.3 Europe
- 5.5.3.1 Germany
- 5.5.3.2 United Kingdom
- 5.5.3.3 France
- 5.5.3.4 Italy
- 5.5.3.5 Spain
- 5.5.3.6 Russia
- 5.5.3.7 Rest of Europe
- 5.5.4 Asia Pacific
- 5.5.4.1 China
- 5.5.4.2 India
- 5.5.4.3 Japan
- 5.5.4.4 South Korea
- 5.5.4.5 Southeast Asia
- 5.5.4.6 Rest of Asia Pacific
- 5.5.5 Middle East
- 5.5.5.1 Saudi Arabia
- 5.5.5.2 United Arab Emirates
- 5.5.5.3 Turkey
- 5.5.5.4 Rest of Middle East
- 5.5.6 Africa
- 5.5.6.1 South Africa
- 5.5.6.2 Nigeria
- 5.5.6.3 Egypt
- 5.5.6.4 Rest of Africa
- 5.5.1 North America
6 COMPETITIVE LANDSCAPE
- 6.1 Market Concentration
- 6.2 Strategic Moves
- 6.3 Market Share Analysis
- 6.4 Company Profiles (includes Global level Overview, Market level overview, Core Segments, Financials as available, Strategic Information, Market Rank/Share for key companies, Products and Services, and Recent Developments)
- 6.4.1 Apple Inc.
- 6.4.2 Samsung Electronics Co., Ltd.
- 6.4.3 Back Market, Inc.
- 6.4.4 Amazon.com, Inc.
- 6.4.5 Recommerce Group
- 6.4.6 Verizon Communications Inc.
- 6.4.7 AT&T Inc.
- 6.4.8 Best Buy Co., Inc.
- 6.4.9 Alibaba Group Holding Ltd.
- 6.4.10 Swappie Oy
- 6.4.11 Cashify (Manak Waste Management Private Limited)
- 6.4.12 Gazelle (ecoATM, LLC)
- 6.4.13 Likewize Corp. (Brightstar Corp.)
- 6.4.14 Trocafone, Inc.
- 6.4.15 musicMagpie plc (Decluttr)
- 6.4.16 FoneGiant Limited
- 6.4.17 Reboxed Ltd.
7 MARKET OPPORTUNITIES AND FUTURE OUTLOOK
- 7.1 White-Space and Unmet-Need Assessment


