


 |
市场调查报告书
商品编码
1940765
美国整车运输 (FTL):市场占有率分析、产业趋势与统计、成长预测 (2026-2031)United States Full-Truck-Load (FTL) - Market Share Analysis, Industry Trends & Statistics, Growth Forecasts (2026 - 2031) |
||||||
※ 本网页内容可能与最新版本有所差异。详细情况请与我们联繫。
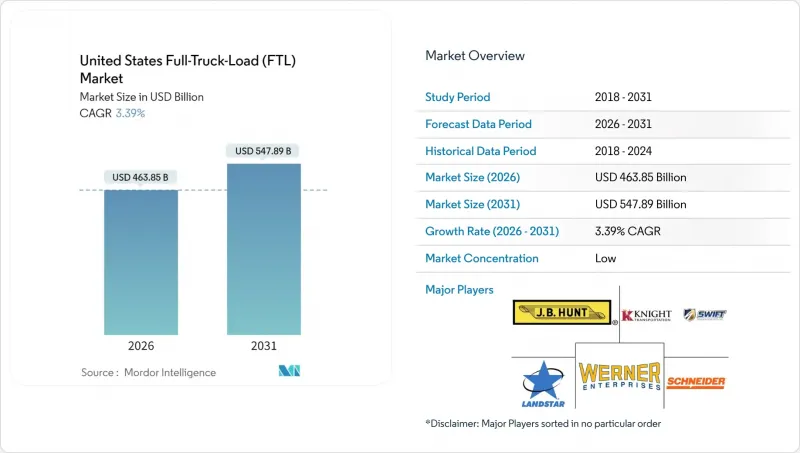
美国整车运输 (FTL) 市场预计将从 2025 年的 4,486.5 亿美元成长到 2026 年的 4,638.5 亿美元,预计到 2031 年将达到 5,478.9 亿美元,2026 年至 2031 年的复合年增长率为 3.39%。
这一增长得益于货运结构日趋稳健,电子商务包裹运输、近岸製造以及专用合约运输的兴起共同塑造了这一结构。儘管面临司机短缺和柴油价格持续波动的问题,承运商仍在不断调整其网络,以适应能够按计划为配送配销中心补货的密集配送走廊。联邦基础设施支出确保了建筑材料的持续供应,而大麻合法化和药物低温运输要求则催生了价格较高的细分市场。在美国整车运输 (FTL) 市场,策略性路线优化、超过 90% 的资产运转率以及技术驱动的调度管理已不再是差异化因素,而是基本要求。
美国整车运输 (FTL) 市场趋势与洞察
电子商务快速扩展到小批量商品领域。
亚马逊快速扩张的履约中心和更广泛的全通路转型,使得上游配销中心与最后一公里转运站之间的整车运输 (FTL) 路线持续运作。可预测的补货计划使承运商能够签订专属路线合同,目前 FreightPower 平台上超过 95% 的货运都采用甩挂运输模式。退货量的成长也催生了对逆向物流的需求,从而促进了均衡的回程传输和更高的周转率。这些因素共同支撑了美国整车运输 (FTL) 市场对自有车队的可靠性预期。
製造业的回归与近岸外包趋势
520亿美元的《晶片与科学法案》加速了美国东南部和西南部半导体製造厂的建设,导致高价值设备和建筑材料持续涌入。墨西哥近岸汽车生产重振了跨境运输路线,如今蒙特雷、拉雷多和亚特兰大之间已开通了多式联运。运输距离缩短但运输频率增加,刺激了对专用拖车的需求,并提升了美国整车运输市场的整体规模。
司机短缺和劳动成本飙升
Schneider公司2024年第三季的独立车队规模年减12%,主要原因是独立承包商的退出,反映出整个产业的创业能力正在萎缩。设备收回率的上升已将信用风险推至2008年的水平,导致货运量转向成本更高的公司自有司机。巨额赔偿判决的风险导致保险费飙升,使大型货运公司每年的营运成本增加1,000万美元。人工智慧驱动的招募和健康管理工具的投资收益高达49%,但劳动力短缺仍持续对美国整车运输(FTL)市场的长途运输能力造成压力。
细分市场分析
预计到2025年,製造业将占美国整车运输(FTL)市场的31.55%,并在2026年至2031年间维持4.03%的复合年增长率,巩固其作为关键产业和运输量成长引擎的地位。半导体製造厂的建设、汽车製造业的回流以及机械设备的升级改造,正在推动中西部和东南部地区运输路线密度的增加。在可预测的原料流入和成品流出的推动下,预计美国製造业相关的整车运输市场在预测期内将成长超过305亿美元。专用平板车和温控设施对于精密零件的运输变得越来越重要,承运商也因此获得了更高的运费。即时可视性和准时交货的可靠性是实现竞争优势的关键,这推动了对人工智慧路线规划和配备感测器的拖车的投资。因此,美国整车运输 (FTL) 行业的资产组合正在向专用车辆转变,这将提高盈利并增强承运商的竞争力。
除製造业外,由于联邦基础设施计划和强劲的住宅需求,建设业的货运量呈上升趋势。批发和零售贸易正在利用交叉转运网路整合电商订单,石油、天然气和矿业的物流业务正在逐步稳定,并呈现重新部署的节奏。季节性农业生产支撑着灵活的运力模式,而新兴的大麻物流正透过运输高利润、监管复杂的货物,进一步实现货运结构的多元化。
其他福利:
- Excel格式的市场预测(ME)表
- 分析师支持(3个月)
目录
第一章 引言
- 研究假设和市场定义
- 调查范围
第二章调查方法
第三章执行摘要
第四章 市场情势
- 市场概览
- 按经济活动分類的GDP分配
- 按经济活动分類的GDP成长
- 经济表现及概况
- 电子商务产业的趋势
- 製造业趋势
- 运输和仓储业GDP
- 物流绩效
- 道路长度
- 出口趋势
- 进口趋势
- 燃油价格趋势
- 卡车运输营运成本
- 卡车运输车队规模(按类型)
- 主要卡车供应商
- 公路货运量趋势
- 公路货运价格趋势
- 透过交通方式分享
- 通货膨胀
- 法律规范
- 价值炼和通路分析
- 市场驱动因素
- 爆炸性成长的电子商务交易正逐渐缩小规模
- 製造业回流日本和迁往邻近地区的趋势
- 基础设施投资和就业法案货运奖励策略
- 专用合约运输的成长
- 大麻供应合法化的趋势
- 扩大低温运输药品供应
- 市场限制
- 驾驶人和劳动成本上升
- 柴油价格波动
- 都市区拥挤收费区
- 缺乏公共电动卡车充电通道
- 市场创新
- 波特五力分析
- 新进入者的威胁
- 买方的议价能力
- 供应商的议价能力
- 替代品的威胁
- 竞争对手之间的竞争
第五章 市场规模与成长预测
- 终端用户产业
- 农业、渔业、林业
- 建设业
- 製造业
- 石油天然气、采矿和采石
- 批发和零售
- 其他的
- 目的地
- 国内的
- 国际的
第六章 竞争情势
- 市场集中度
- 关键策略倡议
- 市占率分析
- 公司简介
- ArcBest
- CH Robinson
- Covenant Logistics Group Inc.
- CR England Inc.
- DHL Group
- Hirschbach Motor Lines Inc.
- JB Hunt Transport, Inc.
- Knight-Swift Transportation Holdings Inc.
- Landstar System Inc.
- Marten Transport Ltd.
- PAM Transport Inc.
- Penske Logistics
- Prime Inc.
- R+L Carriers
- Ryder System, Inc.
- Schneider National Inc.
- TFI International Inc.
- TransAm Truck Lines Inc.
- United Parcel Service of America, Inc.(UPS)
- Werner Enterprises Inc.
第七章 市场机会与未来展望
The United States full-truck-load market is expected to grow from USD 448.65 billion in 2025 to USD 463.85 billion in 2026 and is forecast to reach USD 547.89 billion by 2031 at 3.39% CAGR over 2026-2031.
This growth arises from a resilient freight mix shaped by e-commerce parcelization, near-shore manufacturing, and the escalating use of dedicated contract carriage. Carriers continue adjusting networks to serve dense fulfillment corridors that replenish distribution centers on predictable schedules, even as driver shortages and diesel-price volatility persist. Federal infrastructure spending keeps construction material flows lively, while cannabis legalization and pharmaceutical cold-chain requirements create premium-priced niches. Strategic lane optimization, asset utilization above 90%, and technology-enabled dispatching are now baseline expectations rather than differentiators in the United States Full-Truck-Load market.
United States Full-Truck-Load (FTL) Market Trends and Insights
Explosive E-commerce Parcelization
Amazon's fast-growing fulfillment estate and the wider omnichannel pivot keep full-truck-load lanes busy between upstream distribution centers and last-mile cross-dock sites. Predictable replenishment schedules enable carriers to lock in dedicated routing contracts, with drop-and-hook models now exceeding 95% of FreightPower platform shipments. Higher return volumes also create reverse-logistics demand, supporting balanced backhauls and superior asset turns. These dynamics underpin service reliability expectations that favor asset-based fleets in the United States Full-Truck-Load market.
Manufacturing Reshoring and Near-shore Trends
The USD 52 billion CHIPS and Science Act catalyzes semiconductor plant construction across the Southeast and Southwest, spawning continuous inbound flows of high-value equipment and construction inputs. Near-shore automotive production in Mexico feeds cross-border corridors where intermodal options now link Monterrey, Laredo, and Atlanta. Shorter yet more frequent hauls lift trip counts, stimulate specialized trailer demand, and lift overall volumes in the United States Full-Truck-Load market.
Driver Shortage and Escalating Labor Costs
Owner-operator exits trimmed Schneider's independent fleet by 12% year-over-year in Q3 2024, mirroring an industry-wide contraction in entrepreneurial capacity. Credit stress resembles 2008 levels as equipment repossessions rise, shifting volume to costlier company drivers. Insurance premiums surge amid nuclear verdict exposure, adding USD 10 million to annual overhead at large carriers. AI-based recruiting and wellness tools show a 49% return on investment, yet the labor gap still depresses long-haul capacity in the United States Full-Truck-Load market.
Other drivers and restraints analyzed in the detailed report include:
- Infrastructure Investment and Jobs Act Freight Stimulus
- Growth in Dedicated Contract Carriage
- Diesel-Price Volatility
For complete list of drivers and restraints, kindly check the Table Of Contents.
Segment Analysis
Manufacturing held 31.55% of the United States Full-Truck-Load market share in 2025 and is pacing for a 4.03% CAGR between 2026-2031, cementing its status as both volume anchor and growth engine. Semiconductor plant construction, automotive reshoring, and machinery upgrades widen lane density across the Midwest and Southeast. The United States Full-Truck-Load market size tied to manufacturing is anticipated to add more than USD 30.5 billion over the forecast horizon, supported by predictable raw-material inflows and finished-goods outflows. Dedicated flatbed and temperature-controlled equipment gains prominence for sensitive components, a niche where carriers command premium rates. Competitive differentiation hinges on real-time visibility and just-in-time reliability, prompting investment in AI route-planning and sensor-equipped trailers. The United States Full-Truck-Load industry, therefore, witnesses asset mixtures tilting toward specialized rigs that lift yields and bolster carrier.
Outside manufacturing, construction sustains elevated volume on the back of federal infrastructure projects and robust residential demand. Wholesale & retail trade leverages cross-dock networks for e-commerce order pooling, while oil, gas, and mining lanes stay stable on equipment repositioning rhythms. Agriculture's seasonal output supports flexible capacity models, and emerging cannabis logistics further diversifies load mixes with high-margin, compliance-heavy freight.
The United States Full-Truck-Load (FTL) Market Report is Segmented by End User Industry (Agriculture, Fishing, and Forestry, Construction, Manufacturing, Oil and Gas, Mining and Quarrying, Wholesale and Retail Trade, and Others), and Destination (Domestic and International). The Market Forecasts are Provided in Terms of Value (USD).
List of Companies Covered in this Report:
- ArcBest
- C.H. Robinson
- Covenant Logistics Group Inc.
- CR England Inc.
- DHL Group
- Hirschbach Motor Lines Inc.
- J.B. Hunt Transport, Inc.
- Knight-Swift Transportation Holdings Inc.
- Landstar System Inc.
- Marten Transport Ltd.
- P.A.M. Transport Inc.
- Penske Logistics
- Prime Inc.
- R+L Carriers
- Ryder System, Inc.
- Schneider National Inc.
- TFI International Inc.
- TransAm Truck Lines Inc.
- United Parcel Service of America, Inc. (UPS)
- Werner Enterprises Inc.
Additional Benefits:
- The market estimate (ME) sheet in Excel format
- 3 months of analyst support
TABLE OF CONTENTS
1 Introduction
- 1.1 Study Assumptions and Market Definition
- 1.2 Scope of the Study
2 Research Methodology
3 Executive Summary
4 Market Landscape
- 4.1 Market Overview
- 4.2 GDP Distribution by Economic Activity
- 4.3 GDP Growth by Economic Activity
- 4.4 Economic Performance and Profile
- 4.4.1 Trends in E-Commerce Industry
- 4.4.2 Trends in Manufacturing Industry
- 4.5 Transport and Storage Sector GDP
- 4.6 Logistics Performance
- 4.7 Length of Roads
- 4.8 Export Trends
- 4.9 Import Trends
- 4.10 Fuel Pricing Trends
- 4.11 Trucking Operational Costs
- 4.12 Trucking Fleet Size by Type
- 4.13 Major Truck Suppliers
- 4.14 Road Freight Tonnage Trends
- 4.15 Road Freight Pricing Trends
- 4.16 Modal Share
- 4.17 Inflation
- 4.18 Regulatory Framework
- 4.19 Value Chain and Distribution Channel Analysis
- 4.20 Market Drivers
- 4.20.1 Explosive E-Commerce Parcelization
- 4.20.2 Manufacturing Reshoring and Near-Shore Trends
- 4.20.3 Infrastructure Investment and Jobs Act Freight Stimulus
- 4.20.4 Growth in Dedicated Contract Carriage
- 4.20.5 Cannabis-Supply Legalization Wave
- 4.20.6 Cold-Chain Pharma Expansion
- 4.21 Market Restraints
- 4.21.1 Driver Shortage and Escalating Labor Costs
- 4.21.2 Diesel-Price Volatility
- 4.21.3 Urban Congestion-Pricing Zones
- 4.21.4 Limited Public EV-Truck Charging Corridors
- 4.22 Technology Innovations in the Market
- 4.23 Porter's Five Forces Analysis
- 4.23.1 Threat of New Entrants
- 4.23.2 Bargaining Power of Buyers
- 4.23.3 Bargaining Power of Suppliers
- 4.23.4 Threat of Substitutes
- 4.23.5 Competitive Rivalry
5 Market Size and Growth Forecasts (Value, USD)
- 5.1 End User Industry
- 5.1.1 Agriculture, Fishing, and Forestry
- 5.1.2 Construction
- 5.1.3 Manufacturing
- 5.1.4 Oil and Gas, Mining and Quarrying
- 5.1.5 Wholesale and Retail Trade
- 5.1.6 Others
- 5.2 Destination
- 5.2.1 Domestic
- 5.2.2 International
6 Competitive Landscape
- 6.1 Market Concentration
- 6.2 Key Strategic Moves
- 6.3 Market Share Analysis
- 6.4 Company Profiles (Includes Global Level Overview, Market Level Overview, Core Segments, Financials as Available, Strategic Information, Market Rank/Share for Key Companies, Products and Services, and Recent Developments)
- 6.4.1 ArcBest
- 6.4.2 C.H. Robinson
- 6.4.3 Covenant Logistics Group Inc.
- 6.4.4 CR England Inc.
- 6.4.5 DHL Group
- 6.4.6 Hirschbach Motor Lines Inc.
- 6.4.7 J.B. Hunt Transport, Inc.
- 6.4.8 Knight-Swift Transportation Holdings Inc.
- 6.4.9 Landstar System Inc.
- 6.4.10 Marten Transport Ltd.
- 6.4.11 P.A.M. Transport Inc.
- 6.4.12 Penske Logistics
- 6.4.13 Prime Inc.
- 6.4.14 R+L Carriers
- 6.4.15 Ryder System, Inc.
- 6.4.16 Schneider National Inc.
- 6.4.17 TFI International Inc.
- 6.4.18 TransAm Truck Lines Inc.
- 6.4.19 United Parcel Service of America, Inc. (UPS)
- 6.4.20 Werner Enterprises Inc.
7 Market Opportunities and Future Outlook
- 7.1 White-Space and Unmet-Need Assessment
 2026年全球林业产品卡车运输市场报告
 油气压力变送器市场:依压力类型、测量原理、技术、安装方式、压力范围、接触介质材质、应用、最终用户产业划分,全球预测(2026-2032年)
 交通即服务 (TaaS) 市场分析及至 2035 年预测:按类型、产品、服务、技术、组件、应用、部署模式、最终用户、模式和解决方案划分半导体製造领域水资源回收市场分析及预测(至2035年):依类型、产品类型、服务、技术、组件、应用、製程、最终用户、安装类型及解决方案划分
 2026-2034年全球高空作业车市场规模、份额、趋势及成长分析报告
 全球晶片製造本土化市场:预测(至2034年)-按晶片类型、本土化阶段、製程技术、最终用户和地区分類的分析
 2026-2030年全球整车运输(FTL)市场整车运输 (FTL) 服务市场:2026-2032 年全球预测(按合约类型、服务类型、客户规模、承运商类型、设备类型、应用程式和最终用户产业划分)
 印度整车运输 (FTL):份额分析、产业趋势、统计数据、成长预测 (2026-2031)
 包裹运输市场规模、份额和成长分析(按服务、负载容量、营运类型、最终用途和地区划分)-2026-2033年产业预测