


 |
市场调查报告书
商品编码
1940789
美国智慧电錶:市场份额分析、产业趋势与统计、成长预测(2026-2031 年)United States Smart Meter - Market Share Analysis, Industry Trends & Statistics, Growth Forecasts (2026 - 2031) |
||||||
※ 本网页内容可能与最新版本有所差异。详细情况请与我们联繫。
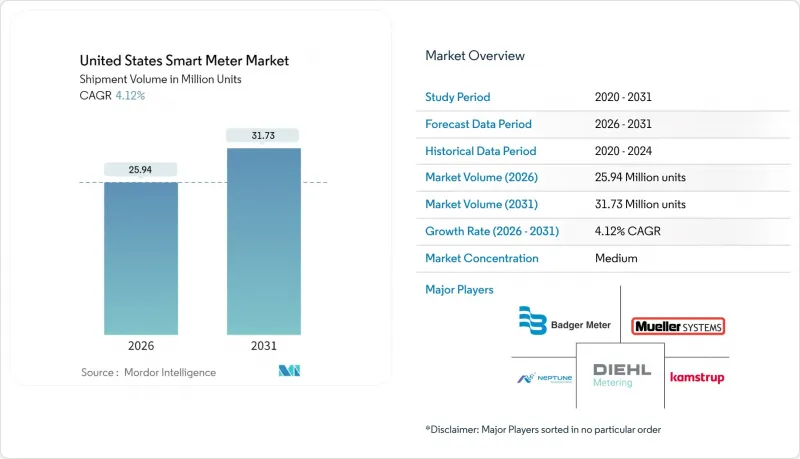
预计到 2026 年,美国智慧电錶市场规模将达到 2,594 万台,高于 2025 年的 2,491 万台。
预计到 2031 年,销量将达到 3,173 万辆,2026 年至 2031 年的复合年增长率为 4.12%。
这一快速成长得益于联邦政府的基础设施投资、各州的可再生能源强制性政策以及公用事业公司逐步淘汰传统模拟设备。儘管硬体仍占资本支出的大部分,但随着资料管理、网路安全监控和进阶分析等服务转向订阅模式,经常性业务收益正在不断增长。投资者所有的公共产业占据了新装机量的大部分,但获得联邦资金直接支持的农村电力合作社正在迅速缩小差距。通讯技术日益多元化,射频网状网路仍是基础技术,而蜂窝网路和窄带物联网(NB-IoT)连接在人口稀少的服务区域正在加速发展。总而言之,这些趋势显示市场正从设备采用阶段过渡到数据驱动的电网调整阶段,客户参与应用预计将在此阶段释放下一波价值创造的浪潮。
美国智慧电錶市场趋势与洞察
消费者意识的提高和联邦法规的强制规定
联邦基础设施法案重新调整了公共产业的投资重点。 《基础设施投资与就业法案》拨款650亿美元用于增强电网韧性,并将智慧电錶定位为基础资产,而非可选项。随着极端天气事件凸显电网的脆弱性,消费者的态度正从怀疑转变为需求。各州委员会越来越多地将高级计量基础设施(AMI)要求纳入定价方案,从而减少了阻碍实施的监管障碍。美国能源部(DOE)的电网韧性与创新伙伴关係计画已拨款109亿美元用于结合智慧电錶和柔软性解决方案的计划。麻萨诸塞州核准在2024年为三家公共产业投入11.7亿美元用于AMI。这种合作消除了资产閒置的风险,并加快了全州的安装进度。
扩大先进计量基础设施资助计划
市场正受益于联邦拨款转向基于公式的拨款方式,这种方式保证了多年的资本投入,从而缓解了受监管公共产业的资产负债表压力。 GRIP津贴现在将网路安全合规性和开放标准互通性纳入评估标准,促使拥有强化架构的供应商获得津贴。农村电力合作社正在崛起成为关键参与者,它们透过在联合采购小组中聚合需求,获得电錶和蜂窝模组的批量折扣。加州自发电激励计画等州级拨款进一步放大了联邦资金的影响,而国内采购规则则引导资金流向像Badger Meter这样在美国设有工厂的製造商。可预测的资金来源促进了大规模、循序渐进的采用,加速了网路效应和资料货币化的潜力。
AMI网路中的网路安全与隐私问题
短期内阻碍技术普及的最大因素是对供应链完整性的日益重视。 NIST网路安全架构2.0将供应商管治从简单的清单式审核提升为董事会层面的治理议题。公共产业在下订单前会委託第三方进行渗透测试,这导致采购週期延长数月。各州委员会现在要求AMI应用必须包含正式的网路风险缓解计划,而NARUC指南则专门针对加密、金钥管理和事件回应程序。虽然公共产业不会完全停止采用这项技术,但新增的管制措施会减缓其普及速度,并增加非硬体成本。
细分市场分析
截至2025年,智慧电錶在美国智慧电錶市场占据68.02%的份额,这得益于监管要求、成本回收保证以及停电管理和远端连接/断开功能带来的显着投资回报率(ROI)。该领域成熟的供应商生态系统使公共产业能够协商优惠价格,从而支持农村地区的大规模竞标。预计到2031年,美国智慧电錶市场规模将达到2,166万台,并随着电网边缘自动化升级而持续成长。
随着市政当局面临日益严重的漏水罚款以及为应对干旱而设定的节水目标,水錶行业的成长正在加速。虽然单位成本高于电錶,但不断上涨的水价正在提高投资报酬率。为了避免地下井道中的讯号流失,水錶通常采用蜂巢模组,并利用云分析来识别未货币化的水量。因此,预计2026年至2031年间,水务业将新增114万个节点,部分缩小与电錶的差距。由于安全标准和复杂的安装规章延长了计划週期,燃气表和热量表在绝对数量和相对数量上都落后于电錶。然而,低功耗广域网路(LPWAN)技术的进步以及防爆外壳的广泛应用,可能会在2020年代后半期推动农村燃气网路部署量的活性化。
到2025年,住宅用户将占智慧电錶安装总量的71.74%,这反映了公共产业推行的综合性项目,这些项目整合了电錶部署、客户入口网站和需量反应註册等功能。标准化的上门安装流程降低了单位人事费用,巩固了住宅用户在美国智慧电錶市场的主导地位。即使其他终端用户的采用速度加快,到2031年,住宅用户在美国智慧电錶市场的份额也不太可能低于70%。
安装在变压器、电容器组和配电线路上的公共产业自有运转电錶是成长最快的细分市场,年复合成长率达 4.78%。这些设备能够提供负载曲线、电压偏差和相位不平衡等资讯。公共产业正将这些设备与分散式能源 (DER) 容量研究相结合,以延缓资本设备升级。商业和工业领域的应用虽然较为活跃,但规模仍然有限,许多大型设施已经部署了楼宇管理系统来取代公用事业公司提供的电錶。然而,碳排放揭露标准的推动正促使企业收集公用事业层面的数据,用于审核追踪和范围 2 报告。
其他福利:
- Excel格式的市场预测(ME)表
- 分析师支持(3个月)
目录
第一章 引言
- 研究假设和市场定义
- 调查范围
第二章调查方法
第三章执行摘要
第四章 市场情势
- 市场概览
- 市场驱动因素
- 消费者意识的提高和联邦法规的强制规定
- 扩大高级计量基础设施(AMI)资助计划
- 公共产业脱碳和电气化蓝图
- 分时电价的引入将推动对即时计量技术的需求。
- 利用 5G 和 NB-IoT 部署提升电錶连接性
- 将分散式能源资源整合到V2G生态系统中(报告不足)
- 市场限制
- AMI网路中的网路安全与隐私问题
- 半导体元件供应链中断(未充分通报)
- 智慧燃气表成本效益实现延迟
- 各公共产业数据标准化方面的差距(漏报)
- 产业生态系分析
- 监管环境
- 智慧电网概念分析
- 宏观经济因素的影响
- 技术展望
- 波特五力分析
- 供应商的议价能力
- 消费者议价能力
- 新进入者的威胁
- 竞争对手之间的竞争
- 替代品的威胁
第五章 市场规模及成长预测(出货量)
- 按类型
- 智慧电錶
- 智慧燃气表
- 智慧水錶
- 智能热量表
- 最终用户
- 住宅
- 商业的
- 工业的
- 公共产业
- 透过通讯技术
- 射频网状网络
- 电力线路通讯(PLC)
- 蜂窝通讯(3G/4G/5G、NB-IoT)
- 其他通讯技术(Wi-SUN、ZigBee、LoRa)
- 按组件
- 硬体(仪表、通讯模组)
- 软体(主资料管理、分析)
- 服务(实施支援、託管服务)
第六章 竞争情势
- 市场集中度
- 策略趋势
- 市占率分析
- 供应商市占率分析
- 公司简介
- Badger Meter Inc.
- Mueller Water Products Inc.(Mueller Systems LLC)
- Diehl Metering LLC
- Kamstrup A/S
- Neptune Technology Group Inc.
- General Electric Company
- Itron Inc.
- Sensus USA Inc.(Xylem Inc.)
- Elster American Meter LLC(Honeywell International Inc.)
- Landis+Gyr AG
- Aclara Technologies LLC
- Schneider Electric SE
- Siemens AG
- Silver Spring Networks Inc.(Itron)
- Zenner USA
- EDMI Limited
- Oracle Corporation
- Trilliant Holdings Inc.
- Sense Labs Inc.
- Ossiaco Inc.
第七章 市场机会与未来展望
The United States smart meter market size in 2026 is estimated at 25.94 million units, growing from 2025 value of 24.91 million units with 2031 projections showing 31.73 million units, growing at 4.12% CAGR over 2026-2031.
The surge is being underpinned by federal infrastructure spending, state-level renewable mandates, and a utility pivot away from legacy analog equipment. Hardware still captures most capital outlay, yet recurring service revenues are rising as data management, cyber-security monitoring, and advanced analytics shift to subscription models. Investor-owned utilities account for the bulk of new installations, but rural electric cooperatives are rapidly closing the gap after gaining direct access to federal funds. Communication technologies are diversifying-RF mesh remains the anchor, although cellular and NB-IoT connections are accelerating in sparsely populated service territories. Collectively, these threads indicate a market in transition from device deployment to data-driven grid orchestration, with customer engagement applications poised to unlock the next wave of value creation.
United States Smart Meter Market Trends and Insights
Higher Consumer Awareness and Federal Mandates
Federal infrastructure legislation has re-ordered utility investment priorities. The Infrastructure Investment and Jobs Act allocates USD 65 billion for grid resilience, positioning smart meters as foundational assets rather than optional upgrades. Consumer attitudes have flipped from skepticism to demand as extreme weather events spotlight grid fragility. State commissions increasingly embed Advanced Metering Infrastructure (AMI) requirements into rate cases, cutting the red tape that previously delayed rollouts. The DOE Grid Resilience and Innovation Partnerships program reserves USD 10.9 billion for projects that pair smart meters with flexibility solutions, while Massachusetts approved USD 1.17 billion of AMI spend across three utilities in 2024. This alignment eliminates stranded-asset risk and fast-tracks statewide installation schedules.
Expansion of Advanced Metering Infrastructure Funding Programs
The market is benefiting from a shift toward formula-based federal allocations that guarantee multi-year capital availability, easing balance-sheet pressure for regulated utilities. GRIP grants now rank cyber-security compliance and open-standards interoperability as scoring criteria, tilting awards toward vendors with hardened architectures. Rural electric cooperatives are new power players, pooling demand under joint procurement groups to draw bulk discounts for meters and cellular modules. State match-funding-such as California's Self-Generation Incentive Program-further leverages federal dollars, while domestic-content rules channel spending to manufacturers like Badger Meter that operate U.S. plants. The predictable funding pipeline encourages larger, contiguous deployment blocks, accelerating network effects and data monetization potential.
Cyber-Security and Privacy Concerns in AMI Networks
The biggest near-term drag on rollouts is the heightened focus on supply-chain integrity. NIST Cyber-Security Framework 2.0 elevates vendor vetting from a checklist to a board-level governance issue. Utilities are commissioning third-party penetration tests before signing purchase orders, adding months to procurement cycles. State commissions now require formal cyber-risk mitigation plans in AMI filings; NARUC guidance specifically calls out encryption, key management, and incident-response playbooks. Utilities will not completely halt deployments, but the added controls slow volume ramps and raise non-hardware costs.
Other drivers and restraints analyzed in the detailed report include:
- Utility Decarbonization and Electrification Roadmaps
- Rise of Time-of-Use Tariffs Driving Real-Time Metering Needs
- Supply-Chain Disruptions for Semiconductor Components
For complete list of drivers and restraints, kindly check the Table Of Contents.
Segment Analysis
Smart electricity meters retained a 68.02% share of the United States smart meter market in 2025. They rode on regulatory mandates, cost-recovery guarantees, and field-proven ROI from outage management and remote connect or disconnect functions. The segment's entrenched vendor ecosystem allows utilities to negotiate favorable pricing, which, in turn, supports large-block tenders in rural territories. The United States smart meter market size for electricity deployments is expected to reach 21.66 million units by 2031, expanding in lockstep with grid-edge automation upgrades.
Growth in water metering is accelerating because municipalities face mounting leakage fines and drought-related conservation goals. Although unit prices are higher than for electric meters, rising water tariffs improve the payback calculus. Cellular modules are frequently specified to avoid RF signal loss inside subterranean vaults, and cloud analytics pinpoint non-revenue water. Consequently, the water segment is projected to add 1.14 million new nodes between 2026 and 2031, closing part of the volume gap with electricity meters. Gas and heat meters trail in both absolute and relative terms because safety codes and complex installation rules extend project timelines. Still, advances in LPWAN and explosion-proof enclosures could invigorate rural gas deployments in the latter half of the decade.
The residential segment accounted for 71.74% of installations in 2025, reflecting wrap-around utility programs that combine meter rollout, customer portals, and demand response enrollment. Because installation crews can move house-to-house with standardized processes, per-unit labor costs are low, reinforcing the segment's leadership in the United States smart meter market. The United States smart meter market share for residential users is unlikely to drop below 70% before 2031, even as other end-users accelerate deployments.
Utility-owned operational meters-installed on transformers, capacitor banks, and distribution feeders-represent the fastest-growing slice, advancing at a 4.78% CAGR. These devices deliver visibility into loading profiles, voltage deviations, and phase imbalances. Utilities deploy them in tandem with DER hosting-capacity studies to defer capital upgrades. Commercial and industrial adoption remains healthy but not spectacular; many large facilities already sport building-management systems that substitute for utility-supplied meters. Still, the push toward carbon disclosure standards is nudging corporations toward utility-grade data for audit trails and Scope 2 reporting.
The United States Smart Meter Market Report is Segmented by Type (Smart Electricity Meters, Smart Gas Meters, Smart Water Meters, and Smart Heat Meters), End-User (Residential, Commercial, Industrial, and Utilities), Communication Technology (RF Mesh, Power Line Communication [PLC}, Cellular, and More), Component (Hardware, Software, and Services), and Geography. The Market Forecasts are Provided in Terms of Volume (Units).
List of Companies Covered in this Report:
- Badger Meter Inc.
- Mueller Water Products Inc. (Mueller Systems LLC)
- Diehl Metering LLC
- Kamstrup A/S
- Neptune Technology Group Inc.
- General Electric Company
- Itron Inc.
- Sensus USA Inc. (Xylem Inc.)
- Elster American Meter LLC (Honeywell International Inc.)
- Landis+Gyr AG
- Aclara Technologies LLC
- Schneider Electric SE
- Siemens AG
- Silver Spring Networks Inc. (Itron)
- Zenner USA
- EDMI Limited
- Oracle Corporation
- Trilliant Holdings Inc.
- Sense Labs Inc.
- Ossiaco Inc.
Additional Benefits:
- The market estimate (ME) sheet in Excel format
- 3 months of analyst support
TABLE OF CONTENTS
1 INTRODUCTION
- 1.1 Study Assumptions and Market Definition
- 1.2 Scope of the Study
2 RESEARCH METHODOLOGY
3 EXECUTIVE SUMMARY
4 MARKET LANDSCAPE
- 4.1 Market Overview
- 4.2 Market Drivers
- 4.2.1 Higher consumer awareness and federal mandates
- 4.2.2 Expansion of Advanced Metering Infrastructure funding programs
- 4.2.3 Utility decarbonization and electrification roadmaps
- 4.2.4 Rise of Time-of-Use tariffs driving real-time metering needs
- 4.2.5 5G and NB-IoT rollout improving meter connectivity
- 4.2.6 Integration of distributed energy resources and V2G ecosystems (under-reported)
- 4.3 Market Restraints
- 4.3.1 Cyber-security and privacy concerns in AMI networks
- 4.3.2 Supply-chain disruptions for semiconductor components (under-reported)
- 4.3.3 Slower smart gas meter cost-benefit realization
- 4.3.4 Inter-utility data standardization gaps (under-reported)
- 4.4 Industry Ecosystem Analysis
- 4.5 Regulatory Landscape
- 4.6 Smart Grid Initiatives Analysis
- 4.7 Impact of Macroeconomic Factors
- 4.8 Technological Outlook
- 4.9 Porter's Five Forces Analysis
- 4.9.1 Bargaining Power of Suppliers
- 4.9.2 Bargaining Power of Consumers
- 4.9.3 Threat of New Entrants
- 4.9.4 Intensity of Competitive Rivalry
- 4.9.5 Threat of Substitutes
5 MARKET SIZE AND GROWTH FORECASTS (SHIPMENT VOLUME)
- 5.1 By Type
- 5.1.1 Smart Electricity Meters
- 5.1.2 Smart Gas Meters
- 5.1.3 Smart Water Meters
- 5.1.4 Smart Heat Meters
- 5.2 By End-User
- 5.2.1 Residential
- 5.2.2 Commercial
- 5.2.3 Industrial
- 5.2.4 Utilities
- 5.3 By Communication Technology
- 5.3.1 RF Mesh
- 5.3.2 Power Line Communication (PLC)
- 5.3.3 Cellular (3G/4G/5G, NB-IoT)
- 5.3.4 Other Communication Technologies (Wi-SUN, ZigBee, LoRa)
- 5.4 By Component
- 5.4.1 Hardware (Meters, Communication Modules)
- 5.4.2 Software (MDM, Analytics)
- 5.4.3 Services (Deployment, Managed Services)
6 COMPETITIVE LANDSCAPE
- 6.1 Market Concentration
- 6.2 Strategic Moves
- 6.3 Market Share Analysis
- 6.4 Vendor Market Share Analysis
- 6.5 Company Profiles (includes Global level Overview, Market level overview, Core Segments, Financials as available, Strategic Information, Market Rank/Share for key companies, Products and Services, and Recent Developments)
- 6.5.1 Badger Meter Inc.
- 6.5.2 Mueller Water Products Inc. (Mueller Systems LLC)
- 6.5.3 Diehl Metering LLC
- 6.5.4 Kamstrup A/S
- 6.5.5 Neptune Technology Group Inc.
- 6.5.6 General Electric Company
- 6.5.7 Itron Inc.
- 6.5.8 Sensus USA Inc. (Xylem Inc.)
- 6.5.9 Elster American Meter LLC (Honeywell International Inc.)
- 6.5.10 Landis+Gyr AG
- 6.5.11 Aclara Technologies LLC
- 6.5.12 Schneider Electric SE
- 6.5.13 Siemens AG
- 6.5.14 Silver Spring Networks Inc. (Itron)
- 6.5.15 Zenner USA
- 6.5.16 EDMI Limited
- 6.5.17 Oracle Corporation
- 6.5.18 Trilliant Holdings Inc.
- 6.5.19 Sense Labs Inc.
- 6.5.20 Ossiaco Inc.
7 MARKET OPPORTUNITIES AND FUTURE OUTLOOK
- 7.1 White-space and Unmet-Need Assessment
 物联网市场追踪:衡量
 2026年全球智慧电錶市场报告
 多功能智慧电錶市场(按最终用户、应用、通讯技术、相型、部署模式和安装类型划分),全球预测,2026-2032年
 欧洲智慧电錶:市场占有率分析、产业趋势与统计、成长预测(2026-2031 年)
 全球电网现代化投资市场:预测(至2034年)-按输电基础设施、组件、资金来源、电网类型、技术、应用、最终用户和地区进行分析
 智慧电錶市场规模、份额、趋势及预测(依产品、技术、应用及地区划分),2026-2034年
 智慧电錶市场-全球产业规模、份额、趋势、机会及预测(依技术、类型、应用、地区及竞争格局划分,2021-2031年)
 智慧电錶市场规模、份额和趋势分析报告:按组件、类型、技术、最终用途、地区和细分市场预测(2026-2033 年)日本智慧电錶市场报告:按产品、技术、应用和地区划分(2026-2034年)
 智慧燃气计量系统市场规模、份额及成长分析(按技术、类型、组件和地区划分)-2026-2033年产业预测