


 |
市场调查报告书
商品编码
1940797
美国IT服务:市场占有率分析、产业趋势与统计、成长预测(2026-2031年)United States (US) IT Services - Market Share Analysis, Industry Trends & Statistics, Growth Forecasts (2026 - 2031) |
||||||
※ 本网页内容可能与最新版本有所差异。详细情况请与我们联繫。
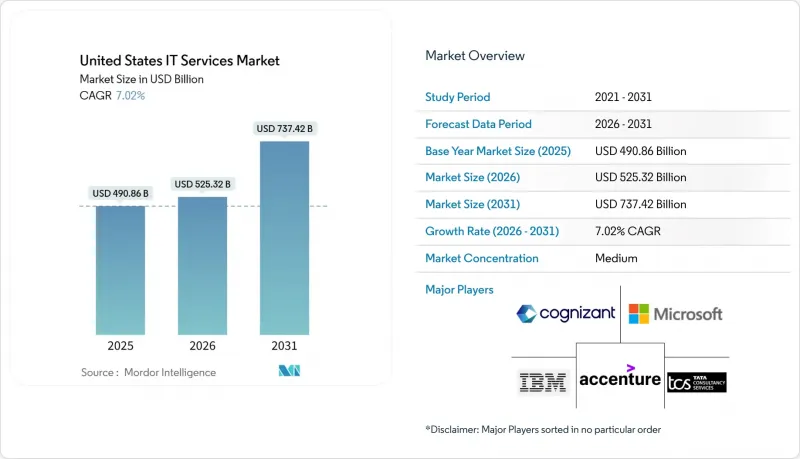
据估计,美国 IT 服务市场在 2026 年的价值将达到 5,253.2 亿美元,高于 2025 年的 4,908.6 亿美元,预计到 2031 年将达到 7,374.2 亿美元。
预计 2026 年至 2031 年的复合年增长率为 7.02%。
生成式人工智慧已成为企业技术预算的首要驱动力,联邦政府为安全云端迁移、5G边缘部署和零信任架构提供的奖励进一步推动了这一趋势。美国IT服务市场也受益于强劲的企业现金流以及公共和私营机构向基于消费的营运模式的快速转型。竞争依然激烈,随着全球系统整合商不断收购专业利基公司以获取人才和专有人工智慧平台,供应商整合正在加剧。区域趋势也使情况更加复杂:虽然西部地区主导,但南部地区的扩张速度最快,新的资料中心走廊正在涌现,以满足不断增长的人工智慧工作负载需求。
美国IT服务市场趋势与洞察
联邦奖励加速了美国公共部门的云端迁移。
联邦机构宣布在2024财年上半年签订价值130亿美元的新IT服务合同,而2025财年民事机构预算为技术领域拨款751.3亿美元,其中16.4%用于网路安全。一项两党共同提出的提案呼吁为人工智慧倡议追加320亿美元,这将为获得FedRAMP授权的云端和安全供应商拓展更多机会。 14028号行政命令作为合规基础,强制所有机构采用安全云端技术。总部位于华盛顿特区、维吉尼亚和马里兰州的服务合作伙伴已开始扩大其交付中心,以抓住快速成长的公共部门业务。
财富 1000 强企业大规模部署生成式人工智慧
到2025年中期,预计近半数财富1000强企业将把生成式人工智慧融入其核心业务流程,随着执行长将企业级部署列为优先事项,这一比例预计将呈指数级增长。预计到2025年,年度人工智慧预算平均将成长14%,支出将主要集中在资料工程基础、管治模型和负责任的人工智慧管理方面。因此,美国IT服务市场对云端平台重构、LLM调优和模型维运管理服务的需求创下历史新高,尤其是在东北走廊的金融中心和西海岸的创新丛集。
高级云端安全人才短缺
美国雇主普遍反映云端架构师和高阶安全工程师长期短缺,人才缺口限制了计划能力,并推高了薪资水平。在西雅图、奥斯汀和北维吉尼亚等科技丛集,这种压力尤其突出,因为超大规模资料中心业者和顾问公司都在争夺同一批高端人才。实施零信任框架的政府机构发现,其薪资水准难以与私部门匹敌,因此开始使用人员外包公司,这些公司将国内领导力与近岸交付能力结合。目前,一些服务供应商正在部署基于人工智慧的招募工具,以加快候选人筛检并缩小职缺。
细分市场分析
到2025年,託管服务将占美国IT服务市场27.85%的份额,主要得益于企业将营运职能外包,并将稀缺人才集中于差异化创新。混合基础设施日益复杂以及持续存在的网路威胁,推动了对完全託管的可观测性、修补程式和合规性服务的需求。服务提供者将捆绑式託管服务定位为增值转型计划的垫脚石,从而确保持续的收入来源和客户留存。
云端和平台服务是美国IT服务市场的成长引擎,预计2026年至2031年将以9.02%的复合年增长率成长。客户正在加速在公共云端基础架构上直接进行大规模生成式人工智慧试点项目,而计量收费的经济模式正在推动工作负载从私人资料中心迁移。服务合作伙伴正在扩展其认证云端团队和财务营运(FinOps)能力,以更好地管理支出。随着传统环境向微服务和无伺服器架构转型,应用开发和维护服务持续保持显着的交易量。同时,在监管审查力度加大以及董事会对现代化蓝图的重视下,网路安全和数位转型咨询服务也保持着强劲的交易动能。
截至2025年,美国IT服务市场中,本土交付将占62.65%,反映出客户对合规性、时区一致性和领域知识的偏好。美国本土的计费标准为每小时115美元至175美元,高技能顾问的薪酬较高,尤其是受监管产业。服务提供者透过将高价值的架构和管治工作集中在大都会圈,并将执行工作分散到成本较低的美国城市,来维持利润率。
预计到2031年,近岸交付将以10.05%的复合年增长率成长,以满足日益增长的对西班牙语和葡萄牙语敏捷团队的需求,这些团队能够连接美国业务团队和拉丁美洲的工程人才。采用「近岸+」模式的公司将解决方案架构师设在美国,并将开发业务扩展到墨西哥、哥伦比亚和哥斯大黎加,时薪稳定在85美元左右。虽然离岸交付仍然保持着成本优势,但班加罗尔和马尼拉等传统离岸外包地点的工资上涨正在推动一些敏感工作选择性地回流到美国。
美国IT服务市场按类型(IT咨询/实施、应用开发与维护等)、部署模式(境内交付、近岸交付等)、合约类型(企划为基础/固定价格等)、组织规模(大型企业、中小企业)、最终用户(银行、金融服务和保险、製造业、政府等)以及地区进行细分。市场预测以美元计价。
其他福利:
- Excel格式的市场预测(ME)表
- 3个月的分析师支持
目录
第一章 引言
- 研究假设和市场定义
- 调查范围
第二章调查方法
第三章执行摘要
第四章 市场情势
- 市场概览
- 市场驱动因素
- 联邦奖励加速了美国公共部门的云端迁移。
- 财富 1000 强企业大规模部署生成式人工智慧
- 5G和边缘部署推动了对网路融合的需求
- 零信任网路安全要求驱动保全服务
- 医疗保健互通性规则促进电子健康记录 (EHR) 整合服务
- 私募股权投资助力中型企业ERP现代化浪潮
- 市场限制
- 高级云端安全人才短缺
- 基于绩效的定价模式所带来的利润率压力
- CCPA/CPRA诉讼中合规的复杂性
- 离岸工资上涨会削弱成本优势。
- 价值/供应链分析
- 监理展望
- 技术展望
- 波特五力模型
- 供应商的议价能力
- 买方的议价能力
- 新进入者的威胁
- 竞争程度
- 替代品的威胁
- 比较分析:一级供应商与二级供应商
- 内部开发与外包分析
- 投资分析
第五章 市场规模与成长预测
- 按服务类型
- IT咨询与实施支持
- 应用开发与维护(ADM)
- 基础设施服务
- 託管服务
- IT外包(ITO)
- 业务流程外包(BPO)
- 云端和平台服务
- 保全服务
- 数位转型与新兴技术(人工智慧、物联网、区块链)
- 按部署模式
- 陆上交付
- 近岸交付
- 离岸交付
- 按合约模式
- 企划为基础/固定价格
- 人员增补/工时及材料法
- 管理式服务/结果导向型
- 按组织规模
- 大公司
- 中小企业
- 按最终用户行业划分
- 银行、金融服务和保险(BFSI)
- 製造业
- 政府/公共部门
- 医学与生命科学
- 零售和消费品
- 通讯与媒体
- 运输/物流
- 能源与公共产业
- 其他的
- 按地区
- 东北
- 中西部
- 南部
- 西
第六章 竞争情势
- 市场集中度
- 策略趋势
- 市占率分析
- 公司简介
- Accenture plc
- IBM Corporation
- Cognizant Technology Solutions Corp.
- Tata Consultancy Services Ltd.
- Microsoft Corporation
- Infosys Ltd.
- Wipro Ltd.
- Deloitte Consulting LLP
- Capgemini SE
- HCL Technologies Ltd.
- CGI Inc.
- DXC Technology Co.
- Booz Allen Hamilton Inc.
- Leidos Holdings Inc.
- Atos SE
- EPAM Systems Inc.
- NTT DATA Services
- Kyndryl Holdings Inc.
- LTI Mindtree Ltd.
- Tech Mahindra Ltd.
- Slalom LLC
- Perficient Inc.
- ThoughtWorks Inc.
- Persistent Systems Ltd.
第七章 市场机会与未来展望
United States IT Services Market size in 2026 is estimated at USD 525.32 billion, growing from 2025 value of USD 490.86 billion with 2031 projections showing USD 737.42 billion, growing at 7.02% CAGR over 2026-2031.
Generative AI ranks as the single largest driver of enterprise technology budgets, while federal incentives for secure cloud migration, 5G-edge roll-outs, and zero-trust mandates supply additional tailwinds. The United States IT services market also benefits from resilient corporate cash flows and the rapid shift of both public and private organizations toward consumption-based operating models. Competition remains intense, yet vendor consolidation continues as global systems integrators acquire niche specialists to secure talent and proprietary AI platforms. Regional dynamics add another layer of complexity: the West retains leadership, but the South is scaling fastest as new data-center corridors emerge to meet surging AI workload demand.
United States (US) IT Services Market Trends and Insights
Federal Incentives Accelerating Cloud Migration in US Public Sector
Federal agencies announced USD 13 billion in new IT services contracts during H1 2024, and the civilian-agency budget for 2025 allocates USD 75.13 billion toward technology, 16.4% of which is earmarked for cybersecurity. A bipartisan proposal seeks an additional USD 32 billion for AI initiatives, widening opportunities for providers with FedRAMP-authorized cloud and security practices.Executive Order 14028 acts as the compliance backbone, mandating secure cloud adoption across agencies. Service partners positioned around Washington, DC, Virginia, and Maryland have begun expanding delivery centers to capture the rapidly growing public-sector pipeline.
Large-Scale Adoption of Generative AI among Fortune 1000
By mid-2025, nearly half of Fortune 1000 enterprises had embedded generative AI into core workflows, and the share is projected to climb sharply as CEOs prioritize enterprise-wide rollouts. Average annual AI budgets are set to rise 14% in 2025, concentrating spend on data-engineering foundations, governance models, and responsible AI controls.The United States IT services market is therefore witnessing record demand for cloud re-platforming, LLM tuning, and model-ops managed services, especially in financial centers along the Northeast corridor and innovation clusters on the West Coast.
Scarcity of Senior Cloud & Security Talent
Employers across the United States report persistent shortages of cloud architects and senior security engineers, a gap that limits project throughput and increases wage inflation. The pressure is fiercest in technology clusters such as Seattle, Austin, and Northern Virginia, where hyperscalers and consultancies compete for the same high-end talent pools. Agencies implementing zero-trust frameworks struggle to match private-sector compensation, encouraging heavier use of staff-augmentation firms that combine domestic leadership with nearshore delivery capacity. Several service providers now deploy AI-based sourcing tools to accelerate candidate screening and reduce vacancy gaps.
Other drivers and restraints analyzed in the detailed report include:
- 5G & Edge Roll-out Driving Network Integration Demand
- Zero-Trust Cybersecurity Mandates Boosting Security Services
- Margin Pressure from Outcome-Based Pricing Models
For complete list of drivers and restraints, kindly check the Table Of Contents.
Segment Analysis
Managed Services held 27.85% of the United States IT services market in 2025, driven by enterprises outsourcing run-and-operate functions to focus scarce talent on differentiating innovation. Hybrid-infrastructure complexity and relentless cyberthreats reinforce demand for fully managed observability, patching, and compliance services. Providers position bundled managed offerings as stepping stones to higher-value transformation engagements, ensuring annuity revenue streams and sticky client relationships.
Cloud & Platform Services, expanding at a 9.02% CAGR from 2026-2031, represents the growth engine of the United States IT services market. Clients accelerate large-scale generative-AI pilots directly onto public-cloud foundations, and consumption-based economics move more workloads off private data centers. Service partners, therefore, scale certified cloud squads and FinOps capabilities to control spend. Application Development & Maintenance services still secure sizable deal flow as legacy estates shift toward microservices and serverless paradigms. Meanwhile, cybersecurity and digital-transformation advisory maintain strong pipelines, given regulatory scrutiny and board-level prioritization of modernization road maps.
Onshore Delivery accounted for 62.65% of the United States IT services market size in 2025, reflecting client preference for regulatory compliance, timezone alignment, and domain knowledge. Domestic bill rates in the USD 115-175 per hour band reward deeply specialized consultants, especially in regulated industries. Providers sustain margin by concentrating high-touch architecture and governance roles in metropolitan hubs while dispersing execution to lower-cost U.S. cities.
Nearshore Delivery, forecast to grow 10.05% CAGR to 2031, meets rising demand for Spanish- and Portuguese-speaking agile pods that bridge U.S. business teams and Latin American engineering talent. Firms adopting a "Nearshore Plus" model base solution architects in the U.S. and scale development in Mexico, Colombia, and Costa Rica at blended rates near USD 85 per hour. Offshore delivery continues to supply cost leverage, but wage inflation in traditional hubs such as Bengaluru and Manila triggers selective reshoring of sensitive workloads.
The United States (US) IT Services is Segmented by Type (IT Consulting and Implementation, ADM, and More), Deployment Model (Onshore Delivery, Nearshore Delivery, and More), Engagement Model (Project-Based / Fixed Price, and More), Organization Size (Large Enterprises, Smes), End-User (BFSI, Manufacturing, Government, and More), and by Geography. The Market Forecasts are Provided in Terms of Value in USD.
List of Companies Covered in this Report:
- Accenture plc
- IBM Corporation
- Cognizant Technology Solutions Corp.
- Tata Consultancy Services Ltd.
- Microsoft Corporation
- Infosys Ltd.
- Wipro Ltd.
- Deloitte Consulting LLP
- Capgemini SE
- HCL Technologies Ltd.
- CGI Inc.
- DXC Technology Co.
- Booz Allen Hamilton Inc.
- Leidos Holdings Inc.
- Atos SE
- EPAM Systems Inc.
- NTT DATA Services
- Kyndryl Holdings Inc.
- LTI Mindtree Ltd.
- Tech Mahindra Ltd.
- Slalom LLC
- Perficient Inc.
- ThoughtWorks Inc.
- Persistent Systems Ltd.
Additional Benefits:
- The market estimate (ME) sheet in Excel format
- 3 months of analyst support
TABLE OF CONTENTS
1 INTRODUCTION
- 1.1 Study Assumptions and Market Definition
- 1.2 Scope of the Study
2 RESEARCH METHODOLOGY
3 EXECUTIVE SUMMARY
4 MARKET LANDSCAPE
- 4.1 Market Overview
- 4.2 Market Drivers
- 4.2.1 Federal Incentives Accelerating Cloud Migration in US Public Sector
- 4.2.2 Large-scale Adoption of Generative AI among Fortune 1000
- 4.2.3 5G and Edge Roll-out Driving Network Integration Demand
- 4.2.4 Zero-Trust Cybersecurity Mandates Boosting Security Services
- 4.2.5 Healthcare Interoperability Rules Fueling EHR Integration Services
- 4.2.6 PE-Backed ERP Modernization Wave in Mid-Market Firms
- 4.3 Market Restraints
- 4.3.1 Scarcity of Senior Cloud and Security Talent
- 4.3.2 Margin Pressure from Outcome-Based Pricing Models
- 4.3.3 Compliance Complexity under CCPA/CPRA Litigation
- 4.3.4 Offshore Wage Inflation Eroding Cost Advantages
- 4.4 Value / Supply-Chain Analysis
- 4.5 Regulatory Outlook
- 4.6 Technological Outlook
- 4.7 Porter's Five Forces
- 4.7.1 Bargaining Power of Suppliers
- 4.7.2 Bargaining Power of Buyers
- 4.7.3 Threat of New Entrants
- 4.7.4 Degree of Competition
- 4.7.5 Threat of Substitutes
- 4.8 Comparative Insights: Tier 1 vs Tier 2 Vendors
- 4.9 In-housing vs Outsourcing Analysis
- 4.10 Investment Analysis
5 MARKET SIZE AND GROWTH FORECASTS (VALUE)
- 5.1 By Service Type
- 5.1.1 IT Consulting and Implementation
- 5.1.2 Application Development and Maintenance (ADM)
- 5.1.3 Infrastructure Services
- 5.1.4 Managed Services
- 5.1.5 IT Outsourcing (ITO)
- 5.1.6 Business Process Outsourcing (BPO)
- 5.1.7 Cloud and Platform Services
- 5.1.8 Cybersecurity Services
- 5.1.9 Digital Transformation and Emerging Tech (AI, IoT, Blockchain)
- 5.2 By Deployment Model
- 5.2.1 Onshore Delivery
- 5.2.2 Nearshore Delivery
- 5.2.3 Offshore Delivery
- 5.3 By Engagement Model
- 5.3.1 Project-based / Fixed Price
- 5.3.2 Staff Augmentation / Time-and-Material
- 5.3.3 Managed Services / Outcome-based
- 5.4 By Organization Size
- 5.4.1 Large Enterprises
- 5.4.2 Small and Medium Enterprises (SMEs)
- 5.5 By End-User Industry
- 5.5.1 Banking, Financial Services and Insurance (BFSI)
- 5.5.2 Manufacturing
- 5.5.3 Government and Public Sector
- 5.5.4 Healthcare and Life Sciences
- 5.5.5 Retail and Consumer Goods
- 5.5.6 Telecom and Media
- 5.5.7 Transportation and Logistics
- 5.5.8 Energy and Utilities
- 5.5.9 Others
- 5.6 By Geography
- 5.6.1 Northeast
- 5.6.2 Midwest
- 5.6.3 South
- 5.6.4 West
6 COMPETITIVE LANDSCAPE
- 6.1 Market Concentration
- 6.2 Strategic Moves
- 6.3 Market Share Analysis
- 6.4 Company Profiles (includes Global level Overview, Market level overview, Core Segments, Financials as available, Strategic Information, Market Rank/Share for key companies, Products and Services, and Recent Developments)
- 6.4.1 Accenture plc
- 6.4.2 IBM Corporation
- 6.4.3 Cognizant Technology Solutions Corp.
- 6.4.4 Tata Consultancy Services Ltd.
- 6.4.5 Microsoft Corporation
- 6.4.6 Infosys Ltd.
- 6.4.7 Wipro Ltd.
- 6.4.8 Deloitte Consulting LLP
- 6.4.9 Capgemini SE
- 6.4.10 HCL Technologies Ltd.
- 6.4.11 CGI Inc.
- 6.4.12 DXC Technology Co.
- 6.4.13 Booz Allen Hamilton Inc.
- 6.4.14 Leidos Holdings Inc.
- 6.4.15 Atos SE
- 6.4.16 EPAM Systems Inc.
- 6.4.17 NTT DATA Services
- 6.4.18 Kyndryl Holdings Inc.
- 6.4.19 LTI Mindtree Ltd.
- 6.4.20 Tech Mahindra Ltd.
- 6.4.21 Slalom LLC
- 6.4.22 Perficient Inc.
- 6.4.23 ThoughtWorks Inc.
- 6.4.24 Persistent Systems Ltd.
7 MARKET OPPORTUNITIES AND FUTURE OUTLOOK
- 7.1 White-space and Unmet-Need Assessment
 大型通讯业者业务与IT服务:全球市场预测(2025-2030)
 2026年全球网路部署服务市场报告
 IT 服务市场:2026-2032 年全球市场预测(按服务类型、合约模式、最终用户、组织规模和部署方式划分)2026年全球5G网路部署服务市场报告2026年全球IT服务市场报告2026年全球硬体支援服务市场报告
 IT 服务市场规模、份额和趋势分析报告:按方法、类型、应用、技术、部署、企业规模、最终用途、地区和细分市场进行预测(2026-2033 年)
 IT 服务市场分析及预测(至 2035 年):按类型、产品类型、服务、技术、组件、应用、部署类型、最终用户和解决方案划分Oracle服务市场分析及预测(至 2035 年):依类型、产品类型、服务、技术、元件、应用、部署类型、终端使用者、功能及解决方案划分
 英国IT服务:市场占有率分析、产业趋势与统计、成长预测(2026-2031年)