


 |
市场调查报告书
商品编码
1940835
水溶性肥料:市场占有率分析、产业趋势与统计、成长预测(2026-2031)Water Soluble Fertilizer - Market Share Analysis, Industry Trends & Statistics, Growth Forecasts (2026 - 2031) |
||||||
※ 本网页内容可能与最新版本有所差异。详细情况请与我们联繫。
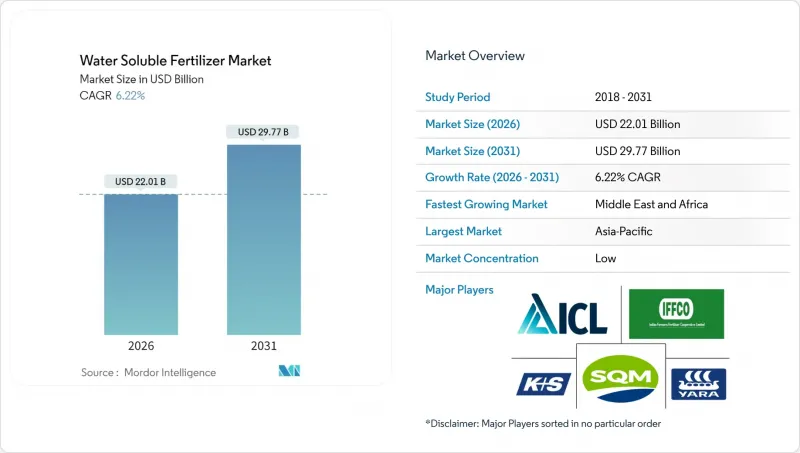
水溶性肥料市场预计将从 2025 年的 207.2 亿美元成长到 2026 年的 220.1 亿美元,预计到 2031 年将达到 297.7 亿美元,2026 年至 2031 年的复合年增长率为 6.22%。
农民转向精准施肥是推动市场需求成长的主要因素,精准施肥既能节约水资源,又能维持日益干旱地区的作物产量。政府加强对微灌系统的补贴力度、扩大温室种植面积以及增加排碳权额度,进一步加速了水溶性肥料市场对专业配方肥料的采用。竞争压力促使供应商提供结合农艺建议和数位化工具的解决方案,使农民能够即时监测养分吸收。这项策略正在增强水溶性肥料市场的品牌忠诚度。儘管原材料价格波动(尤其是螯合微量元素的价格)以及吸湿性盐类带来的物流挑战限制了市场成长,但这些因素尚未阻碍水溶性肥料市场的长期扩张趋势。
全球水溶性肥料市场趋势及洞察
扩大高价值作物施肥和灌溉系统的应用
随着监管机构收紧用水标准,农民寻求更高的单位面积收益,全球肥料灌溉系统的安装数量正以每年23%的速度成长。以色列的案例表明,肥料灌溉可使柑橘和酪梨的产量提高高达40%,同时减少30%的用水量。自动化施肥平台减少了人工投入,并将养分输送与植物生长阶段同步,从而提高了效率,并符合加州《永续地下水管理法》等法规的要求。虽然整套系统的安装成本在每公顷2000美元至4000美元之间,但贷款项目和基于绩效的补贴正在帮助降低初始投资,并扩大中等规模生产商进入水溶性肥料市场的机会。
温室栽培中精准营养管理的必要性
全球温室种植面积正以每年8.2%的速度成长,种植者正寻求全年稳定的供应保障。荷兰的农民透过封闭回路型施肥灌溉系统,持续达到95%以上的养分利用率,使番茄产量提升至每公顷500-600吨(是露天种植的六倍)。这一优异的产量也使得针对作物生长阶段定制的水溶性肥料价格更高。亚太地区各国正采用这种模式来加强粮食安全,新加坡的目标是到2030年实现30%的国内产量。要求提供养分管理通讯协定的认证体系,进一步推动了水溶性肥料市场对可追溯产品的需求。
与传统颗粒肥料相比,初始成本较高
对于价格敏感的种植者而言,40%至60%的价格溢价是推广应用的一大障碍。例如,儘管水溶性添加剂能够提高产量,但巴西大豆种植者的使用面积却不足其面积的15%。然而,考虑到节省的劳动成本和10%至20%的增产,其生命週期成本优势可能更为显着。目前,供应商提供的付款方式与收穫期相符,而且在亚太地区的多个项目中,补贴也部分抵消了成本差异。
细分市场分析
截至2025年,单一成分产品占水溶性肥料市场份额的52.74%,这反映了其成本效益和对多种作物的广泛适用性。硝酸钾和硫酸钾因其与常用灌溉系统的兼容性而在该类别中主导地位。单一成分肥料的优点在于其灵活的施肥方式,种植者可以根据即时土壤检测结果调整单一养分的施用量,这是水溶性肥料市场的关键实践。儘管价格敏感度较高,但由于田间作物持续采用,其销售量仍维持高位。
预计到2031年,复合肥市场将以6.38%的复合年增长率成长,这主要得益于种植者对便利性和作物特定营养成分的需求。其中,微量元素强化型复合肥料是成长最快的次类别,其采用缓释包衣技术,确保营养成分的持续供应。欧盟的註册规则有利于标准化复合肥产品的推广,推动了品牌化解决方案的整合,这些产品享有20-30%的溢价,从而提高了水溶性肥料市场的利润率。
本水溶性肥料市场报告按类型(复合肥与单质肥)、施用方法(灌溉与叶面喷布)、作物类型(田间作物、园艺作物、草坪草和观赏植物)以及地区(亚太地区、欧洲、中东和非洲、北美和南美)进行细分。市场预测以价值(美元)和数量(公吨)为单位。
区域分析
预计到2025年,亚太地区将占据水溶性肥料市场41.05%的份额,并在2031年之前以6.55%的复合年增长率成长。中国的人工气候种植面积正以每年25%的速度扩张,而印度已拨款18亿美元扩大微灌技术,以满足对水溶性营养素的需求。金源(KingEnter)和科罗曼德国际(Coromandel International)等本土生产商正持续扩大产能,以维持价格竞争力并确保供应的稳定性。
欧洲则位居第二,其中荷兰、西班牙和义大利领先。荷兰温室种植广泛使用高纯度水溶性肥料,养分利用率高达95%。在西班牙,橄榄园和柑橘园强制推行滴灌系统,满足了钾肥的需求。同时,义大利有机农民也越来越多地选择经认证的水溶性肥料,以满足消费者对永续生产的偏好。 「从农场到餐桌」倡议旨在减少20%的化肥用量,间接推动了水溶性肥料市场高效解决方案的发展。
北美市场持续强劲成长,主要得益于精密农业的普及。加州的养分管理强制性规定及其碳抵消计划,正在奖励那些采用检验的水溶性肥料管理方法的农民。加拿大谷物生产商正利用可变施肥技术来微调肥料用量,而墨西哥温室蔬菜出口则推动了对专为荷兰式温室设计的优质肥料混合物的需求。完善的推广服务和数位化咨询平台为水溶性肥料市场的先进使用模式提供了支援。
其他福利:
- Excel格式的市场预测(ME)表
- 3个月的分析师支持
目录
第一章 引言
- 研究假设和市场定义
- 调查范围
- 调查方法
第二章 报告
第三章执行摘要和主要发现
第四章:主要产业趋势
- 主要农作物种植面积
- 田间作物
- 园艺作物
- 平均施肥量
- 微量营养素
- 田间作物
- 园艺作物
- 宏量营养素
- 田间作物
- 园艺作物
- 次要大量营养素
- 田间作物
- 园艺作物
- 微量营养素
- 具有灌溉设施的农田
- 法律规范
- 价值炼和通路分析
- 市场驱动因素
- 扩大高价值作物施肥灌溉系统的应用
- 温室栽培中精准营养管理的必要性
- 全球滴灌面积扩大
- 政府补贴推广节水肥料
- 水耕可溶性特种复合肥料的快速成长
- 排碳权挂钩化肥计划
- 市场限制
- 与传统颗粒肥料相比,初始成本较高
- 水溶性盐类散装处理面临的物流挑战
- 封闭式灌溉迴路中离子特异性盐分的积累
- 螯合微量营养素成分供应不稳定
第五章 市场规模和成长预测(价值和数量)
- 类型
- 合成的
- 直的
- 按营养成分
- 微量营养素
- 含氮
- 磷酸盐
- 钾
- 次要大量营养素
- 按营养成分
- 应用模式
- 施肥灌溉
- 叶面喷布
- 作物类型
- 田间作物
- 园艺作物
- 草坪和观赏植物
- 地区
- 亚太地区
- 澳洲
- 孟加拉
- 中国
- 印度
- 印尼
- 日本
- 巴基斯坦
- 菲律宾
- 泰国
- 越南
- 亚太其他地区
- 欧洲
- 法国
- 德国
- 义大利
- 荷兰
- 俄罗斯
- 西班牙
- 乌克兰
- 英国
- 其他欧洲地区
- 中东和非洲
- 奈及利亚
- 沙乌地阿拉伯
- 南非
- 土耳其
- 其他中东和非洲地区
- 北美洲
- 加拿大
- 墨西哥
- 我们
- 北美其他地区
- 南美洲
- 阿根廷
- 巴西
- 南美洲其他地区
- 亚太地区
第六章 竞争情势
- 关键策略倡议公司
- 市占率分析
- 公司概况
- 公司简介
- Yara International ASA
- Sociedad Quimica y Minera de Chile SA
- Nutrien Ltd.
- Haifa Chemicals Ltd.
- ICL Group Ltd.
- K+S Aktiengesellschaft
- EuroChem Group AG
- Omnia Holdings Ltd.
- AgroLiquid Inc.
- Coromandel International Ltd.
- Grupa Azoty SA
- Valagro SpA(Syngenta Group)
- Kingenta Ecological Engineering Group Co., Ltd.
- Helena Agri-Enterprises, LLC(Marubeni Corporation)
- FoxFarm Soil and Fertilizer Company
第七章:CEO们需要思考的关键策略问题
The water soluble fertilizer market is expected to grow from USD 20.72 billion in 2025 to USD 22.01 billion in 2026 and is forecast to reach USD 29.77 billion by 2031 at 6.22% CAGR over 2026-2031.
Strong demand stems from farmers' shift to precision nutrient delivery that conserves water while sustaining yield in increasingly arid regions. Mounting government subsidies for micro-irrigation systems, expanding greenhouse acreage, and rising carbon-credit opportunities further accelerate the adoption of specialized formulations across the water soluble fertilizer market. Competitive pressure pushes suppliers to bundle agronomic advice with digital tools so growers can monitor nutrient uptake in real time, a tactic that strengthens brand loyalty within the water soluble fertilizer market. Volatile raw-material pricing, especially for chelated micronutrients, and logistical challenges posed by hygroscopic salts temper growth but have not derailed the long-term expansion trajectory of the water soluble fertilizer market.
Global Water Soluble Fertilizer Market Trends and Insights
Rising Adoption of Fertigation Systems in High-Value Crops
Global installations of fertigation equipment are growing 23% each year as regulators tighten water use thresholds and farmers aim for higher returns per hectare. Israel's experience shows that fertigation boosts citrus and avocado yields by up to 40% while lowering water consumption by 30%. Automated dosing platforms cut labor requirements and synchronize nutrient release with plant development, enhancing both efficiency and compliance with mandates such as California's Sustainable Groundwater Management Act. Although a full system costs USD 2,000-4,000 per hectare, financing programs and performance-linked subsidies help offset the upfront burden, widening access for mid-size producers across the water soluble fertilizer market.
Need for Precise Nutrient Management in Greenhouse Farming
The global greenhouse area is expanding at an annual rate of 8.2% as growers pursue year-round supply resilience. Dutch operators routinely achieve nutrient use efficiency above 95% through closed-loop fertigation, enabling tomato yields of 500-600 tonnes per hectare, which is six times the output of open-field farming. Such performance validates the premium purchases of soluble blends, which are customized for specific crop stages. Asia-Pacific countries are replicating the model to bolster food security, with Singapore aiming to achieve 30% domestic output by 2030. Certification schemes that require documented nutrient protocols further boost demand for traceable products within the water soluble fertilizer market.
High Initial Cost Versus Conventional Granular Fertilizers
Price premiums of 40-60% deter adoption among price-sensitive growers. Brazilian soybean farmers, for instance, limit their usage to below 15% of the acreage despite the yield benefits. However, when labor savings and 10-20% yield gains are factored in, lifecycle economics can tip in favor of soluble inputs. Suppliers now offer harvest-aligned payment schedules, and subsidies partially close the cost gap in several Asia-Pacific programs.
Other drivers and restraints analyzed in the detailed report include:
- Expansion of Drip Irrigation Acreage Worldwide
- Government Subsidies Promoting Water-Efficient Fertilizers
- Volatility in Chelated Micronutrient Raw Material Supply
For complete list of drivers and restraints, kindly check the Table Of Contents.
Segment Analysis
Straight products accounted for 52.74% of the water-soluble fertilizer market in 2025, reflecting their cost-effectiveness and versatility across various crops. Potassium nitrate and potassium sulfate dominate this category due to their compatibility with typical fertigation setups. The straight segment benefits from flexible dosing, which allows growers to adjust individual nutrients in response to real-time soil tests, a key practice within the water-soluble fertilizer market. Despite pricing sensitivity, sustained adoption in field crops continues to keep volumes high.
Complex formulations are gaining ground at a 6.38% CAGR through 2031 as growers demand convenience and crop-specific nutrient profiles. Micronutrient-enriched blends are the fastest-growing subset, leveraging controlled-release coatings to extend nutrient availability. European Union registration rules favor standardized complex products, encouraging consolidation around branded solutions that command 20-30% premiums and boost margins within the water-soluble fertilizer market.
The Water Soluble Fertilizer Market Report is Segmented by Type (Complex and Straight), Application Mode (Fertigation and Foliar), Crop Type (Field Crops, Horticultural Crops, and Turf and Ornamental), and Geography (Asia-Pacific, Europe, Middle East and Africa, North America, South America). The Market Forecasts are Provided in Terms of Value (USD) and Volume (Metric Tons).
Geography Analysis
Asia-Pacific commanded 41.05% of the water soluble fertilizer market share in 2025 and is projected to post a 6.55% CAGR to 2031. China's controlled environment acreage has grown at a 25% annual rate, while India has budgeted USD 1.8 billion for micro-irrigation expansion that addresses soluble nutrition demand. Local manufacturers, such as Kingenta and Coromandel International, continue to expand their capacity, keeping prices competitive and ensuring supply continuity.
Europe ranks second, driven by the Netherlands, Spain, and Italy. Dutch greenhouse operations achieve 95% nutrient use efficiency, relying heavily on high-purity soluble inputs. Spain's mandated drip systems in olive and citrus groves sustain potassium demand, and Italy's organic farmers increasingly choose certified water soluble products to meet consumer preference for sustainable production. The Farm to Fork initiative, targeting a 20% fertilizer-use reduction, indirectly favors high-efficiency solutions in the water soluble fertilizer market.
North America maintains robust momentum, led by the adoption of precision agriculture. California's nutrient management mandates, combined with carbon offset programs, reward farmers who deploy validated soluble regimens. Canadian grain producers utilize variable-rate technologies to fine-tune their applications, while Mexico's greenhouse vegetable exports drive demand for premium blends specifically designed for Dutch-style structures. Strong extension services and digital advisory platforms support sophisticated usage patterns within the water soluble fertilizer market.
- Yara International ASA
- Sociedad Quimica y Minera de Chile SA
- Nutrien Ltd.
- Haifa Chemicals Ltd.
- ICL Group Ltd.
- K+S Aktiengesellschaft
- EuroChem Group AG
- Omnia Holdings Ltd.
- AgroLiquid Inc.
- Coromandel International Ltd.
- Grupa Azoty S.A.
- Valagro S.p.A. (Syngenta Group)
- Kingenta Ecological Engineering Group Co., Ltd.
- Helena Agri-Enterprises, LLC (Marubeni Corporation)
- FoxFarm Soil and Fertilizer Company
Additional Benefits:
- The market estimate (ME) sheet in Excel format
- 3 months of analyst support
TABLE OF CONTENTS
1 INTRODUCTION
- 1.1 Study Assumptions & Market Definition
- 1.2 Scope of the Study
- 1.3 Research Methodology
2 REPORT OFFERS
3 EXECUTIVE SUMMARY AND KEY FINDINGS
4 KEY INDUSTRY TRENDS
- 4.1 Acreage Of Major Crop Types
- 4.1.1 Field Crops
- 4.1.2 Horticultural Crops
- 4.2 Average Nutrient Application Rates
- 4.2.1 Micronutrients
- 4.2.1.1 Field Crops
- 4.2.1.2 Horticultural Crops
- 4.2.2 Primary Nutrients
- 4.2.2.1 Field Crops
- 4.2.2.2 Horticultural Crops
- 4.2.3 Secondary Macronutrients
- 4.2.3.1 Field Crops
- 4.2.3.2 Horticultural Crops
- 4.2.1 Micronutrients
- 4.3 Agricultural Land Equipped For Irrigation
- 4.4 Regulatory Framework
- 4.5 Value Chain & Distribution Channel Analysis
- 4.6 Market Drivers
- 4.6.1 Rising adoption of fertigation systems in high-value crops
- 4.6.2 Need for precise nutrient management in greenhouse farming
- 4.6.3 Expansion of drip irrigation acreage worldwide
- 4.6.4 Government subsidies promoting water-efficient fertilizers
- 4.6.5 Surge in soluble specialty blends for hydroponics
- 4.6.6 Carbon-credit linked fertilizer programs
- 4.7 Market Restraints
- 4.7.1 High initial cost versus conventional granular fertilizers
- 4.7.2 Logistical challenges in bulk handling of soluble salts
- 4.7.3 Ion-specific salinity build-up in closed irrigation loops
- 4.7.4 Volatility in chelated micronutrient raw-material supply
5 MARKET SIZE & GROWTH FORECASTS (VALUE AND VOLUME)
- 5.1 Type
- 5.1.1 Complex
- 5.1.2 Straight
- 5.1.2.1 By Nutrient
- 5.1.2.1.1 Micronutrients
- 5.1.2.1.2 Nitrogenous
- 5.1.2.1.3 Phosphatic
- 5.1.2.1.4 Potassic
- 5.1.2.1.5 Secondary Macronutrients
- 5.1.2.1 By Nutrient
- 5.2 Application Mode
- 5.2.1 Fertigation
- 5.2.2 Foliar
- 5.3 Crop Type
- 5.3.1 Field Crops
- 5.3.2 Horticultural Crops
- 5.3.3 Turf & Ornamental
- 5.4 Region
- 5.4.1 Asia-Pacific
- 5.4.1.1 Australia
- 5.4.1.2 Bangladesh
- 5.4.1.3 China
- 5.4.1.4 India
- 5.4.1.5 Indonesia
- 5.4.1.6 Japan
- 5.4.1.7 Pakistan
- 5.4.1.8 Philippines
- 5.4.1.9 Thailand
- 5.4.1.10 Vietnam
- 5.4.1.11 Rest of Asia-Pacific
- 5.4.2 Europe
- 5.4.2.1 France
- 5.4.2.2 Germany
- 5.4.2.3 Italy
- 5.4.2.4 Netherlands
- 5.4.2.5 Russia
- 5.4.2.6 Spain
- 5.4.2.7 Ukraine
- 5.4.2.8 United Kingdom
- 5.4.2.9 Rest of Europe
- 5.4.3 Middle East & Africa
- 5.4.3.1 Nigeria
- 5.4.3.2 Saudi Arabia
- 5.4.3.3 South Africa
- 5.4.3.4 Turkey
- 5.4.3.5 Rest of Middle East & Africa
- 5.4.4 North America
- 5.4.4.1 Canada
- 5.4.4.2 Mexico
- 5.4.4.3 United States
- 5.4.4.4 Rest of North America
- 5.4.5 South America
- 5.4.5.1 Argentina
- 5.4.5.2 Brazil
- 5.4.5.3 Rest of South America
- 5.4.1 Asia-Pacific
6 COMPETITIVE LANDSCAPE
- 6.1 Key Strategic Moves
- 6.2 Market Share Analysis
- 6.3 Company Landscape
- 6.4 Company Profiles
- 6.4.1 Yara International ASA
- 6.4.2 Sociedad Quimica y Minera de Chile SA
- 6.4.3 Nutrien Ltd.
- 6.4.4 Haifa Chemicals Ltd.
- 6.4.5 ICL Group Ltd.
- 6.4.6 K+S Aktiengesellschaft
- 6.4.7 EuroChem Group AG
- 6.4.8 Omnia Holdings Ltd.
- 6.4.9 AgroLiquid Inc.
- 6.4.10 Coromandel International Ltd.
- 6.4.11 Grupa Azoty S.A.
- 6.4.12 Valagro S.p.A. (Syngenta Group)
- 6.4.13 Kingenta Ecological Engineering Group Co., Ltd.
- 6.4.14 Helena Agri-Enterprises, LLC (Marubeni Corporation)
- 6.4.15 FoxFarm Soil and Fertilizer Company
7 KEY STRATEGIC QUESTIONS FOR FERTILIZER CEOS
 水溶性肥料市场:按类型、产品类型、配方、包装、作物类型、分销管道和应用划分-2026-2032年全球市场预测
 全球水溶性肥料市场:按类型、应用方法、形态、作物类型和地区划分-预测(至2031年)
 全球水溶性肥料市场规模、份额、趋势和成长分析报告(2026-2034年)
 2026年全球水溶性肥料市场报告全球含氮水溶性肥料市场报告(2026 年)水溶性中等元素肥料市场按形态、作物类型、包装规格、销售管道管道、最终用户和应用划分-2026-2032年全球预测水溶性园艺肥料市场按作物类型、形态、营养类型、施用方法和分销管道划分-全球预测(2026-2032 年)
 水溶性肥料市场规模、份额和趋势分析报告:按产品、作物、应用、地区和细分市场预测(2026-2033 年)
 水溶性肥料市场规模、份额和成长分析(按类型、形态、应用方法、作物类型、分销管道和地区划分)—产业预测(2026-2033 年)
 水溶性肥料市场机会、成长动力、产业趋势分析及2025-2034年预测