


 |
市场调查报告书
商品编码
1940860
冷却塔:市场占有率分析、产业趋势与统计、成长预测(2026-2031)Cooling Tower - Market Share Analysis, Industry Trends & Statistics, Growth Forecasts (2026 - 2031) |
||||||
※ 本网页内容可能与最新版本有所差异。详细情况请与我们联繫。
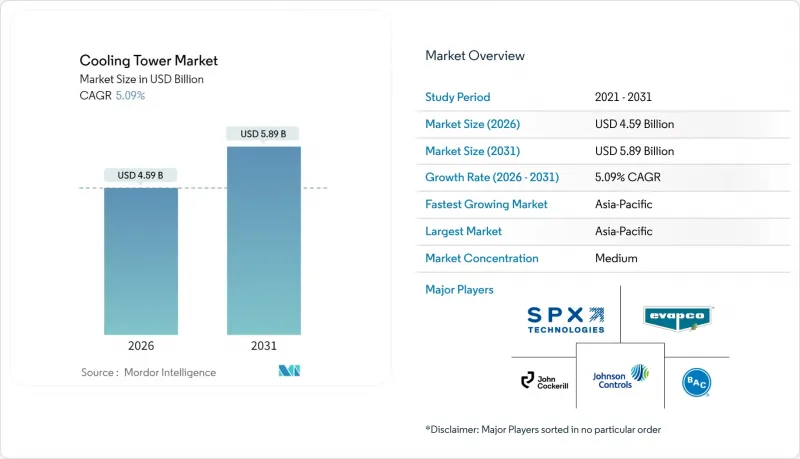
预计到 2026 年,冷却塔市场规模将达到 45.9 亿美元,高于 2025 年的 43.7 亿美元。
预计到 2031 年将达到 58.9 亿美元,2026 年至 2031 年的复合年增长率为 5.09%。
电力产业的持续资本投资和超大规模资料中心设施的扩张,不断推动对大容量蒸发冷却系统的需求。同时,营运商正在加速采用混合式(干湿两用)设计,以应对日益严格的用水和能源效率法规。逆流式冷却水塔配置的加速普及、20MW以上装置容量的成长以及向不含PFAS填充材的过渡,进一步巩固了冷却塔市场的成长动能。随着永续性需求的日益增长,能够整合数位双胞胎分析、预测性维护和替代补水方案的供应商,将在实施这些策略方面占据优势。
全球冷却塔市场趋势与洞察
商业地产中暖通空调设备的扩建
混合用途设施和高规格资料中心的快速商业化正推动开发人员转向高容量、数位化监控的蒸发冷却和混合系统。江森自控报告称,来自智慧建筑业主的累积订单高达131亿美元,这些业主指定使用配备需量反应控制设备的冷却塔,该控制器可与建筑自动化伺服器连接。物联网感测器整合可实现预测性维护程序并减少停机时间。水资源紧张的地区越来越多地采用干湿混合式机组,以满足监管标准,同时又不影响负载追踪能力。能够透过CTI认证的性能测试证明实际节能效果的供应商,在房地产投资者审核永续性指标时,将获得采购优势。
亚洲和中东电厂产能扩张
中国、印度和海湾地区的电力公司正在扩大核能、燃气和可再生能源混合发电厂的规模,这些电厂需要大容量逆流冷却塔来应对波动的蒸气负荷。中国的河西工业蒸气互联繫统(河西一号)每年输送480万吨製程蒸气,展现了将冷却塔整合到工业余热回收迴路的商业性效益。海湾合作委员会(GCC)国家的公共产业正在沿海联合循环燃气涡轮机发电厂采用海水冷却冷却塔,从而减少淡水取用量,即使在极端室外温度下也能实现超过40%的运转率。中东地区太阳热能发电的扩张进一步凸显了混合系统的优势,这些系统与未来的碳定价机制相容。
营运成本上升和对缺水问题的担忧
在干旱地区,随着化学品和废水处理成本超过电力成本,总拥有成本不断上升。太平洋西北国家实验室的一项案例研究发现,军事设施透过回收空调冷凝水和雨水来减少补给水需求,但整合储水设施相关的资本支出意味着投资回收期超过五年。在澳洲和中东等水价超过每千加仑5美元的地区,即使效率降低,设施也越来越多地采用干式冷却和混合式设计。提供性能保证和节水改造维修的供应商正在获得长期服务合同,从而缓解新建设较少时期的收入波动。
细分市场分析
到2025年,逆流式冷却塔将占市场收入的43.10%,年复合成长率达7.69%,主要得益于资料中心和製药客户对高液气比和小面积的优先考虑。将逆流式冷却塔与製程冷水冷却器结合的工业热泵计划,每年可实现超过15%的节能效果,从而直接改善食品饮料厂的营运成本敏感度。交叉流冷却塔在装机量方面仍保持优势,尤其是在燃煤和燃气涡轮机发电厂,其低静压损失可降低辅助负载。然而,随着水价上涨导致温度控制更加严格,预计横流式冷却水塔的市占率将会下降。数位双胞胎模拟已证实,当与预测性储水管理系统整合时,逆流式设计可降低5%的营运成本,这将进一步推动市场份额的成长。
现有的交叉流冷却水塔在维修应用中仍然具有吸引力,因为填充材易于更换,且较大的表面积能够吸收污垢而不会即时降低性能。采取分阶段监管策略的业者通常会维修冷却塔正逐渐成为标准配置,征兆一场结构性变革,将在未来十年重塑製造商的产品系列。
混合式(干湿结合)冷却水塔的年复合成长率高达 8.34%,超过了预计到 2025 年仍将占据 66.40% 市场份额的蒸发式冷却塔。在缺水地区,公共产业尤其青睐混合式设计,因为这种设计可以在干旱限制期间切换到干式模式,在保持热效率的同时,减少 50% 的季节性用水量。穿孔露点间接蒸发模组的现场测试证实,在送风比低于 0.5 时可实现最佳热效率,这验证了混合式冷却水塔作为烟气处理维修方案的可行性。
蒸发式冷却塔在大容量应用中占据主导地位。湿式运转可将温度控制在湿球温度3°C以内,对蒸气循环效率至关重要。为了规避市场风险,供应商正在推出模组化混合式冷却系统,该系统可改装到现有的蒸发式冷却罐上,从而有效地改造传统设备。材料技术的进步,例如亲水性薄膜填充材,有望使混合式冷却系统的出口温度更接近湿式运作基准值,从而加剧都市区医院和半导体工厂等对烟雾控制要求极高的场所的竞争。
冷却塔市场报告按流量类型(横流式和逆流式)、塔类型(蒸发式、干式、混合式)、容量范围(小于 5 MW、5-20 MW、大于 20 MW)、应用(石油和天然气、化工和石化、发电、暖通空调製冷、数据中心、纸浆和造纸、食品和饮料、其他地区进行细分、欧洲地区和其他地区进行亚积水。
区域分析
亚太地区占冷却塔市场43.70%的份额,预计在中印两国电力、石化和资料中心基础设施同步投资的推动下,将以6.78%的复合年增长率成长。中国的核能-蒸气汽电共生模式代表了该地区的综合发展模式,将工业脱碳目标与製程热优化相结合。印度正在加大火电厂维修的力度,采用混合式冷却塔,以符合即将推出的限制用水强度的国家水资源标准。
在北美,资料中心扩建的需求(主要集中在维吉尼亚、德克萨斯州和太平洋西北地区)推动了炼油厂维修的需求,以去除 PFAS填充材。美国暖气、冷气与空调工程师学会 (ASHRAE) 和美国环保署 (EPA) 的严格指导方针,促使人们更倾向于采购经 CTI 认证的低漂移冷却水塔。在欧洲,德国和斯堪地那维亚的区域能源项目采用混合式干湿组合冷却塔,以平衡水资源管理和应对季节性负荷波动,从而保持了温和的增长。在非洲,淡水短缺推动了对零排放循环的需求,导致与太阳热能发电和海水淡化联合装置相关的海水冷却冷却塔和干式冷却水塔的应用日益增加。南美洲的成长主要集中在巴西的矿区和阿根廷的大豆加工中心,这两个地区都在采用 20MW 以上的逆流式冷却塔来应对高粉尘和负荷波动问题。这些区域趋势表明,即使在不同的气候和法规环境下,冷却塔市场也具有很强的韧性。
其他福利:
- Excel格式的市场预测(ME)表
- 3个月的分析师支持
目录
第一章 引言
- 研究假设和市场定义
- 调查范围
第二章调查方法
第三章执行摘要
第四章 市场情势
- 市场概览
- 市场驱动因素
- 商业地产中暖通空调设备的扩建
- 亚洲和中东的发电厂装置容量成长
- 严格的用水和能源效率法规(CTI、ASHRAE)
- 新兴经济体的工业化与炼油升级
- 超大规模资料中心园区建设快速扩张
- 需要製程冷却的绿色氢电解计划
- 市场限制
- 高昂的营业成本和对缺水问题的担忧
- 烟羽抑制/漂移物清除监管合规成本
- 向功率小于1MW范围内的绝热干式冷却器过渡
- 逐步淘汰 PFAS填充材导致维修多于新建设。
- 供应链分析
- 监管环境
- 技术展望
- 波特五力模型
- 供应商的议价能力
- 消费者议价能力
- 新进入者的威胁
- 替代品的威胁
- 竞争对手之间的竞争
第五章 市场规模与成长预测
- 按流量类型
- 交叉流
- 回流
- 按塔型
- 蒸发冷却
- 干燥
- 混合型(干湿两用)
- 按容量范围
- 小于5兆瓦
- 5~20MW
- 超过20兆瓦
- 透过使用
- 石油和天然气
- 化工/石油化工
- 发电
- 暖通空调(适用于商业大楼)
- 资料中心
- 纸浆和造纸
- 食品/饮料
- 其他的
- 按地区
- 北美洲
- 我们
- 加拿大
- 墨西哥
- 欧洲
- 德国
- 英国
- 法国
- 义大利
- 西班牙
- 俄罗斯
- 其他欧洲地区
- 亚太地区
- 中国
- 印度
- 日本
- 韩国
- 东南亚国协
- 亚太其他地区
- 南美洲
- 巴西
- 阿根廷
- 南美洲其他地区
- 中东和非洲
- 沙乌地阿拉伯
- 阿拉伯聯合大公国
- 卡达
- 南非
- 埃及
- 其他中东和非洲地区
- 北美洲
第六章 竞争情势
- 市场集中度
- 策略性倡议(併购、伙伴关係、购电协议)
- 市场占有率分析(主要企业的市场排名和份额)
- 公司简介
- SPX Technologies, Inc.
- Baltimore Aircoil Company, Inc.
- EVAPCO, Inc.
- Johnson Controls International plc
- Hamon and CIE(John Cockerill SA)
- Brentwood Industries, Inc.
- Babcock and Wilcox Enterprises, Inc.
- ENEXIO Management GmbH
- Thermax Ltd.
- Artech Cooling Towers Pvt. Ltd.
- Kelvion Holding GmbH
- Paharpur Cooling Towers Ltd.
- Liang Chi Industry Co., Ltd.
- Star Cooling Towers Pvt. Ltd.
- Delta Cooling Towers, Inc.
- Reymsa Cooling Towers, Inc.
- SPIG SpA(BandW)
- Kimre, Inc.
- Mesan Group
第七章 市场机会与未来展望
Cooling Tower Market size in 2026 is estimated at USD 4.59 billion, growing from 2025 value of USD 4.37 billion with 2031 projections showing USD 5.89 billion, growing at 5.09% CAGR over 2026-2031.
Continued capital formation in power generation and the build-out of hyperscale data-center campuses keep high-capacity evaporative systems in demand, while hybrid wet-dry designs scale faster as operators react to tightening water-use and energy-efficiency regulations. The accelerated adoption of counter-flow configurations, growth in installations exceeding 20 MW, and the shift to PFAS-free fill materials further reinforce the cooling tower market's growth trajectory. Suppliers capable of integrating digital twin analytics, predictive maintenance, and alternative make-up-water schemes hold an execution edge as sustainability mandates intensify.
Global Cooling Tower Market Trends and Insights
Expanding HVACR Installations in Commercial Real-Estate
The rapid commercialization of mixed-use complexes and high-specification data centers is driving developers toward higher-capacity, digitally monitored evaporative and hybrid systems. Johnson Controls reported a USD 13.1 billion order backlog as smart-building owners specify cooling towers equipped with demand-responsive controls that synchronize with building automation servers. The integration of IoT sensors enables predictive maintenance routines that reduce downtime. Projects in water-stressed localities are increasingly selecting hybrid wet-dry units to meet compliance thresholds without compromising load-following capability. Suppliers that can validate real-world energy savings through CTI-certified performance testing gain a procurement advantage when property investors audit sustainability metrics.
Power Plant Capacity Additions in Asia and Middle East
Utilities in China, India, and the Gulf states are scaling nuclear, gas-fired, and renewable-hybrid plants that require high-capacity counter-flow towers to manage variable steam loads. China's Heqi-1 industrial steam linkage delivers 4.8 million tonnes of process steam annually, underscoring the commercial benefits of integrating cooling towers into industrial heat-recovery loops. GCC utilities adopt seawater-cooled towers at coastal Combined Cycle Gas Turbine sites, reducing freshwater withdrawal and enabling capacity factors above 40% in extreme ambient temperatures. The Middle East's move toward solar-thermal augmentation further positions hybrid systems as compliance-ready for future carbon pricing schemes.
High Operating Cost and Water-Scarcity Concerns
The total cost of ownership is rising because chemical conditioning and discharge fees now exceed electricity costs in many arid markets. Pacific Northwest National Laboratory case studies show that military installations are lowering makeup water demand by recovering HVAC condensate and rainwater; however, capital outlays for integrated storage push payback periods beyond five years. Facilities in Australia and the Middle East, where water charges exceed USD 5 per 1,000 gallons, are increasingly justifying dry cooling or hybrid designs despite efficiency penalties. Suppliers that bundle performance guarantees with water-saving retrofits secure longer-term service contracts that smooth revenue volatility during new-build lulls.
Other drivers and restraints analyzed in the detailed report include:
- Stringent Water-Use and Energy-Efficiency Mandates
- Rapid Build-Out of Hyperscale Data-Center Campuses
- PFAS-Fill Material Phase-Out Increasing Retrofit Demand
For complete list of drivers and restraints, kindly check the Table Of Contents.
Segment Analysis
Counter-flow installations captured 43.10% of the revenue in 2025 and are growing at a 7.69% CAGR, as data-center and pharmaceutical clients prioritize high L/G ratios and smaller footprints. Industrial heat-pump projects that couple counter-flow towers with process chillers deliver annual energy savings of over 15%, directly improving OPEX sensitivity in food & beverage plants. Cross-flow towers retain an installed-base advantage, particularly at coal and gas turbines, where low static-pressure drops ease auxiliary load. However, their share is expected to erode as water tariff escalators favor a more stringent approach to temperature control. Digital twin simulations confirm that counter-flow designs can cut operating cost by 5% when integrated with predictive reservoir management, further propelling share gains.
Legacy cross-flow units remain attractive for retrofit because fill packs are more accessible, and large surface areas accommodate fouling without immediate performance loss. Owners pursuing phased compliance strategies often refurbish cross-flow cells with low-drift eliminators to postpone capital replacement. Even so, new industrial complexes in Southeast Asia are standardizing counter-flow towers sized for a design wet-bulb depression of more than 10 °C, signaling a structural pivot that will reshape manufacturer product portfolios over the decade.
Hybrid wet-dry models are advancing at an 8.34% CAGR, outpacing evaporative towers, which are expected to hold a 66.40% share in 2025. Utilities in water-stressed areas appreciate hybrid designs that switch to dry mode during drought restrictions, maintaining thermal compliance while cutting seasonal water draw by 50%. Field trials of perforated dew-point indirect evaporative modules confirm that supply-air ratios below 0.5 achieve optimal thermal efficiency gains, positioning hybrids as viable replacements for plume-abatement retrofits.
Evaporative towers dominate high-capacity applications because wet operation achieves approach temperatures within 3 °C of the wet-bulb temperature, which is crucial for steam-cycle efficiency. Suppliers hedge market risk by launching modular hybrid lines that retrofit onto evaporative basins, effectively transforming legacy assets. Material advances such as hydrophilic membrane fill promise to push hybrid outlet temperatures closer to wet operation benchmarks, intensifying competition for urban hospitals and semiconductor fabs where plume mitigation is non-negotiable.
The Cooling Tower Market Report is Segmented by Flow Type (Cross-Flow and Counter-Flow), Tower Type (Evaporative, Dry, and Hybrid), Capacity Range (Below 5 MW, 5 To 20 MW, and Above 20 MW), Application (Oil and Gas, Chemical and Petrochemical, Power Generation, HVACR, Data Centers, Pulp and Paper, Food and Beverage, and Others), and Geography (North America, Europe, Asia Pacific, South America, and Middle East and Africa).
Geography Analysis
The Asia-Pacific region commands 43.70% of the cooling tower market and is expected to grow at a 6.78% CAGR, driven by synchronized investments in power, petrochemical, and data center infrastructure across China and India. China's nuclear-steam cogeneration model exemplifies the region's integrated approach, combining industrial decarbonization targets with process heat optimization. India's thermal power refurbishments increasingly specify hybrid towers to conform with draft national water norms that cap withdrawal intensity.
North America registers demand primarily from data-center expansions clustered in Virginia, Texas, and the Pacific Northwest, paired with refinery retrofits to remove PFAS-based fill. Stringent ASHRAE and EPA guidelines further shape procurement toward CTI-certified, low-drift cells. Europe sustains moderate growth as district energy schemes in Germany and Scandinavia adopt hybrid wet-dry towers to balance water stewardship and seasonal load variation. The Middle East and Africa are witnessing a rising uptake of seawater and dry towers attached to solar-thermal and desalination complexes, where freshwater scarcity commands a premium on zero-discharge cycles. South American momentum concentrates in Brazil's mining corridors and Argentina's soy-crushing hubs, both leaning on >20 MW counter-flow towers to handle high dust and variable loading. Collectively, these regional dynamics validate the cooling tower market's resilience across climatic and regulatory mosaics.
- SPX Technologies, Inc.
- Baltimore Aircoil Company, Inc.
- EVAPCO, Inc.
- Johnson Controls International plc
- Hamon and CIE (John Cockerill SA)
- Brentwood Industries, Inc.
- Babcock and Wilcox Enterprises, Inc.
- ENEXIO Management GmbH
- Thermax Ltd.
- Artech Cooling Towers Pvt. Ltd.
- Kelvion Holding GmbH
- Paharpur Cooling Towers Ltd.
- Liang Chi Industry Co., Ltd.
- Star Cooling Towers Pvt. Ltd.
- Delta Cooling Towers, Inc.
- Reymsa Cooling Towers, Inc.
- SPIG S.p.A (BandW)
- Kimre, Inc.
- Mesan Group
Additional Benefits:
- The market estimate (ME) sheet in Excel format
- 3 months of analyst support
TABLE OF CONTENTS
1 Introduction
- 1.1 Study Assumptions & Market Definition
- 1.2 Scope of the Study
2 Research Methodology
3 Executive Summary
4 Market Landscape
- 4.1 Market Overview
- 4.2 Market Drivers
- 4.2.1 Expanding HVACR installations in commercial real-estate
- 4.2.2 Power?plant capacity additions in Asia and Middle East
- 4.2.3 Stringent water-use and energy-efficiency mandates (CTI, ASHRAE)
- 4.2.4 Industrialization and refinery upgrades in emerging economies
- 4.2.5 Rapid build-out of hyperscale data-center campuses
- 4.2.6 Green hydrogen electrolyzer projects needing process cooling
- 4.3 Market Restraints
- 4.3.1 High operating cost and water?scarcity concerns
- 4.3.2 Plume-abatement/drift-elimination compliance costs
- 4.3.3 Shift toward adiabatic dry coolers in below 1 MW range
- 4.3.4 PFAS-fill material phase-out increasing retrofit over new build
- 4.4 Supply-Chain Analysis
- 4.5 Regulatory Landscape
- 4.6 Technological Outlook
- 4.7 Porter's Five Forces
- 4.7.1 Bargaining Power of Suppliers
- 4.7.2 Bargaining Power of Consumers
- 4.7.3 Threat of New Entrants
- 4.7.4 Threat of Substitutes
- 4.7.5 Intensity of Competitive Rivalry
5 Market Size & Growth Forecasts
- 5.1 By Flow Type
- 5.1.1 Cross-Flow
- 5.1.2 Counter-Flow
- 5.2 By Tower Type
- 5.2.1 Evaporative
- 5.2.2 Dry
- 5.2.3 Hybrid (Wet-Dry)
- 5.3 By Capacity Range
- 5.3.1 Below 5 MW
- 5.3.2 5 to 20 MW
- 5.3.3 Above 20 MW
- 5.4 By Application
- 5.4.1 Oil and Gas
- 5.4.2 Chemical and Petrochemical
- 5.4.3 Power Generation
- 5.4.4 HVACR (Commercial Buildings)
- 5.4.5 Data Centers
- 5.4.6 Pulp and Paper
- 5.4.7 Food and Beverage
- 5.4.8 Others
- 5.5 By Geography
- 5.5.1 North America
- 5.5.1.1 United States
- 5.5.1.2 Canada
- 5.5.1.3 Mexico
- 5.5.2 Europe
- 5.5.2.1 Germany
- 5.5.2.2 United Kingdom
- 5.5.2.3 France
- 5.5.2.4 Italy
- 5.5.2.5 Spain
- 5.5.2.6 Russia
- 5.5.2.7 Rest of Europe
- 5.5.3 Asia Pacific
- 5.5.3.1 China
- 5.5.3.2 India
- 5.5.3.3 Japan
- 5.5.3.4 South Korea
- 5.5.3.5 ASEAN Countries
- 5.5.3.6 Rest of Asia Pacific
- 5.5.4 South America
- 5.5.4.1 Brazil
- 5.5.4.2 Argentina
- 5.5.4.3 Rest of South America
- 5.5.5 Middle East and Africa
- 5.5.5.1 Saudi Arabia
- 5.5.5.2 United Arab Emirates
- 5.5.5.3 Qatar
- 5.5.5.4 South Africa
- 5.5.5.5 Egypt
- 5.5.5.6 Rest of Middle East and Africa
- 5.5.1 North America
6 Competitive Landscape
- 6.1 Market Concentration
- 6.2 Strategic Moves (MandA, Partnerships, PPAs)
- 6.3 Market Share Analysis (Market Rank/Share for key companies)
- 6.4 Company Profiles (includes Global level Overview, Market level overview, Core Segments, Financials as available, Strategic Information, Products and Services, and Recent Developments)
- 6.4.1 SPX Technologies, Inc.
- 6.4.2 Baltimore Aircoil Company, Inc.
- 6.4.3 EVAPCO, Inc.
- 6.4.4 Johnson Controls International plc
- 6.4.5 Hamon and CIE (John Cockerill SA)
- 6.4.6 Brentwood Industries, Inc.
- 6.4.7 Babcock and Wilcox Enterprises, Inc.
- 6.4.8 ENEXIO Management GmbH
- 6.4.9 Thermax Ltd.
- 6.4.10 Artech Cooling Towers Pvt. Ltd.
- 6.4.11 Kelvion Holding GmbH
- 6.4.12 Paharpur Cooling Towers Ltd.
- 6.4.13 Liang Chi Industry Co., Ltd.
- 6.4.14 Star Cooling Towers Pvt. Ltd.
- 6.4.15 Delta Cooling Towers, Inc.
- 6.4.16 Reymsa Cooling Towers, Inc.
- 6.4.17 SPIG S.p.A (BandW)
- 6.4.18 Kimre, Inc.
- 6.4.19 Mesan Group
7 Market Opportunities & Future Outlook
- 7.1 White-space and Unmet-Need Assessment
 冷却塔市场报告:按塔型、流型、设计、建筑材料、最终用户和地区划分(2026-2034 年)
 现场组合式冷却塔市场:依塔型、通风方式、材质、配水系统及应用划分-2026-2032年全球市场预测冷却塔市场:2026-2032年全球市场预测(按类型、设计、冷却方式、材质、安装类型、最终用途产业和分销管道划分)
 2026年全球现场安装冷却塔市场报告
 全球冷却塔市场规模、份额、趋势和成长分析报告(2026-2034年)2026年全球冷却水塔市场报告全球冷却水塔市场:市场规模、占有率、成长率、产业分析、依类型、应用和地区划分的分析以及未来预测(2026-2034)
 冷却塔市场-全球产业规模、份额、趋势、机会、预测:按产品、材料、应用、区域和竞争格局划分,2021-2031年现场安装式冷却塔市场 - 全球产业规模、份额、趋势、机会及预测(按类型、设计、最终用户、地区和竞争格局划分,2021-2031年)日本冷却水塔市场报告(按塔型、流型、设计、结构材料(纤维增强塑胶、钢材、混凝土、木材、高密度聚乙烯及其他)、最终用户和地区划分,2026-2034年)