


|
市场调查报告书
商品编码
1742156
通讯业者市场追踪(2024 年第四季):年度资本支出持续低迷,低于 3,000 亿美元Global Telco Market Tracker, 4Q24: Telco Revenues Edge Higher in 4Q24 as Annual Capex Stays Muted Below $300B |
|||||||
本报告提供了 140 家全球通讯网路营运商(电信营运商)的详细财务和营运概况,追踪了它们从 2011 年第一季到 2012 年第四季的业绩。报告重点关注最近一个季度和 2024 年全年的业绩,涵盖收入、劳动力、资本支出、营运支出和获利数据。
视觉
主要调查结果:
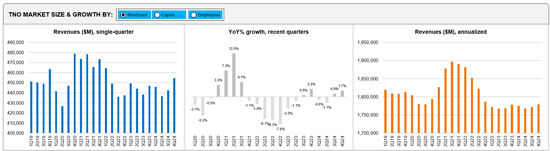
- 2024年第四季,营运商市场营收年增1.7%,达到4,547亿美元,全年营收持平于1.78兆美元。 2024年的成长主要由Airtel(+9.1%)、STC(沙乌地电信)(+4.9%)和America Movil(+4.0%)引领。同时,沃达丰(-11.1%)和Orange(-6.1%)的收入大幅下滑。
- 2024年全年资本支出较去年同期下降6.2%至2,954亿美元,为至少2011年以来的最低水平,甚至低于受新冠疫情影响的2020年(2,968亿美元)。资本支出削减幅度最大的是Reliance Jio(-33.2%)、KDDI(-19.9%)和America Movil(-19.0%),而BSNL和Telstra则增加了资本支出。
- 预计2024年人力成本将年减2.6%至2,583亿美元,业者员工总数将降至441万人。人工成本占不包括折旧和摊提(D&A)的营运费用的21.9%。
- 儘管面临成本压力,但预计2024年的获利能力将较上一年略有改善,息税前利润(EBIT)为15.3%,息税折旧摊销前利润(EBITDA)为33.7%,显示营运效率保持稳定。
- 按地区划分,美洲地区在2024年仍将是最大的贡献地区,其收入(占全球总收入的37.7%)和资本支出(占36.1%)均占比最大。同时,欧洲的资本支出与收入比率(资本密集度)最高,为18.6%。
对象经营者:
|
|
对象地区:
|
|
目录
第1章 报告亮点
第2章 摘要
第3章 市场概述
第4章 分析
第5章 主要统计:~2024年第四季
第6章 劳动统计
第7章 业者排行榜
第8章 企业的详细调查
第9章 企业基准
第10章 各国明细
第11章 企业·各国明细
第12章 各地区的明细
第13章 原始数据
第14章 用户数·流量
第15章 汇率
第16章 调查手法·调查范围
第17章 关于本报告
This report delivers a detailed financial and operational snapshot of 140 telecommunications network operators (telcos) worldwide, tracking performance from 1Q11 through 4Q24. It captures revenue, labor, capex, opex, and profitability data with a focus on the most recent quarter and full-year 2024 results.
VISUALS
Key findings:
- Revenue rose 1.7% YoY in 4Q24 to $454.7 billion (B), but full-year topline was flat at $1.78 trillion (T). Airtel (9.1%), STC (Saudi Telecom) (4.9%), and America Movil (4.0%) led growth in 2024, while Vodafone (-11.1%) and Orange (-6.1%) declined sharply.
- Capex dropped 6.2% YoY to $295.4B for full-year 2024, the lowest level since at least 2011, dipping below even the COVID-hit 2020 levels ($296.8B). Reliance Jio (-33.2%), KDDI (-19.9%), America Movil (-19.0%) posted the largest cuts in 2024, while BSNL and Telstra ramped up spending.
- Labor costs fell 2.6% YoY to $258.3B in 2024, with telco headcount shrinking to 4.41 million. Labor represented 21.9% of opex (excluding D&A) for the full-year 2024.
- Profitability margins inched higher in 2024 from a year ago, with EBIT at 15.3% and EBITDA at 33.7%, suggesting stable operational efficiency despite cost pressures.
- Regionally, the Americas remained the top contributor in 2024 to both revenue (37.7% global share) and capex (36.1% global share), while Europe recorded the highest capital intensity at 18.6%.
Important note: We have made some significant enhancements to our telco market review report in 1Q24. The changes are designed to provide a more insightful and user-friendly experience:
- 'Market Snapshot' Tab: This tab now features an interactive dashboard view of the telco market, allowing users to interact with and analyze market data more effectively. Additionally, users can export the dashboard to PDF for convenient sharing and reference.
- Two distinct sections have been created from the previous 'Company Deepdive & Benchmarking' section for greater clarity and functionality:
1.'Company Drilldown': Provides a comprehensive analysis of a selected company from the full set of 140 telcos. It covers various metrics including revenue, capex, employee counts, costs, profitability, cash and debt levels, and key ratios.
2.'Company Benchmarking': Focuses on a sample of 79 telcos, representing approximately 82% of the global market. This section allows users to select and compare up to 5 telcos across multiple metrics such as labor costs, opex, EBIT, as well as revenues, capex, and employee counts. The sample includes operators from all regions and of varying sizes.
Both new sections also feature the capability to export graphics to PDF, enhancing the flexibility and utility of the data presented.
Operator coverage:
|
|
Regional coverage:
|
|
Table of Contents
1. Report Highlights
2. Summary
3. Market snapshot
4. Analysis
5. Key stats through 4Q24
6. Labor stats
7. Operator rankings
8. Company drilldown
9. Company benchmarking
10. Country breakouts
11. Country breakouts by company
12. Regional breakouts
13. Raw Data
14. Subs & traffic
15. Exchange rates
16. Methodology & Scope
17. About
List of Figures and Charts
- 1. TNO market size & growth by: Revenues, Capex, Employees - 1Q19-4Q24
- 2. Regional trends by: Revenues, Capex - 1Q19-4Q24
- 3. Opex & Cost trends
- 4. Labor cost trends: 1Q20-4Q24
- 5. Profitability margin trends: 1Q20-4Q24
- 6. Spending (opex, labor costs, capex): annual and quarterly trend
- 7. Key ratios: annual and quarterly trend
- 8. Workforce & productivity trends: 1Q14-4Q24
- 9. Operator rankings by revenue and capex: latest single-quarter and annualized periods
- 10. Top 20 TNOs by capital intensity: latest single-quarter and annualized periods
- 11. Top 20 TNOs by employee base: latest single-quarter
- 12. TNOs: YoY growth in single quarter revenues
- 13. TNOs: Annualized capital intensity, 1Q16-4Q24
- 14. TNOs: Revenue and RPE, annualized 1Q16-4Q24
- 15. TNOs: Capex and capital intensity (annualized), 1Q16-4Q24
- 16. TNOs: Total headcount trends, 1Q16-4Q24
- 17. TNOs: Revenue and RPE trends, 2011-24
- 18. TNOs: Capex and capital intensity, 2011-24 ($ Mn)
- 19. TNOs: Capex and capital intensity, 1Q16-4Q24 ($ Mn)
- 20. TNOs: Revenue and RPE trends, 1Q16-4Q24
- 21. TNOs by total opex, 4Q24
- 22. TNOs by labor costs, 4Q24
- 23. TNOs: Software as % of total capex
- 24. TNOs: Software & spectrum spend
- 25. TNOs: Total M&A, spectrum and capex (excl. spectrum)
- 26. TNOs by total debt: 2011-24
- 27. TNOs by total net debt: 2011-24
- 28. TNOs by long term debt: 2011-24
- 29. TNOs by short term debt: 2011-24
- 30. TNOs by total cash and short term investments ($M): 2011-24
 去中心化资料收益平台市场预测(至 2032 年):按组件、资料类型、收益模型、应用、最终用户和地区进行的全球分析
 收益化平台:全球市场占有率(2024年)
 通讯业者资料收益市场按服务类型、部署模式、定价模式、客户类型和垂直产业划分-2025-2032 年全球预测
 2025 年至 2033 年资料货币化市场规模、份额、趋势及预测(依方法、组织规模、最终用途及地区划分)
 医疗保健提供者数据收益解决方案的全球市场生命科学公司数据收益解决方案的全球市场医疗数据收益市场规模、份额和趋势分析报告:按方法、组织规模、最终用途、地区和细分市场预测,2025 年至 2033 年日本数据货币化市场报告(按方法、组织规模、最终用途和地区)2025-2033资料收益市场分析及预测(至 2034 年):类型、产品、服务、技术、组件、应用、最终用户、部署、解决方案、功能
 资料货币化市场规模、份额、成长分析(按组件、资料类型、业务功能、部署类型、组织规模、垂直产业和地区)-2025 年至 2032 年产业预测