


 |
市场调查报告书
商品编码
1648562
外泌体治疗市场依治疗类型、适应症、治疗领域、给药途径和地区划分:至2035年的行业趋势和全球预测Exosome Therapy Market by Type of Therapeutic, Target Indication, Therapeutic Area, Route of Administration and Geography : Industry Trends and Global Forecasts, Till 2035 |
||||||
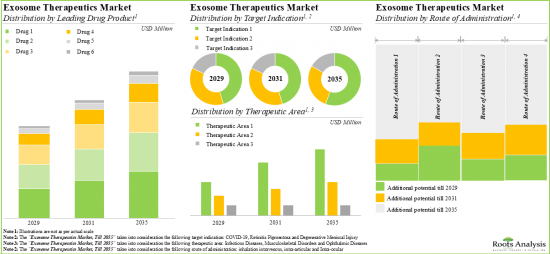
全球外泌体治疗市场规模预计将从2029年的3,000万美元成长到2040年的14亿美元,在预测期内(至2035年)的年复合成长率为 41.1%。
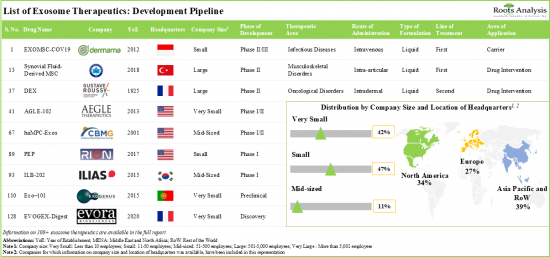
外泌体疗法由于其促进组织再生、减轻发炎和慢性疼痛、靶向特异性等多种优势近年来备受关注。多项研究证明了外泌体疗法在疾病诊断、药物传递和治疗应用方面的高效性和治疗优势。值得注意的是,目前全球有超过 120 种候选药物接受研究,用于治疗多种疾病。这表明药物开发公司该领域进行广泛的开发努力。其中超过40%处于临床开发的不同阶段。在所有候选药物中,有七种外泌体疗法目前进行后期临床开发阶段的测试,包括EXOMSC-COV19(Dermama Biotech Lab)、Dex2(Gustave Roussy Institute)和SF-MSC-EX(Osmangazi University)。
目前,大约30%的基于外泌体的治疗药物开发中,用于治疗各种癌症。这种创新方法利用外泌体作为将药物专门递送到癌细胞的手段,这些疗法仍处于研究的早期阶段。研究外泌体递送系统的主要癌症类型包括乳癌、肺癌、黑色素瘤和大肠直肠癌。考虑到该领域进行的研究和开发工作、有希望的临床试验结果以及后期外泌体疗法的推出,预计该市场将在未来十年内实现显着成长。
全球有近60家公司致力于开发外泌体疗法,市场以新创公司和小型公司为主。
评估外泌体相关治疗方法和生物标记的临床试验多个地区招募/登记超过 3,000名患者。已有超过 530 项资助用于进行的外泌体治疗研究和开发。有鑑于该产业的优势和未来潜力,各类投资者已在 30 多个案例中投资了超过 5.7亿美元。
目前,有超过 30 家新创公司推动该领域的创新,在过去几年中,这些公司已经开展了各种研发计划来开发外泌体疗法。
本报告概述了全球外泌体治疗市场,包括治疗类型、适应症、治疗领域、给药途径和地区的趋势,以及公司概况。
目录
第1章 简介
第2章 执行摘要
第3章 简介
第4章 外泌体治疗:市场现况
第5章 外泌体治疗开发公司:公司简介
- Codiak BioSciences
- Coya Therapeutics
- Curexsys
- EV Therapeutics
- Evox Therapeutics
- SHIFTBIO
第6章 外泌体治疗:药物概况
- AEGLE Therapeutics
- AVEM Healthcare
- Cellular Biomedicine Group
- OBCTCD24
- ReNeuron
- Stem Cell Medicine
第7章 临床试验分析
第8章 学术资助分析
第9章 世界事件分析
第10章 伙伴关係与协作
第11章 融资与投资分析
第12章 新创企业健康指标
第13章 案例研究:外泌体开发与製造服务提供者
第14章 药物失败分析
第15章 市场规模与机会分析
第16章 高阶主管洞察
- Capricor Therapeutics
- Exogenus Therapeutics
- ILIAS Biologics
第17章 附录1:表格资料
第18章 附录2:公司与组织名单
EXOSOME THERAPY MARKET: OVERVIEW
As per Roots Analysis, the global exosome therapy is estimated to grow from USD 0.03 billion in 2029 to USD 1.4 billion by 2040, at a CAGR of 41.1% during the forecast period, till 2035.
The market sizing and opportunity analysis has been segmented across the following parameters:
Type of Exosome Therapeutics
- Allogenic
- Autologous
Target Disease Indications
- Degenerative Meniscal Injury
- Dystrophic Epidermolysis Bullosa
- Fistula Perianal
- Retinitis Pigmentosa
Therapeutic Area
- Dermatological Disorders
- Musculoskeletal Disorders
- Ophthalmic Disorders
- Rectal Disorders
Route of Administration
- Fistula Tract
- Intra-articular
- Intra-ocular
Key Geographical Regions
- North America
- Europe
- Asia-Pacific
- Rest of the World
EXOSOME THERAPY MARKET: GROWTH AND TRENDS
Owing to the various benefits, such as enhanced tissue regeneration, reduced inflammation and chronic pain, and target specificity, exosome therapies have garnered significant attention in the recent past. Various studies have demonstrated the high efficacy and therapeutic superiority of exosome therapeutics in disease diagnosis, drug delivery and therapeutic applications. It is worth highlighting that over 120 therapeutic candidates are currently being investigated for treating myriads of disease indications, across the globe. This depicts the extensive development efforts being undertaken by drug developers in this domain. More than 40% of the total number of drugs are in various phases of clinical development. Of the total candidates, seven exosome therapies, including EXOMSC-COV19 (Dermama Biotech Lab), Dex2 (Gustave Roussy Institute), SF-MSC-EX (Osmangazi University), are currently being tested in the advanced clinical stages of development.
At present, around 30% of exosome-based therapeutics are under development for the treatment of various cancers. This innovative approach uses exosomes as a means to deliver drugs specifically to cancer cells, and these therapies are still in the early phases of research. Notable types of cancer being investigated for exosome delivery systems include breast cancer, lung cancer, melanoma, and colon cancer. Considering the ongoing R&D efforts in this domain, promising clinical trial results and anticipated launch of late-stage exosome therapies, the market is anticipated to witness notable growth over the next decade.
EXOSOME THERAPY MARKET: KEY INSIGHTS
The report delves into the current state of the exosome therapy market and identifies potential growth opportunities within the industry. Some key findings from the report include:
- Close to 60 players, worldwide, have taken initiatives to develop exosome therapeutics; the market is characterized by the presence of start-ups and small companies.
- The current pipeline features more than 120 exosome therapeutics that are being evaluated across different phases of development; most of these are designed for intravenous administration.
- 3,000+ patients have been recruited / enrolled in clinical trials evaluating exosome related therapies and biomarkers across different geographies.
- More than 530 grants have been awarded for the ongoing R&D efforts for exosome therapeutics; the University of California has been awarded the maximum grant amount of USD 21 million.
- A variety of investors, having realized the benefits and future opportunities in this field, have invested more than USD 570 million across more than 30 instances.
- The rising interest of stakeholders in exosome therapeutics is also reflected by the increasing number of partnerships established by various industry and non-industry players.
- Stakeholders have participated in various global events to discuss the research outcomes, and affiliated challenges as well as opportunities existing in this domain.
- At present, more than 30 start-ups are driving innovation in this domain; a variety of R&D initiatives have been undertaken by these players over the last few years for the development of exosome therapeutics.
- Lack of efficacy, the COVID-19 pandemic, limited patient enrollment, and scarce funding are among the key reasons that have led to the discontinuation of studies sponsored by various industry and non-industry players.
- With the rising demand for therapeutic advances in drug safety, the market for exosome therapeutics is expected to grow at an annualized rate of 41.1% between 2029-2040.
EXOSOME THERAPY MARKET: KEY SEGMENTS
Autologous Therapies are Likely to Capture Largest Share of the Exosome Therapy Market
Based on the type of therapy, the market is segmented into allogenic therapy and autologous therapy. It is anticipated that the autologous therapy segment will hold the maximum share of the exosome therapy market in 2029. However, it is worth highlighting that allogeneic therapy is likely to grow at a relatively higher CAGR.
Retinitis Pigmentosa is Likely to be the Fastest Growing Segment of the Exosome Therapy Market During the Forecast Period
Based on the target disease indication, the market is segmented into degenerative meniscal injury, dystrophic epidermolysis bullosa, fistula perianal and retinitis pigmentosa. It is anticipated that fistula perianal will hold the maximum share of the exosome therapy market in 2029. However, it is worth highlighting that the exosome therapy market for retinitis pigmentosa is likely to grow at a relatively higher CAGR.
Rectal Disorders Segment is the Fastest Growing Segment of the Exosome Therapy Market
Based on the therapeutic area, the market is segmented into dermatological disorders, musculoskeletal disorders, ophthalmic disorders and rectal disorders. While the rectal disorders segment is likely to hold a relatively higher market share, it is worth highlighting that the ophthalmic diseases segment is expected to witness substantial market growth in the coming years.
Fistula Tract Segment is Likely to Capture Largest Share of the Exosome Therapy Market in 2029
Based on the route of administration, the market is segmented into fistula tract, intra-articular and intra-ocular. It is anticipated that the fistula tract segment will hold the maximum share of the exosome therapy market in 2029. However, it is worth highlighting that the intraocular segment is likely to grow at a relatively higher CAGR.
Asia-Pacific Accounts for the Largest Share of the Market
Based on key geographical regions, the market is segmented into North America, Europe, Asia-Pacific and the Rest of the World. The majority share is expected to be captured by drug developers based in Asia-Pacific. It is worth highlighting that, over the years, the market in Europe is expected to grow at a higher CAGR.
Example Players in the Exosome Therapy Market
- Coya Therapeutics
- Evox Therapeutics
- Curexsys
- EV Therapeutics
- SHIFTBIO
Primary Research Overview
The opinions and insights presented in this study were influenced by discussions conducted with multiple stakeholders. The research report features detailed transcripts of interviews held with the following industry stakeholders:
- Chief Business Officer, Capricor Therapeutics
- R&D and Innovation Manager, Exogenus Therapeutics
- Chief Business Officer, ILIAS Biologics
EXOSOME THERAPY MARKET: RESEARCH COVERAGE
- Market Sizing and Opportunity Analysis: The report features an in-depth analysis of the exosome therapy market, focusing on key market segments, including [A] type of therapy, [B] target disease indications, [C] therapeutic area, [D] route of administration and [E] key geographical regions.
- Market Landscape: A comprehensive evaluation of exosome therapeutics, considering various parameters, such as [A] phase of development, [B] technology platform, [C] type of payload, [D] target disease indication (s), [E] therapeutic area, [F] biological target, [G] route of administration, [H] type of therapy, [I] combination drug, [J] line of treatment and [K] dosing frequency. Further, it includes details on the exosome therapeutic developers, along with information on their [L] year of establishment, [M] company size and [N] location of headquarters.
- Company Profiles: In-depth profiles of key industry players engaged in the development of exosome therapeutics, focusing on [A] company overviews, [B] financial information (if available), [C] product portfolio, [E] recent developments and [F] an informed future outlook.
- Drug Profiles: In-depth profiles of key exosome therapies, focusing on [A] product portfolio and [B] clinical trial information.
- Clinical Trials Analysis: Examination of completed, ongoing, and planned clinical studies of various exosome therapeutics, based on parameters like [A] trial status, [B] trial registration year, [C] type of sponsor / collaborator, [D] study design, [E] number of patients enrolled, [F] year-wise trend of completed and recruiting trials, [G] age group of the patients enrolled, [H] active industry and non-industry players and [I] location of the trials.
- Academic Grant Analysis: A comprehensive examination of various academic grants that have been awarded to various research institutes for projects related to exosome therapeutics, based on several parameters, such as [A] year of grant awarded, [B] amount awarded, [C] type of funding institute center, [D] popular NIH departments, [E] support period, [F] emerging focus area, [G] purpose of grants, [H] grant activity code, [I] local recipients, [J] type of recipient organization study section, [K] type of grant application and [L] popular recipient organizations, (in terms of number of grants and amount awarded).
- Global Event Analysis: An in-depth analysis of the global events attended by the exosome therapy developers, based on several relevant parameters, such as [A] year of event, [B] type of event platform, [C] location of event, [D] emerging focus areas, [E] active organizers (in terms of number of events), [F] active industry and non-industry participants, [G] designation of participants, [H] affiliated department of participants, and [I] active speakers (in terms of number of events).
- Partnerships and Collaborations: An analysis of partnerships established in this sector, since 2017, covering research agreements, licensing agreements, manufacturing agreements, product development and commercialization agreements, mergers / acquisitions, and other relevant deals.
- Funding and Investment Analysis: A detailed evaluation of the investments made in this domain, encompassing seed financing, venture capital financing, IPOs, secondary offering, debt financing and other equity.
- Start-Up Health Indexing: An analysis of start-ups / small companies engaged in the development of exosome therapeutics, based on parameters, such as [A] pipeline strength, [B] pipeline maturity, [C] financial support, [D] number of investors, [E] partnership activity and [F] start-up health indexing.
- Case Study: A case study highlighting the companies offering development and manufacturing services for exosome therapeutics, along with the information on their [A] year of establishment, [B] company size, [C] location of headquarters, [D] types of service(s) offered, [E] method of isolation, [F] method of purification, [G] method of characterization, [H] method of exosome manufacturing, [I] scale of operation and [J] scalability.
- Drug Failure Analysis: An in-depth analysis, focusing on exosome therapeutics that failed to progress to later stages of clinical development, based on various relevant parameters, such as [A] trial status of discontinuation, [B] target disease indication(s), [C] route of administration and [D] type of sponsor.
KEY QUESTIONS ANSWERED IN THIS REPORT
- How many companies are currently engaged in this market?
- Which are the leading companies in this market?
- What kind of partnership models are commonly adopted by industry stakeholders?
- What factors are likely to influence the evolution of this market?
- What is the current and future market size?
- What is the CAGR of this market?
- How is the current and future market opportunity likely to be distributed across key market segments?
REASONS TO BUY THIS REPORT
- The report provides a comprehensive market analysis, offering detailed revenue projections of the overall market and its specific sub-segments. This information is valuable to both established market leaders and emerging entrants.
- Stakeholders can leverage the report to gain a deeper understanding of the competitive dynamics within the market. By analyzing the competitive landscape, businesses can make informed decisions to optimize their market positioning and develop effective go-to-market strategies.
- The report offers stakeholders a comprehensive overview of the market, including key drivers, barriers, opportunities, and challenges. This information empowers stakeholders to stay abreast of market trends and make data-driven decisions to capitalize on growth prospects.
ADDITIONAL BENEFITS
- Complimentary PPT Insights Packs
- Complimentary Excel Data Packs for all Analytical Modules in the Report
- 10% Free Content Customization
- Detailed Report Walkthrough Session with Research Team
- Free Updated report if the report is 6-12 months old or older
TABLE OF CONTENTS
1. PREFACE
- 1.1. Scope of the Report
- 1.2. Market Segmentation
- 1.3. Research Methodology
- 1.4. Key Questions Answered
- 1.5. Chapter Outlines
2. EXECUTIVE SUMMARY
3. INTRODUCTION
- 3.1. Overview of Exosomes
- 3.1.1. Types of Extracellular Vesicles
- 3.1.2. Potential Sources of Exosomes
- 3.2. Exosome Biogenesis
- 3.2.1. Exosome Formation and Development Process
- 3.2.2. Secretion of Exosomes
- 3.3. Applications of Exosomes
- 3.4. Mechanism of Exosome Therapy
- 3.4.1. Exosome Drug Therapy
- 3.4.2. Exosome RNAi Therapy
- 3.4.3. Exosome Immunotherapy
- 3.5. Advantages of Exosome Therapies
- 3.6. Risks and Future Perspectives Associated with Exosome Therapeutics
4. EXOSOME THERAPEUTICS: MARKET LANDSCAPE
- 4.1. Analysis Methodology and Key Parameters
- 4.2. Exosome Therapeutics Market Landscape
- 4.2.1. Analysis by Phase of Development
- 4.2.2. Analysis by Technology Platform
- 4.2.3. Analysis by Type of Payload
- 4.2.4. Analysis by Type of Formulation
- 4.2.5. Analysis by Type of Therapy
- 4.2.6. Analysis by Derived Source
- 4.2.7. Analysis by Target Disease Indication(s)
- 4.2.8. Analysis by Therapeutic Area
- 4.2.9. Analysis by Phase of Development and Therapeutic Area
- 4.2.10. Analysis by Route of Administration
- 4.2.11. Analysis by Therapeutic Area and Route of Administration
- 4.2.12. Analysis by Type of Therapy (By Method of Composition)
- 4.2.13. Analysis by Line of Treatment
- 4.2.14. Analysis by Dosing Frequency
- 4.3. Exosome Therapeutics Developers
- 4.3.1. Analysis by Year of Establishment
- 4.3.2. Analysis by Company Size
- 4.3.3. Analysis by Location of Headquarters
- 4.3.4. Most Active Players: Analysis by Number of Therapeutics
5. EXOSOME THERAPEUTICS DEVELOPERS: COMPANY PROFILES
- 5.1. Codiak BioSciences
- 5.1.1. Company Overview
- 5.1.2. Product Portfolio
- 5.1.3. Clinical Trial Information
- 5.1.4. Recent Developments and Future Outlook
- 5.2. Coya Therapeutics
- 5.2.1. Company Overview
- 5.2.2. Product Portfolio
- 5.2.3. Recent Developments and Future Outlook
- 5.3. Curexsys
- 5.3.1. Company Overview
- 5.3.2. Product Portfolio
- 5.3.3. Recent Developments and Future Outlook
- 5.4. EV Therapeutics
- 5.4.1. Company Overview
- 5.4.2. Product Portfolio
- 5.4.3. Recent Developments and Future Outlook
- 5.5. Evox Therapeutics
- 5.5.1. Company Overview
- 5.5.2. Product Portfolio
- 5.5.3. Recent Developments and Future Outlook
- 5.6. SHIFTBIO
- 5.6.1. Company Overview
- 5.6.2. Product Portfolio
- 5.6.3. Recent Developments and Future Outlook
6. EXOSOME THERAPEUTICS: DRUG PROFILES
- 6.1. AEGLE Therapeutics
- 6.1.1. Company Overview
- 6.1.2. AGLE-102: Product Portfolio
- 6.1.2.1. AGLE-102: Clinical Trial Information
- 6.1.3. Recent Developments and Future Outlook
- 6.2. AVEM Healthcare
- 6.2.1. Company Overview
- 6.2.2. Ardoxso: Product Portfolio
- 6.2.2.1. Ardoxso: Clinical Trial Information
- 6.2.3. Recent Developments and Future Outlook
- 6.3. Cellular Biomedicine Group
- 6.3.1. Company Overview
- 6.3.2. Financial Information
- 6.3.3. haMPC-Exos: Product Portfolio
- 6.3.3.1. haMPC-Exos: Clinical Trial Information
- 6.3.4. hMSC-Exos: Product Portfolio
- 6.3.4.1. hMSC-Exos: Clinical Trial Information
- 6.3.5. Undisclosed Drug 1: Product Portfolio
- 6.3.5.1. Undisclosed Drug 1: Clinical Trial Information
- 6.3.6. Recent Developments and Future Outlook
- 6.4. OBCTCD24
- 6.4.1. Company Overview
- 6.4.2. CovenD24: Product Portfolio
- 6.4.2.1. CovenD24: Clinical Trial Information
- 6.4.3. Recent Developments and Future Outlook
- 6.5. ReNeuron
- 6.5.1. Company Overview
- 6.5.2. Financial Information
- 6.5.3. Undisclosed Drug 1: Product Portfolio
- 6.5.3.1. Undisclosed Drug 1: Clinical Trial Information
- 6.5.4. Recent Developments and Future Outlook
- 6.6. Stem Cell Medicine
- 6.6.1. Company Overview
- 6.6.2. Undisclosed Drug 1: Product Portfolio
- 6.6.3. Recent Developments and Future Outlook
7. CLINICAL TRIAL ANALYSIS
- 7.1. Analysis Methodology and Key Parameters
- 7.2. Exosome Therapeutics: List of Clinical Trials
- 7.2.1. Analysis by Trial Status
- 7.2.2. Analysis by Trial Registration Year
- 7.2.3. Analysis by Type of Sponsor / Collaborator
- 7.2.4. Analysis by Registration Year and Type of Study
- 7.2.5. Analysis by Registration Year and Status of Trial
- 7.2.6. Analysis by Study Design
- 7.2.7. Analysis by Patient Enrollment
- 7.2.8. Year-wise Trend of Completed and Recruiting Trials
- 7.2.9. Analysis by Age Category
- 7.2.10. Analysis by Phase of Development and Trial Status
- 7.2.11. Analysis by Phase of Development and Patient Enrollment
- 7.2.12. Most Active Industry Players: Analysis by Number of Registered Trials
- 7.2.13. Most Active Non-Industry Players: Analysis by Number of Registered Trials
- 7.2.14. Analysis by Trial Location
- 7.2.15. Analysis by Trial Status and Geography
8. ACADEMIC GRANT ANALYSIS
- 8.1. Analysis Methodology and Key Parameters
- 8.2. Exosome Therapeutics: List of Academic Grants
- 8.3. Analysis by Year of Grants Awarded
- 8.4. Analysis by Amount Awarded
- 8.5. Popular NIH Departments: Analysis by Number of Grants
- 8.6. Analysis by Type of Funding Institute Center
- 8.7. Analysis by Support Period
- 8.8. Analysis by Purpose of Grants
- 8.9. Word Cloud Analysis: Emerging Focus Area
- 8.10. Analysis by Grant Activity Code
- 8.11. Analysis by Local Recipients
- 8.12. Analysis by Type of Recipient Organization
- 8.13. Popular Recipient Organizations: Analysis by Amount Awarded
- 8.14. Popular Recipient Organizations: Analysis by Number of Grants
- 8.15. Analysis by Study Section Involved
- 8.16. Analysis by Type of Grant Application
- 8.17. Analysis by Funding Institute Center and Support Year
9. GLOBAL EVENT ANALYSIS
- 9.1. Chapter Overview
- 9.2. Scope and Methodology
- 9.3. List of Global Events Related to Exosomes
- 9.3.1. Analysis by Year of Event
- 9.3.2. Analysis by Event Platform
- 9.3.3. Analysis by Type of Event
- 9.3.4. Analysis by Location of Event
- 9.3.5. Word Cloud Analysis: Evolutionary Trends in Event Agenda / Key Focus Area
- 9.3.6. Most Active Organizers: Analysis by Number of Events
- 9.3.7. Most Active Industry Participants: Analysis by Number of Events
- 9.3.8. Most Active Non-Industry Participants: Analysis by Number of Events
- 9.3.9. Analysis by Designation of Participant
- 9.3.10. Analysis by Affiliated Department of Participant
- 9.3.11. Most Active Speakers: Analysis by Number of Events
10. PARTNERSHIPS AND COLLABORATIONS
- 10.1. Chapter Overview
- 10.2. Partnership Models
- 10.3. Exosome Therapeutics: List of Partnerships and Collaborations
- 10.3.1. Analysis by Year of Partnership
- 10.3.2. Analysis by Type of Partnership
- 10.3.3. Analysis by Year and Type of Partnership
- 10.3.4. Analysis by Company and Type of Partnership
- 10.3.5. Analysis by Type of Technology Platform
- 10.3.6. Analysis by Type of Partner
- 10.3.7. Word Cloud Analysis: Emerging Focus Areas
- 10.3.8. Analysis by Target Disease Indication(s)
- 10.3.9. Analysis by Therapeutic Area
- 10.3.10. Analysis by Therapeutic Area and Type of Partnership
- 10.3.11. Most Active Players: Analysis by Number of Partnerships
- 10.3.12. Regional Analysis
- 10.3.13. Intercontinental and Intracontinental Agreements
11. FUNDING AND INVESTMENT ANALYSIS
- 11.1. Analysis Methodology and Key Parameters
- 11.2. Type of Funding
- 11.3. Exosome Therapeutics: List of Funding Instances
- 11.4. Analysis by Year of Funding
- 11.5. Analysis by Amount Invested
- 11.6. Analysis by Type of Funding
- 11.7. Analysis by Type of Funding and Amount Invested
- 11.8. Analysis by Year, Type of Funding and Amount Invested
- 11.9. Analysis by Purpose of Funding
- 11.10. Analysis by Target Disease Indication(s)
- 11.11. Analysis by Therapeutic Area
- 11.12. Most Active Players: Analysis by Number of Funding Instances
- 11.13. Most Active Players: Analysis by Amount Invested
- 11.14. Key Investors: Analysis by Number of Funding Instances
- 11.15. Regional Analysis
- 11.16. Summary of Funding Instances
12. START-UP HEALTH INDEXING
- 12.1. Analysis Methodology and Key Parameters
- 12.2. Analysis by Pipeline Maturity
- 12.3. Analysis by Pipeline Strength
- 12.4. Analysis by Financial Support
- 12.5. Analysis by Number of Investors
- 12.6. Analysis by Partnership Activity
- 12.7. Start-up Health Indexing: Roots Analysis Perspective
13. CASE STUDY: EXOSOME DEVELOPMENT AND MANUFACTURING SERVICE PROVIDERS
- 13.1. Chapter Overview
- 13.2. Exosome Development and Manufacturing Service Providers Landscape
- 13.2.1. Analysis by Year of Establishment
- 13.2.2. Analysis by Company Size
- 13.2.3. Analysis by Location of Headquarters
- 13.2.4. Analysis by Location of Headquarters and Company Size
- 13.3. Analysis by Type of Service(s) Offered
- 13.3.1. Analysis by Method of Isolation
- 13.3.2. Analysis by Method of Purification
- 13.3.3. Analysis by Method of Characterization
- 13.3.4. Analysis by Method of Exosome Manufacturing
- 13.3.5. Analysis by Scale of Operation
- 13.3.6. Analysis by Scalability
14. DRUG FAILURE ANALYSIS
- 14.1. Methodology and Key Parameters
- 14.2. Exosome Therapeutics: List of Failed Drug Candidates
- 14.2.1. Analysis by Study Start Year and Year of Termination of the Clinical Trials
- 14.2.2. Analysis by Trial Status of Discontinuation
- 14.2.3. Analysis by Target Disease Indication(s)
- 14.2.4. Analysis by Route of Administration
- 14.2.5. Analysis by Type of Sponsor
- 14.2.6. Analysis by Reasons for Drug Failure
- 14.2.7. Word Cloud Analysis: Emerging Focus Area
15. MARKET SIZING AND OPPORTUNITY ANALYSIS
- 15.1. Forecast Methodology and Key Assumptions
- 15.2. Global Exosome Therapeutics Market, 2029-2040
- 15.3. Global Exosome Therapeutics Market, 2029-2040: Distribution by Target Disease Indication(s)
- 15.3.1. Exosome Therapeutics Market for COVID-19, 2029-2040
- 15.3.2. Exosome Therapeutics Market for Degenerative Meniscal Injury, 2029-2040
- 15.3.3. Exosome Therapeutics Market for Retinitis Pigmentosa, 2029-2040
- 15.4. Global Exosome Therapeutics Market, 2029-2040: Distribution by Therapeutic Area
- 15.4.1. Exosome Therapeutics Market for Infectious Diseases, 2029-2040
- 15.4.2. Exosome Therapeutics Market for Ophthalmic Diseases, 2029-2040
- 15.4.3. Exosome Therapeutics Market for Musculoskeletal Disorders, 2029-2040
- 15.5. Global Exosome Therapeutics Market, 2029-2040: Distribution by Route of Administration
- 15.5.1. Intravenous Exosome Therapeutics Market, 2029-2040
- 15.5.2. Intra-ocular Exosome Therapeutics Market, 2029-2040
- 15.5.3. Intra-articular Exosome Therapeutics Market, 2029-2040
- 15.5.4. Inhalation Exosome Therapeutics Market, 2029-2040
- 15.6. Global Exosome Therapeutics Market, 2029-2040: Distribution by Type of Formulation
- 15.6.1. Exosome Therapeutics Market for Liquid Formulations, 2029-2040
- 15.6.2. Exosome Therapeutics Market for Aerosol Formulations, 2029-2040
- 15.7. Global Exosome Therapeutics Market, 2029-2040: Distribution by Geography
- 15.7.1. Exosome Therapeutics Market in North America, 2029-2040
- 15.7.2. Exosome Therapeutics Market in Europe, 2029-2040
- 15.7.3. Exosome Therapeutics Market in Asia Pacific, 2030-2040
- 15.8. Attractiveness and Competitiveness Matrix
16. EXECUTIVE INSIGHTS
- 16.1. Capricor Therapeutics
- 16.1.1. Company Snapshot
- 16.1.2. Interview Transcript: Chief Business Officer
- 16.2. Exogenus Therapeutics
- 16.2.1. Company Snapshot
- 16.2.2. Interview Transcript: R&D and Innovation Manager
- 16.3. ILIAS Biologics
- 16.3.1. Company Snapshot
- 16.3.2. Interview Transcript: Chief Business Officer
17. APPENDIX 1: TABULATED DATA
18. APPENDIX 2: LIST OF COMPANIES AND ORGANIZATIONS
List of Tables
- Table 4.1 Exosome Therapeutics: Development Pipeline
- Table 4.2 Exosome Therapeutics: List of Developers
- Table 5.1 Codiak BioSciences: Product Portfolio
- Table 5.2 Codiak BioSciences: Clinical Trial Information
- Table 5.3 Recent Developments and Future Outlook
- Table 5.4 Coya Therapeutics: Product Portfolio
- Table 5.5 Recent Developments and Future Outlook
- Table 5.6 Curexsys: Product Portfolio
- Table 5.7 Recent Developments and Future Outlook
- Table 5.8 EV Therapeutics: Product Portfolio
- Table 5.9 Recent Developments and Future Outlook
- Table 5.10 Evox Therapeutics: Product Portfolio
- Table 5.11 Recent Developments and Future Outlook
- Table 5.12 SHIFTBIO: Product Portfolio
- Table 5.13 Recent Developments and Future Outlook
- Table 6.1 AGLE-102: Product Portfolio
- Table 6.2 AGLE-102: Clinical Trial Information
- Table 6.3 Ardoxso: Product Portfolio
- Table 6.4 Ardoxso: Clinical Trial Information
- Table 6.5 Recent Developments and Future Outlook
- Table 6.6 haMPC-Exos: Product Portfolio
- Table 6.7 haMPC-Exos: Clinical Trial Information
- Table 6.8 hMSC-Exos: Product Portfolio
- Table 6.9 hMSC-Exos: Clinical Trial Information
- Table 6.10 Undisclosed Drug 1: Product Portfolio
- Table 6.11 Undisclosed Drug 1: Clinical Trial Information
- Table 6.12 Recent Developments and Future Outlook
- Table 6.13 CovenD24: Product Portfolio
- Table 6.14 CovenD24: Clinical Trial Information
- Table 6.15 Undisclosed Drug 1: Product Portfolio
- Table 6.16 Undisclosed Drug 1: Clinical Trial Information
- Table 6.17 Recent Developments and Future Outlook
- Table 6.18 Undisclosed Drug 1: Product Portfolio
- Table 7.1 Exosome Therapeutics: List of Clinical Trials, since 2017
- Table 8.1 Exosome Therapeutics: List of Grants Awarded
- Table 9.1 Exosome Therapeutics: List of Global Events, since 2017
- Table 10.1 Exosome Therapeutics: List of Partnerships and Collaborations, since 2017
- Table 11.1 Exosome Therapeutics: List of Funding and Investment, since 2017
- Table 12.1 Exosome Therapeutics: List of Start-Ups, since 2017
- Table 13.1 Case Study: List of Exosome Service Providers
- Table 17.1 Exosome Therapeutics Market: Distribution by Phase of Development
- Table 17.2 Exosome Therapeutics Market: Distribution by Technology Platform
- Table 17.3 Exosome Therapeutics Market: Distribution by Type of Payload
- Table 17.4 Exosome Therapeutics Market: Distribution by Type of Formulation
- Table 17.5 Exosome Therapeutics Market: Distribution by Type of Therapy
- Table 17.6 Exosome Therapeutics Market: Distribution by Derived Source
- Table 17.7 Exosome Therapeutics Market: Distribution by Target Disease Indication(s)
- Table 17.8 Exosome Therapeutics Market: Distribution by Therapeutic Area
- Table 17.9 Exosome Therapeutics Market: Distribution by Phase of Development and
- Table 17.10 Exosome Therapeutics Market: Distribution by Route of Administration
- Table 17.11 Exosome Therapeutics: Distribution by Therapeutic Area and Route of Administration
- Table 17.12 Exosome Therapeutics Market: Distribution by Type of Therapy (By method of composition)
- Table 17.13 Exosome Therapeutics Market: Distribution by Line of Treatment
- Table 17.14 Exosome Therapeutics Market: Distribution by Dosing Frequency
- Table 17.15 Exosome Therapeutics Developers: Distribution by Year of Establishment
- Table 17.16 Exosome Therapeutics Developers: Distribution by Company Size
- Table 17.17 Exosome Therapeutics Developers: Distribution by Location of Headquarters
- Table 17.18 Most Active Players: Distribution by Number of Exosome Therapeutics
- Table 17.19 Cellular Biomedicine Group: Financial Information, FY 2015 Onwards (USD Million)
- Table 17.20 ReNeuron: Financial Information, FY 2018 Onwards (USD Million)
- Table 17.21 Clinical Trials Analysis: Distribution by Trial Status
- Table 17.22 Clinical Trials Analysis: Year-wise Distribution by Trial Registration Year
- Table 17.23 Clinical Trials Analysis: Distribution by Type of Sponsor / Collaborator
- Table 17.24 Clinical Trials Analysis: Year-wise Distribution by Registration Year and Type of Study
- Table 17.25 Clinical Trials Analysis: Year-wise Distribution by Registration Year and Status of Trial
- Table 17.26 Clinical Trials Analysis: Distribution by Study Design
- Table 17.27 Clinical Trials Analysis: Distribution by Patient Enrollment
- Table 17.28 Clinical Trials Analysis: Year-wise Trend of Completed and Recruiting Trials
- Table 17.29 Clinical Trials Analysis: Distribution by Age Category
- Table 17.30 Clinical Trials Analysis: Distribution by Phase of Development and Trial Status
- Table 17.31 Clinical Trials Analysis: Distribution by Phase of Development and Patient Enrollment
- Table 17.32 Most Active Industry Players: Distribution by Number of Registered Trials
- Table 17.33 Most Active Non-Industry Players: Distribution by Number of Registered Trials
- Table 17.34 Clinical Trials Analysis: Distribution by Trial Location
- Table 17.35 Clinical Trials Analysis: Distribution by Trial Status and Geography
- Table 17.36 Academic Grant Analysis: Year-wise Distribution of Number of Grants
- Table 17.37 Academic Grant Analysis: Year-wise Distribution by Amount of Grant Awarded (USD Million)
- Table 17.38 Academic Grant Analysis: Popular NIH Departments: Analysis by Number of Grants
- Table 17.39 Academic Grant Analysis: Analysis by Type of Funding Institute Center
- Table 17.40 Academic Grant Analysis: Distribution by Support Period
- Table 17.41 Academic Grant Analysis: Distribution by Purpose of Grants
- Table 17.42 Academic Grant Analysis: Distribution by Grant Activity Code
- Table 17.43 Academic Grant Analysis: Distribution by Local Recipients
- Table 17.44 Academic Grant Analysis: Distribution by Type of Recipient Organization
- Table 17.45 Academic Grant Analysis: Popular Recipient Organizations: Analysis by Amount Awarded (USD Million)
- Table 17.46 Academic Grant Analysis: Popular Recipient Organizations: Analysis by Number of Grants
- Table 17.47 Academic Grant Analysis: Distribution by Study Section
- Table 17.48 Academic Grant Analysis: Distribution by Type of Grant Application
- Table 17.49 Academic Grant Analysis: Analysis by Funding Institute Center and Support Year
- Table 17.50 Global Events: Cumulative Half Yearly Trend, since 2017
- Table 17.51 Global Events: Distribution by Event Platform
- Table 17.52 Global Events: Distribution by Type of Event
- Table 17.53 Global Events: Distribution by Location of Event
- Table 17.54 Most Active Organizers: Distribution by Number of Events
- Table 17.55 Most Active Industry Participants: Distribution by Number of Events
- Table 17.56 Most Active Non-Industry Participants: Distribution by Number of Events
- Table 17.57 Global Events: Distribution by Designation of Participant
- Table 17.58 Global Events: Distribution by Affiliated Department of Participant
- Table 17.59 Most Active Speakers: Distribution by Number of Events
- Table 17.60 Partnerships and Collaborations: Cumulative Year-wise Trend, since 2017
- Table 17.61 Partnerships and Collaborations: Distribution by Type of Partnership
- Table 17.62 Partnerships and Collaborations: Year-wise Distribution by Year and Type of Partnership, since 2017
- Table 17.63 Partnerships and Collaborations: Year-wise Distribution by Company and Type of Partnership, since 2017
- Table 17.64 Partnerships and Collaborations: Distribution by Type of Technology Platform
- Table 17.65 Partnerships and Collaborations: Distribution by Type of Partner
- Table 17.66 Partnerships and Collaborations: Distribution by Target Disease Indication(s)
- Table 17.67 Partnerships and Collaborations: Distribution by Therapeutic Area
- Table 17.68 Partnerships and Collaborations: Distribution by Therapeutic Area and Type of Partnership
- Table 17.69 Most Active Players: Distribution by Number of Partnerships
- Table 17.70 Partnerships and Collaborations: Regional Distribution
- Table 17.71 Partnerships and Collaborations: Intercontinental and Intracontinental Agreements
- Table 17.72 Funding and Investments: Year-wise Distribution by Year of Funding, since 2017
- Table 17.73 Funding and Investments: Year-wise Distribution by Amount Invested, since 2017
- Table 17.74 Funding and Investments: Distribution by Type of Funding
- Table 17.75 Funding and Investments: Year-wise Distribution by Type of Funding and Amount Invested, since 2017
- Table 17.76 Funding and Investments: Year-wise Distribution by Year, Type of Funding and Amount Invested, since 2017
- Table 17.77 Funding and Investments: Distribution by Purpose of Funding
- Table 17.78 Funding and Investments: Distribution by Target Disease Indication(s)
- Table 17.79 Funding and Investments: Distribution by Therapeutic Area
- Table 17.80 Most Active Players: Distribution by Number of Funding Instances
- Table 17.81 Most Active Players: Distribution by Amount Invested (USD Million)
- Table 17.82 Key Investors: Distribution by Number of Funding Instances
- Table 17.83 Funding and Investments: Regional Distribution of Instances
- Table 17.84 Start-up Health Indexing: Distribution by Pipeline Maturity
- Table 17.85 Start-up Health Indexing: Distribution by Pipeline Strength
- Table 17.86 Start-up Health Indexing: Distribution by Financial Support
- Table 17.87 Start-up Health Indexing: Distribution by Partnership Activity
- Table 17.88 Case Study: Distribution of Exosome Service Providers by Year of Establishment
- Table 17.89 Case Study: Distribution of Exosome Service Providers by Company Size
- Table 17.90 Case Study: Distribution of Exosome Service Providers by Location of Headquarters
- Table 17.91 Case Study: Distribution of Exosome Service Providers by Location of Headquarters and Company Size
- Table 17.92 Case Study: Distribution of Exosome Service Providers by Type of Service(s) Offered
- Table 17.93 Case Study: Distribution of Exosome Service Providers by Method(s) of Isolation
- Table 17.94 Case Study: Distribution of Exosome Service Providers by Method(s) of Purification
- Table 17.95 Case Study: Distribution of Exosome Service Providers by Method(s) of Characterization
- Table 17.96 Case Study: Distribution of Exosome Service Providers by Method(s) of Exosome Manufacturing
- Table 17.97 Case Study: Distribution of Exosome Service Providers by Scale of Operation
- Table 17.98 Case Study: Distribution of Exosome Service Providers by Scalability
- Table 17.99 Drug Failure Analysis: Distribution by Study Start Year and Year of Termination of the Clinical Trials
- Table 17.100 Drug Failure Analysis: Distribution by Trial Status of Discontinuation
- Table 17.101 Drug Failure Analysis: Distribution by Target Disease Indication(s)
- Table 17.102 Drug Failure Analysis: Distribution by Route of Administration
- Table 17.103 Drug Failure Analysis: Distribution by Type of Sponsor
- Table 17.104 Drug Failure Analysis: Distribution by Reasons for Drug Failure
- Table 17.105 Drug Failure Analysis: Other Plausible Reasons for Drug Failure
- Table 17.106 Global Exosome Therapeutics Market, 2029 and 2035: Distribution by Therapeutic Area (USD Million)
- Table 17.107 Exosome Therapeutics Market for Infectious Diseases, 2029-2040 (USD Million)
- Table 17.108 Exosome Therapeutics Market for Musculoskeletal Disorders, 2029-2040 (USD Million)
- Table 17.109 Exosome Therapeutics Market for Ophthalmic Diseases, 2033-2040 (USD Million)
- Table 17.110 Global Exosome Therapeutics Market, 2029 and 2035: Distribution by Route of Administration
- Table 17.111 Inhalation Exosome Therapeutics Market, 2029-2040 (USD Million)
- Table 17.112 Intravenous Exosome Therapeutics Market, 2031-2040 (USD Million)
- Table 17.113 Intra-articular Exosome Therapeutics Market, 2033-2040 (USD Million)
- Table 17.114 Intra-ocular Exosome Therapeutics Market, 2029-2040 (USD Million)
- Table 17.115 Global Exosome Therapeutics Market, 2029 and 2035: Distribution by Type of Formulation
- Table 17.116 Exosome Therapeutics Market for Liquid Formulations, 2029-2040 (USD Million)
- Table 17.117 Exosome Therapeutics Market for Aerosol Formulations, 2029-2040 (USD Million)
- Table 17.118 Global Exosome Therapeutics Market, 2029 and 2035: Distribution by Geography
- Table 17.119 Exosome Therapeutics Market in North America, 2029-2040 (USD Million)
- Table 17.120 Exosome Therapeutics Market in Europe, 2029-2040 (USD Million)
- Table 17.121 Exosome Therapeutics Market in Asia Pacific, 2030-2040 (USD Million)
List of Figures
- Figure 3.1 Potential Sources of Exosomes
- Figure 3.2 Secretion of Exosomes
- Figure 3.3 Mechanism of Exosome Therapy
- Figure 4.1 Exosome Therapeutics Market: Distribution by Phase of Development
- Figure 4.2 Exosome Therapeutics Market: Distribution by Technology Platform
- Figure 4.3 Exosome Therapeutics Market: Distribution by Type of Payload
- Figure 4.4 Exosome Therapeutics Market: Distribution by Type of Formulation
- Figure 4.5 Exosome Therapeutics Market: Distribution by Type of Therapy
- Figure 4.6 Exosome Therapeutics Market: Distribution by Derived Source
- Figure 4.7 Exosome Therapeutics Market: Distribution by Target Disease Indication(s)
- Figure 4.8 Exosome Therapeutics Market: Distribution by Therapeutic Area
- Figure 4.9 Exosome Therapeutics Market: Distribution by Phase of Development and Therapeutic Area
- Figure 4.10 Exosome Therapeutics Market: Distribution by Route of Administration
- Figure 4.11 Exosome Therapeutics: Distribution by Therapeutic Area and Route of Administration
- Figure 4.12 Exosome Therapeutics Market: Distribution by Type of Therapy (By method of composition)
- Figure 4.13 Exosome Therapeutics Market: Distribution by Line of Treatment
- Figure 4.14 Exosome Therapeutics Market: Distribution by Dosing Frequency
- Figure 4.15 Exosome Therapeutics Developers: Distribution by Year of Establishment
- Figure 4.16 Exosome Therapeutics Developers: Distribution by Company Size
- Figure 4.17 Exosome Therapeutics Developers: Distribution by Location of Headquarters
- Figure 4.18 Exosome Therapeutics Developers: Most Active Players: Distribution by Number of Therapeutic Programs
- Figure 6.1 Cellular Biomedicine Group: Financial Information, FY 2015 Onwards (USD Million)
- Figure 6.2 ReNeuron: Financial Information, FY 2018 Onwards (USD Million)
- Figure 7.1 Clinical Trials Analysis: Distribution by Trial Status
- Figure 7.2 Clinical Trials Analysis: Year-wise Distribution by Trial Registration Year
- Figure 7.3 Clinical Trials Analysis: Distribution by Type of Sponsor / Collaborator
- Figure 7.4 Clinical Trials Analysis: Year-wise Distribution by Registration Year and Type of Study
- Figure 7.5 Clinical Trials Analysis: Year-wise Distribution by Registration Year and Status of Trial
- Figure 7.6 Clinical Trials Analysis: Distribution by Study Design
- Figure 7.7 Clinical Trials Analysis: Distribution by Patient Enrollment
- Figure 7.8 Clinical Trials Analysis: Year-wise Trend of Completed and Recruiting Trials
- Figure 7.9 Clinical Trials Analysis: Distribution by Age Group
- Figure 7.10 Clinical Trials Analysis: Distribution by Phase of Development and Trial Status
- Figure 7.11 Clinical Trials Analysis: Distribution by Phase of Development and Patient Enrollment
- Figure 7.12 Most Active Industry Players: Distribution by Number of Registered Trials
- Figure 7.13 Most Active Non-Industry Players: Distribution by Number of Registered Trials
- Figure 7.14 Clinical Trials Analysis: Distribution by Trial Location
- Figure 7.15 Clinical Trials Analysis: Distribution by Trial Status and Geography
- Figure 8.1 Academic Grant Analysis: Year-wise Distribution of Number of Grants
- Figure 8.2 Academic Grant Analysis: Year-wise Distribution by Amount of Grant Awarded (USD Million)
- Figure 8.3 Academic Grant Analysis: Popular NIH Departments: Analysis by Number of Grants
- Figure 8.4 Academic Grant Analysis: Analysis by Type of Funding Institute Center
- Figure 8.5 Academic Grant Analysis: Distribution by Support Period
- Figure 8.6 Academic Grant Analysis: Distribution by Purpose of Grants
- Figure 8.7 Academic Grant Analysis: Distribution by Emerging Focus Area
- Figure 8.8 Academic Grant Analysis: Distribution by Grant Activity Code
- Figure 8.9 Academic Grant Analysis: Distribution by Local Recipients
- Figure 8.10 Academic Grant Analysis: Distribution by Type of Recipient Organization
- Figure 8.11 Academic Grant Analysis: Popular Recipient Organizations: Analysis by Amount Awarded
- Figure 8.12 Academic Grant Analysis: Popular Recipient Organizations: Analysis by Number of Grants
- Figure 8.13 Academic Grant Analysis: Distribution by Study Section
- Figure 8.14 Academic Grant Analysis: Distribution by Type of Grant Application
- Figure 8.15 Academic Grant Analysis: Analysis by Funding Institute Center and Support Year
- Figure 9.1 Global Events: Cumulative Half Yearly Trend, since 2019
- Figure 9.2 Global Events: Distribution by Event Platform
- Figure 9.3 Global Events: Distribution by Type of Event
- Figure 9.4 Global Events: Distribution by Location of Event
- Figure 9.5 Word Cloud Analysis: Evolutionary Trends in Event Agenda / Key Focus Area
- Figure 9.6 Most Active Organizers: Distribution by Number of Events
- Figure 9.7 Most Active Industry Participants: Distribution by Number of Events
- Figure 9.8 Most Active Non-Industry Participants: Distribution by Number of Events
- Figure 9.9 Global Events: Distribution by Designation of Participant
- Figure 9.10 Global Events: Distribution by Affiliated Department of Participant
- Figure 9.11 Most Active Speakers: Distribution by Number of Events
- Figure 10.1 Partnerships and Collaborations: Cumulative Year-wise Trend, since 2017
- Figure 10.2 Partnerships and Collaborations: Distribution by Type of Partnership
- Figure 10.3 Partnerships and Collaborations: Year-wise Distribution by Year and Type of Partnership, since 2017
- Figure 10.4 Partnerships and Collaborations: Year-wise Distribution by Company and Type of Partnership, since 2017
- Figure 10.5 Partnerships and Collaborations: Distribution by Type of Technology Platform
- Figure 10.6 Partnerships and Collaborations: Distribution by Type of Partner
- Figure 10.7 Word Cloud Analysis: Emerging Focus Areas
- Figure 10.8 Partnerships and Collaborations: Distribution by Target Disease Indication(s)
- Figure 10.9 Partnerships and Collaborations: Distribution by Therapeutic Area
- Figure 10.10 Partnerships and Collaborations: Distribution by Therapeutic Area and Type of Partnership
- Figure 10.11 Most Active Players: Distribution by Number of Partnerships
- Figure 10.12 Partnerships and Collaborations: Regional Distribution
- Figure 10.13 Partnerships and Collaborations: Intercontinental and Intracontinental Agreements
- Figure 11.1 Funding and Investments: Year-wise Distribution by Year of Funding, since 2017
- Figure 11.2 Funding and Investments: Year-wise Distribution by Amount Invested, since 2017 (USD Million)
- Figure 11.3 Funding and Investments: Distribution by Type of Funding
- Figure 11.4 Funding and Investments: Year-wise Distribution by Type of Funding and Amount Invested, since 2017
- Figure 11.5 Funding and Investments: Year-wise Distribution by Year, Type of Funding and Amount Invested, since 2017
- Figure 11.6 Funding and Investments: Distribution by Purpose of Funding
- Figure 11.7 Funding and Investments: Distribution by Target Disease Indication(s)
- Figure 11.8 Funding and Investments: Distribution by Therapeutic Area
- Figure 11.9 Most Active Players: Distribution by Number of Funding Instances
- Figure 11.10 Most Active Players: Distribution by Amount Invested (USD Million)
- Figure 11.11 Key Investors: Distribution by Number of Funding Instances
- Figure 11.12 Funding and Investments: Distribution by Geographical Regions
- Figure 11.13 Summary of Funding Instances
- Figure 12.1 Start-up Health Indexing: Distribution by Pipeline Maturity
- Figure 12.2 Start-up Health Indexing: Distribution by Pipeline Strength
- Figure 12.3 Start-up Health Indexing: Distribution by Financial Support
- Figure 12.4 Start-up Health Indexing: Distribution by Number of Investors
- Figure 12.5 Start-up Health Indexing: Distribution by Partnership Activity
- Figure 12.6 Start-up Health Indexing: Roots Analysis Perspective
- Figure 13.1 Case Study: Distribution of Exosome Development and Manufacturing Services Providers by Year of Establishment
- Figure 13.2 Case Study: Distribution of Exosome Development and Manufacturing Services Providers by Company Size
- Figure 13.3 Case Study: Distribution of Exosome Development and Manufacturing Services Providers by Location of Headquarters
- Figure 13.4 Case Study: Distribution of Exosome Development and Manufacturing Services Providers by Location of Headquarters and Company Size
- Figure 13.5 Case Study: Distribution of Exosome Development and Manufacturing Services Providers by Type of Service(s) Offered
- Figure 13.6 Case Study: Distribution of Exosome Development and Manufacturing Services Providers by Method(s) of Isolation
- Figure 13.7 Case Study: Distribution of Exosome Development and Manufacturing Services Providers by Method(s) of Purification
- Figure 13.8 Case Study: Distribution of Exosome Development and Manufacturing Services Providers by Method(s) of Characterization
- Figure 13.9 Case Study: Distribution of Exosome Development and Manufacturing Services Providers by Method(s) of Manufacturing
- Figure 13.10 Case Study: Distribution of Exosome Development and Manufacturing Services Providers by Scale of Operation
- Figure 13.11 Case Study: Distribution of Exosome Development and Manufacturing Services Providers by Scalability
- Figure 14.1 Drug Failure Analysis: Distribution by Study Start Year and Year of Termination of the Clinical Trials
- Figure 14.2 Drug Failure Analysis: Distribution by Trial Status of Discontinuation
- Figure 14.3 Drug Failure Analysis: Distribution by Target Disease Indication(s)
- Figure 14.4 Drug Failure Analysis: Distribution by Route of Administration
- Figure 14.5 Drug Failure Analysis: Distribution by Type of Sponsor
- Figure 14.6 Drug Failure Analysis: Distribution by Reasons for Drug Failure
- Figure 14.7 Word Cloud Analysis: Emerging Focus Area
- Figure 15.1 Global Exosome Therapeutics Market, 2029-2040 (USD Million)
- Figure 15.2 Global Exosome Therapeutics Market, 2029 and 2035: Distribution by Type of Target Disease Indication(s) (USD Million)
- Figure 15.3 Exosome Therapeutics Market for COVID-19, 2029-2040 (USD Million)
- Figure 15.4 Exosome Therapeutics Market for Retinitis Pigmentosa, 2029-2040 (USD Million)
- Figure 15.5 Exosome Therapeutics Market for Degenerative Meniscal Injury, 2029-2040 (USD Million)
- Figure 15.6 Global Exosome Therapeutics Market, 2029 and 2035: Distribution by Therapeutic Area (USD Million)
- Figure 15.7 Exosome Therapeutics Market for Infectious Diseases, 2029-2040 (USD Million)
- Figure 15.8 Exosome Therapeutics Market for Musculoskeletal Disorders, 2031-2040 (USD Million)
- Figure 15.9 Exosome Therapeutics Market for Ophthalmic Diseases, 2033-2040 (USD Million)
- Figure 15.10 Global Exosome Therapeutics Market, 2029 and 2035: Distribution by Route of Administration
- Figure 15.11 Inhalation Exosome Therapeutics Market, 2029-2040 (USD Million)
- Figure 15.12 Intravenous Exosome Therapeutics Market, 2031-2040 (USD Million)
- Figure 15.13 Intra-articular Exosome Therapeutics Market, 2033-2040 (USD Million)
- Figure 15.14 Intra-ocular Exosome Therapeutics Market, 2029-2040 (USD Million)
- Figure 15.15 Global Exosome Therapeutics Market, 2029 and 2035: Distribution by Type of Formulation
- Figure 15.16 Exosome Therapeutics Market for Liquid Formulations, 2029-2040 (USD Million)
- Figure 15.17 Exosome Therapeutics Market for Aerosol Formulations, 2029-2040 (USD Million)
- Figure 15.18 Global Exosome Therapeutics Market, 2029 and 2035: Distribution by Geography
- Figure 15.19 Exosome Therapeutics Market in North America, 2029-2040 (USD Million)
- Figure 15.20 Exosome Therapeutics Market in Europe, 2029-2040 (USD Million)
- Figure 15.21 Exosome Therapeutics Market in Asia Pacific, 2030-2040 (USD Million)
 外泌体市场按产品/服务、适应症、用途、製造服务、最终用途和地区划分2030 年胞外体市场预测:按产品、来源、技术、最终用户和地区进行的全球分析胞外体市场规模、份额、成长分析、按产品、按工作流程、按应用、按最终用途、按地区 - 产业预测,2024-2031 年
 胞外体市场规模、份额、趋势分析报告:按产品/服务、工作流程、最终用途、地区和细分市场进行预测,2025-2030 年
 外泌体的全球市场 - 市场规模,预测,实验,趋势 (2024年)胞外体诊断和治疗市场:按类型、按产品和服务、按来源、按应用、按最终用户、按地区
 全球外泌体市场研究报告 - 2024 年至 2032 年产业分析、规模、份额、成长、趋势和预测全球外泌体技术市场研究报告 - 2024 年至 2032 年产业分析、规模、份额、成长、趋势与预测
 外泌体分离市场 - 2024-2034 年全球产业分析、规模、份额、成长、趋势与预测
 全球外泌体研究市场评估:依产品和服务、依适应症类型、依应用类型、依最终用户、依地区、机会、预测(2017-2031)