


 |
市场调查报告书
商品编码
1682715
癌症生物标记市场:生物标记类别,癌症类别,各主要地区:2035年前的产业趋势与全球预测Cancer Biomarkers Market by Type of Biomarker, Type of Cancer and Key Geographical Regions : Industry Trends and Global Forecasts, Till 2035 |
||||||
预计到 2035 年,全球癌症生物标记市场规模将从目前的 286 亿美元增长至 467 亿美元,在预测期内以 5% 的复合年增长率增长。
包括检查点抑制剂在内的几种免疫疗法已经在多种实体肿瘤中取得临床成功。然而,对于用于治疗不同类型特定癌症患者的疗法的评估仍有未被满足的需求。这是因为患有相同癌症(相同阶段)的患者可能具有不同的分子特征,对建议的药物/治疗的反应也不同。确定可靠的癌症生物标记对于患者获得更好的治疗结果至关重要。生物标记提供了有关单一肿瘤分子特征的宝贵信息,使临床医生能够根据每位患者的独特情况制定治疗策略。
癌症生物标记前景光明,因为它们可用于癌症治疗的各个方面,包括筛检、癌症分类、风险评估、肿瘤负荷测定、治疗个人化和监测以及预后预测。此外,基因组学、蛋白质组学、代谢组学和微小RNA分析、比较基因组杂交(CGH)、单核苷酸多态性(SNP)分析、高通量筛选(HTS)和下一代定序(NGS)等技术的进步为发现新的肿瘤特征铺平了道路。此外,强大的蛋白质组学和基因组学技术的出现,加上循环肿瘤细胞 (CTC)、癌症干细胞特异性标记和无细胞循环肿瘤 DNA (ctDNA) 的分析,有助于开发更敏感、更具体的生物标誌物,用于早期癌症检测、监测疾病进展和选择适当的治疗方法。随着技术创新的快速发展和对个人化方法的日益关注,癌症生物标记市场预计将在短期内实现显着成长。
目前,市场上有近 100 种新型癌症生物标记解决方案,其中大多数解决方案使用次世代定序来评估癌症生物标记。
该行业的利益相关者致力于为广泛的应用提供新型癌症生物标记解决方案,其中超过 70% 的解决方案支持 MSI/MMR 的评估。目前癌症生物标记检测解决方案供应商的市场环境较为分散,既有新进者,也有现有企业。目前,不同地区正在进行近 685 项临床试验(招募超过 75,000 名患者),以研究新型癌症生物标记。癌症生物标记领域的研究取得了重大进展,各类研究人员已发表了超过 470 篇论文,显示多个产业和学术利害关係人对这一领域的兴趣日益浓厚。在技术创新和合作活动不断加快的推动下,癌症生物标记市场预计将在可预见的未来稳步成长。预计到 2035 年,癌症生物标记市场将以 5% 的复合年增长率成长,其中北美预计将占据市场的大部分份额(超过 45%)。
本报告提供全球癌症生物标记市场相关调查,提供市场概要,以及生物标记类别,癌症类别,各主要地区的趋势,及加入此市场的主要企业简介等资讯。
目录
第1章 序文
第2章 调查手法
第3章 经济以及其他的计划特有的考虑事项
第4章 摘要整理
第5章 简介
第6章 市场形势
第7章 产品竞争力分析
第8章 企业简介
第9章 生物标记为基础临床试验的创新的研究设计
第10章 临床试验的分析
第11章 出版物的分析
第12章 大型製药企业:基准分析
第13章 案例研究:伴随式诊断产业的价值链的分析
第14章 未来的成长机会
第15章 全球癌症生物标记市场
第16章 癌症生物标记市场,各生物标记类型
第17章 癌症生物标记市场,各癌症类型
第18章 癌症生物标记市场,各主要地区
第19章 结论
第20章 执行洞察
第21章 附录1:表格形式的资料
第22章 附录2:企业·团体一览
CANCER BIOMARKERS MARKET: OVERVIEW
As per Roots Analysis, the global cancer biomarkers market is estimated to grow from USD 28.6 billion in the current year to USD 46.7 billion by 2035, at a CAGR of 5% during the forecast period, till 2035.
The market sizing and opportunity analysis has been segmented across the following parameters:
Type of Biomarker
- HER2
- MET
- EGFR
- PD-L1
- NTRK
- ALK
- Novel Biomarkers
- Other Biomarkers
Type of Cancer
- Breast Cancer
- Prostate Cancer
- Colorectum Cancer
- Lung Cancer
- Thyroid Cancer
- Bladder Cancer
- Melanoma
- Non-Hodgkins Lymphoma
- Endometrial Cancer
- Kidney Cancer
- Leukemia
Key Geographical Regions
- North America
- Europe
- Asia-Pacific
- Rest of the World
CANCER BIOMARKERS MARKET: GROWTH AND TRENDS
The clinical success of several immunotherapies, such as checkpoint inhibitors, has already been established across multiple solid tumors. However, there still exists an unmet need related to evaluating the type of therapy that is to be used for treating different individuals suffering from a specific type of cancer. This is attributed to the fact that patients suffering from same cancer (same stage of the disease) may have exhibited different molecular profiles and respond differently to recommended drug / therapy types. In order to achieve better results for the patients, it is critical to identify reliable cancer biomarkers. Biomarkers provide valuable information about the molecular characteristics of individual tumors, allowing clinicians to tailor treatment strategies to each patient's unique profile.
The future of cancer biomarkers is promising as they have the potential to be used in various aspects of cancer medicine, such as screening, cancer classification, risk assessment, determination of tumor burden, personalization and monitoring of treatment, and prognosis. Moreover, advancements in genomic, proteomic, metabolomic, and microRNomic profiling, along with other techniques, such as comparative genome hybridization (CGH), single nucleotide polymorphism (SNP) analysis, high throughput screening (HTS) and next-generation sequencing (NGS), are paving the way for the discovery of new tumor signatures. Furthermore, the emergence of powerful proteomic and genomic technologies, combined with the analysis of circulating tumor cells (CTC), cancer stem cell-specific markers and cell-free circulating tumor DNA (ctDNA) are contributing to the development of more sensitive and specific biomarkers for early cancer detection, disease progression monitoring and proper treatment selection. Given the ongoing pace of innovation, and increasing interest towards personalized approaches, the cancer biomarkers market is poised to experience a noteworthy growth in the foreseeable future.
CANCER BIOMARKERS MARKET: KEY INSIGHTS
The report delves into the current state of the cancer biomarkers market and identifies potential growth opportunities within the industry. Some key findings from the report include:
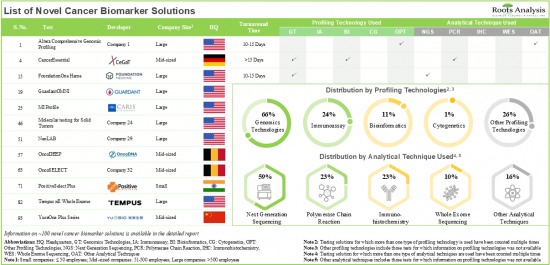
- Presently, close to 100 novel cancer biomarker solutions are available in the market; majority of these solutions use next generation sequencing for the assessment of cancer biomarkers.
- Stakeholders in this industry are engaged in providing novel cancer biomarker solutions for a wide range of applications; more than 70% of these solutions assist in the evaluation of MSI / MMR.
- The current market landscape of cancer biomarker testing solution providers is fragmented, featuring the presence of both new entrants and established players; majority of these players are based in the US.
- Close to 685 clinical trials (with more than 75,000 enrolled patients) are currently ongoing in order to investigate novel cancer biomarkers, across different geographies.
- The field of cancer biomarkers has seen a significant rise in research, with over 470 articles published by various researchers, underscoring the growing focus of several industry players and academic players in this domain.
- Driven by the increasing pace of innovation and partnership activity, the market for cancer biomarkers is poised to witness steady growth in the foreseeable future.
- The cancer biomarkers market is anticipated to grow at a CAGR of 5%, till 2035; North America is expected to capture the majority share (over 45%) of the market by 2035.
CANCER BIOMARKERS MARKET: KEY SEGMENTS
HER2 Biomarker Occupies the Largest Share of the Cancer Biomarkers Market
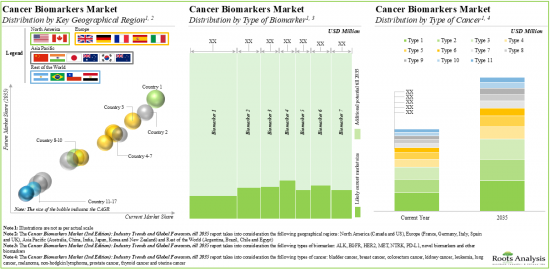
Based on the type of biomarker, the market is segmented into HER2, MET, EGFR, PD-L1, NTRK, ALK, novel biomarkers and other biomarkers. At present, HER2 biomarkers hold the maximum share of the cancer biomarkers market. It is worth highlighting that the cancer biomarkers market for EGFR is likely to grow at a relatively higher CAGR in the near future.
Breast Cancer is Likely to Dominate the Cancer Biomarkers Market During the Forecast Period
Based on the type of cancer, the market is segmented into breast cancer, prostate cancer, colorectum cancer, lung cancer, thyroid cancer, bladder cancer, melanoma, non-Hodgkins's lymphoma, endometrial cancer, kidney cancer and leukemia. Currently, breast cancer holds the maximum share of the cancer biomarkers market. This trend is unlikely to change in the near future.
North America Accounts for the Largest Share of the Market
Based on the key geographical regions, the market is segmented into North America, Europe, Asia-Pacific and Rest of the world. Majority share is expected to be captured by players based in North America. It is worth highlighting that, over the years, the market in Asia-Pacific is expected to grow at a higher CAGR.
Example Players in the Cancer Biomarkers Market
- Agilent
- ARUP Laboratories
- BioReference
- Foundation Medicine
- OncoDNA
- Q2 Solutions
- Thermo Fisher Scientific
- YuceBio
- Asper Biogene
- Caris Life Sciences
- CeGaT
- Genekor Medical
- Guardant Health
- Labcorp
- MedGenome
- NeoGenomics Laboratories
- Nonacus
- Oxford Gene Technology
- Personal Genome Diagnostics
- PhenoPath
- Positive Biosciences
- Quest Diagnostics
- Tempus
Primary Research Overview
The opinions and insights presented in this study were influenced by discussions conducted with multiple stakeholders. The research report features detailed transcripts of interviews held with the following industry stakeholders:
- Chief Technical Officer and Former Director of Preclinical Development & Strategic Partnerships, Large Company, US
- Business Manager, Mid-sized Company, Germany
- Former Chief Scientific Officer, Large Company, US
CANCER BIOMARKERS MARKET: RESEARCH COVERAGE
- Market Sizing and Opportunity Analysis: The report features an in-depth analysis of the cancer biomarkers market, focusing on key market segments, including [A] type of biomarker, [B] type of cancer and [C] geographical regions.
- Market Landscape: A comprehensive evaluation of testing solutions for novel cancer biomarkers, considering various parameters, such as [A] type of biomarkers, [B] profiling technology used, [C] analytical technique used, [D] turnaround time, [E] sample input, [F] type nucleic acid tested, [G] type of cancer and [H] application area. Additionally, it includes a detailed list of developers engaged in offering novel cancer biomarker testing solutions, along with analysis based on various parameters, such as [I] year of establishment, [J] company size (in terms of employee count) and [K] location of headquarters.
- Product Competitiveness Analysis: A comprehensive competitive analysis of novel cancer biomarker testing solutions, examining factors, such as product versatility and product competitiveness.
- Company Profiles: In-depth profiles of key industry players offering novel cancer biomarker testing solutions, focusing on [A] company overviews, [B] financial information, [C] cancer biomarker testing solutions portfolio, [D] recent developments and [E] an informed future outlook.
- Case Study: A general discussion on the innovative study designs involved in conducting biomarker-based clinical trial to evaluate drugs for oncological disorders. It includes details on the structure of each study design, highlighting their respective advantages and challenges.
- Clinical Trial Analysis: Examination of completed, ongoing, and planned clinical studies of various novel cancer biomarkers based on parameters like [A] trial registration year, [B] trial status, [C] trial phase, [D] enrolled patient population, [E] type of sponsor / collaborator, [F] most active players (in terms of number of registered trials), [G] study design, [H] target therapeutic area and [I] key geographical regions.
- Publication Analysis: A detailed publication analysis of over 630 articles that have been published since 2019, highlighting the key focus areas of ongoing research related to novel cancer biomarkers. It highlights the prevalent trends based on the [A] year of publication, [B] type of publication, [C] type of cancer, [D] copyright holders, [E] emerging focus areas, [F] most active publishers (in terms of number of publications) and [G] key journals (in terms of journal impact factor and number of articles published).
- Big Pharma Analysis: A comprehensive examination of various initiatives focused on cancer biomarkers undertaken by major pharmaceutical companies. This analysis includes heat map visualizations that illustrate the distribution of leading pharmaceutical firms, as well as spider web diagrams that compare their initiatives across multiple relevant parameters.
- Case Study: A comprehensive value chain analysis that explores the various stages involved in the production of companion diagnostics. This includes a discussion on research and development (R&D), clinical assessment of the product, manufacturing and assembly, payer negotiation and marketing activities and the cost distribution across each of the aforementioned stages.
- Future Growth Opportunities: A detailed discussion on the upcoming opportunities for cancer biomarker testing solution providers in this field that are likely to impact on the evolution of the market in the short to mid-term and mid to long-term.
KEY QUESTIONS ANSWERED IN THIS REPORT
- How many companies are currently engaged in this market?
- Which are the leading companies in this market?
- What are the factors that are likely to influence the evolution of this market?
- What is the current and future market size?
- What is the CAGR of this market?
- How is the current and future market opportunity likely to be distributed across key market segments?
REASONS TO BUY THIS REPORT
- The report provides a comprehensive market analysis, offering detailed revenue projections of the overall market and its specific sub-segments. This information is valuable to both established market leaders and emerging entrants.
- Stakeholders can leverage the report to gain a deeper understanding of the competitive dynamics within the market. By analyzing the competitive landscape, businesses can make informed decisions to optimize their market positioning and develop effective go-to-market strategies.
- The report offers stakeholders a comprehensive overview of the market, including key drivers, barriers, opportunities, and challenges. This information empowers stakeholders to stay abreast of market trends and make data-driven decisions to capitalize on growth prospects.
ADDITIONAL BENEFITS
- Complimentary PPT Insights Packs
- Complimentary Excel Data Packs for all Analytical Modules in the Report
- 10% Free Content Customization
- Detailed Report Walkthrough Session with Research Team
- Free Updated report if the report is 6-12 months old or older
TABLE OF CONTENTS
1. PREFACE
- 1.1. Introduction
- 1.2. Market Share Insights
- 1.3. Key Market Insights
- 1.4. Research Coverage
- 1.5. Key Questions Answered
- 1.6. Chapter Outlines
2. RESEARCH METHODOLOGY
- 2.1. Chapter Overview
- 2.2. Research Assumptions
- 2.3. Project Methodology
- 2.4. Forecast Methodology
- 2.5. Robust Quality Control
- 2.6. Key Market Segmentations
- 2.7. Key Considerations
- 2.7.1. Demographics
- 2.7.2. Economic Factors
- 2.7.3. Government Regulations
- 2.7.4. Supply Chain
- 2.7.5. COVID Impact
- 2.7.6. Market Access
- 2.7.7. Healthcare Policies
- 2.7.8. Industry Consolidation
3. ECONOMIC AND OTHER PROJECT SPECIFIC CONSIDERATIONS
- 3.1. Chapter Overview
- 3.2. Market Dynamics
- 3.2.1. Time Period
- 3.2.1.1. Historical Trends
- 3.2.1.2. Current and Future Estimates
- 3.2.2. Currency Coverage and Foreign Exchange Rate
- 3.2.2.1. Major Currencies Affecting the Market
- 3.2.2.2. Factors Affecting Currency Fluctuations and Foreign Exchange Rates
- 3.2.2.3. Impact of Foreign Exchange Rate Volatility on the Market
- 3.2.2.4. Strategies for Mitigating Foreign Exchange Risks
- 3.2.3. Trade Policies
- 3.2.3.1. Impact of Trade Barriers on the Market
- 3.2.3.2. Strategies for Mitigating the Risks associated with Trade Barriers
- 3.2.4. Recession
- 3.2.4.1. Historical Analysis of Past Recessions and Lessons Learnt
- 3.2.4.2. Assessment of Current Economic Conditions and Potential Impact on the Market
- 3.2.5. Inflation
- 3.2.5.1. Measurement and Analysis of Inflationary Pressures in the Economy
- 3.2.5.2. Potential Impact of Inflation on the Market Evolution
- 3.2.1. Time Period
4. EXECUTIVE SUMMARY
5. INTRODUCTION
- 5.1. Chapter Overview
- 5.2. An Overview of Cancer Biomarkers
- 5.2.1. Need for Cancer Biomarkers
- 5.2.2. Identification of a Candidate Biomarker
- 5.3. Type of Cancer Biomarkers
- 5.4. Novel Cancer Biomarkers
- 5.4.1. Tumor Mutation Burden (TMB)
- 5.4.1.1. Variation of TMB across Multiple Indications
- 5.4.1.2. Methods for Measurement of TMB
- 5.4.1.3. Factors Affecting Measurement of TMB
- 5.4.1.4. Initiatives for Assessment of TMB as a Potential Biomarker
- 5.4.2. Microsatellite Instability / Mismatch Repair Deficiency (MSI / MMR)
- 5.4.2.1. Variation of MSI across Multiple Indications
- 5.4.2.2. Methods for Measurement of MSI
- 5.4.3. Single Nucleotide Variants
- 5.4.3.1. Variation of SNV across Multiple Indications
- 5.4.3.2. Methods for Measurement of SNV
- 5.4.4. Copy Number Variants
- 5.4.4.1. Variation of CNV across Multiple Indications
- 5.4.4.2. Methods for Measurement of CNV
- 5.4.5. Tumor Infiltrating Lymphocytes and Other Novel Biomarkers
- 5.4.1. Tumor Mutation Burden (TMB)
- 5.5. Future Perspective
6. MARKET LANDSCAPE
- 6.1. Chapter Overview
- 6.2. Cancer Biomarker Testing Solutions: Overall Market Landscape
- 6.2.1. Analysis by Type of Biomarker
- 6.2.2. Analysis by Profiling Technology Used
- 6.2.3. Analysis by Analytical Technique Used
- 6.2.4. Analysis by Turnaround Time
- 6.2.5. Analysis by Sample Input
- 6.2.6. Analysis by Type of Nucleic Acid Tested
- 6.2.7. Analysis by Type of Cancer
- 6.2.8. Analysis by Application Area
- 6.3. Cancer Biomarkers Testing Solutions: Developer Landscape
- 6.3.1. Analysis by Year of Establishment
- 6.3.2. Analysis by Company Size
- 6.3.3. Analysis by Location of Headquarters
7. PRODUCT COMPETITIVENESS ANALYSIS
- 7.1. Chapter Overview
- 7.2. Assumptions and Key Parameters
- 7.3. Methodology
- 7.4. Cancer Biomarkers Testing Solutions: Product Competitiveness Analysis
- 7.4.1. Products Offered by Players Based in North America
- 7.4.2. Products Offered by Players Based in Europe
- 7.4.3. Products Offered by Players Based in Asia-Pacific
8. COMPANY PROFILES
- 8.1. Chapter Overview
- 8.2. Detailed Profiles of Leading Cancer Biomarker Testing Solutions Providers
- 8.2.1. Agilent
- 8.2.1.1. Company Overview
- 8.2.1.2. Financial Information
- 8.2.1.3. Cancer Biomarker Testing Solutions Portfolio
- 8.2.1.4. Recent Developments and Future Outlook
- 8.2.2. ARUP Laboratories
- 8.2.2.1. Company Overview
- 8.2.2.2. Cancer Biomarker Testing Solutions Portfolio
- 8.2.2.3. Recent Developments and Future Outlook
- 8.2.3. BioReference
- 8.2.3.1. Company Overview
- 8.2.3.2. Cancer Biomarker Testing Solutions Portfolio
- 8.2.3.3. Recent Developments and Future Outlook
- 8.2.4. Foundation Medicine
- 8.2.4.1. Company Overview
- 8.2.4.2. Cancer Biomarker Testing Solutions Portfolio
- 8.2.4.3. Recent Developments and Future Outlook
- 8.2.5. OncoDNA
- 8.2.5.1. Company Overview
- 8.2.5.2. Cancer Biomarker Testing Solutions Portfolio
- 8.2.5.3. Recent Developments and Future Outlook
- 8.2.6. Q2 Solutions
- 8.2.6.1. Company Overview
- 8.2.6.2. Cancer Biomarker Testing Solutions Portfolio
- 8.2.6.3. Recent Developments and Future Outlook
- 8.2.7. Thermo Fisher Scientific
- 8.2.7.1. Company Overview
- 8.2.7.2. Financial Information
- 8.2.7.3. Cancer Biomarker Testing Solutions Portfolio
- 8.2.7.4. Recent Developments and Future Outlook
- 8.2.8. YuceBio
- 8.2.8.1. Company Overview
- 8.2.8.2. Cancer Biomarker Testing Solutions Portfolio
- 8.2.8.3. Recent Developments and Future Outlook
- 8.2.1. Agilent
- 8.3. Short Profiles of Other Leading Cancer Biomarkers Testing Solutions Providers
- 8.3.1. Asper Biogene
- 8.3.1.1. Company Overview
- 8.3.1.2. Cancer Biomarker Testing Solutions Portfolio
- 8.3.2. Caris Life Sciences
- 8.3.2.1. Company Overview
- 8.3.2.2. Cancer Biomarkers Testing Solutions Portfolio
- 8.3.3. CeGaT
- 8.3.3.1. Company Overview
- 8.3.3.2. Cancer Biomarkers Testing Solutions Portfolio
- 8.3.4. Genekor Medical
- 8.3.4.1. Company Overview
- 8.3.4.2. Cancer Biomarkers Testing Solutions Portfolio
- 8.3.5. Guardant Health
- 8.3.5.1. Company Overview
- 8.3.5.2. Cancer Biomarker Testing Solutions Portfolio
- 8.3.6. Labcorp
- 8.3.6.1. Company Overview
- 8.3.6.2. Cancer Biomarker Testing Solutions Portfolio
- 8.3.7. MedGenome
- 8.3.7.1. Company Overview
- 8.3.7.2. Cancer Biomarker Testing Solutions Portfolio
- 8.3.8. NeoGenomics Laboratories
- 8.3.8.1. Company Overview
- 8.3.8.2. Cancer Biomarker Testing Solutions Portfolio
- 8.3.9. Nonacus
- 8.3.9.1. Company Overview
- 8.3.9.2. Cancer Biomarkers Testing Solutions Portfolio
- 8.3.10. Oxford Gene Technology
- 8.3.10.1. Company Overview
- 8.3.10.2. Cancer Biomarkers Testing Solutions Portfolio
- 8.3.11. Personal Genome Diagnostics
- 8.3.11.1. Company Overview
- 8.3.11.2. Cancer Biomarkers Testing Solutions Portfolio
- 8.3.12. PhenoPath
- 8.3.12.1. Company Overview
- 8.3.12.2. Cancer Biomarkers Testing Solutions Portfolio
- 8.3.13. Positive Biosciences
- 8.3.13.1. Company Overview
- 8.3.13.2. Cancer Biomarkers Testing Solutions Portfolio
- 8.3.14. Quest Diagnostics
- 8.3.14.1. Company Overview
- 8.3.14.2. Cancer Biomarkers Testing Solutions Portfolio
- 8.3.15. Tempus
- 8.3.15.1. Company Overview
- 8.3.15.2. Cancer Biomarkers Testing Solutions Portfolio
- 8.3.1. Asper Biogene
9. INNOVATIVE STUDY DESIGNS FOR BIOMARKER-BASED CLINICAL TRIALS
- 9.1. Chapter Overview
- 9.2. Study Designs for Biomarker-based Clinical Trials
- 9.2.1. Enrichment Design
- 9.2.2. All-comers Design
- 9.2.3. Mixture / Hybrid Design
- 9.2.4. Adaptive Design
- 9.3. Regulatory Guidelines for Biomarker-based Clinical Trial Designs
10. CLINICAL TRIAL ANALYSIS
- 10.1. Chapter Overview
- 10.2. Scope and Methodology
- 10.3. Cancer Biomarkers: Clinical Trial Analysis
- 10.3.1. Analysis by Trial Registration Year
- 10.3.2. Analysis by Trial Status
- 10.3.3. Analysis by Trial Registration Year and Trial Status
- 10.3.4. Analysis by Trial Phase
- 10.3.5. Analysis by Trial Registration Year and Trial Phase
- 10.3.6. Analysis of Enrolled Patient Population by Trial Registration Year
- 10.3.7. Analysis of Enrolled Patient Population by Trial Phase
- 10.3.8. Analysis by Type of Sponsor / Collaborator
- 10.3.9. Most Active Players: Distribution by Number of Registered Trials
- 10.3.10. Analysis by Study Design
- 10.3.11. Analysis by Type of Cancer
- 10.3.12. Analysis of Clinical Trials by Geography
- 10.3.13. Analysis of Clinical Trials by Trial Status and Geography
- 10.3.14. Analysis of Enrolled Patient Population by Geography
- 10.3.15. Analysis of Enrolled Patient Population by Trial Status and Geography
11. PUBLICATION ANALYSIS
- 11.1. Chapter Overview
- 11.2. Scope and Methodology
- 11.3. Cancer Biomarkers: Publication Analysis
- 11.3.1. Analysis by Year of Publication
- 11.3.2. Analysis by Type of Publication
- 11.3.3. Analysis by Type of Cancer
- 11.3.4. Analysis by Copyright Holders
- 11.3.5. Word Cloud: Emerging Focus Areas
- 11.3.6. Most Active Publishers: Analysis by Number of Publications
- 11.3.7. Key Journals: Analysis by Number of Publications
- 11.3.8. Key Journals: Analysis by Impact Factor
12. BIG PHARMA PLAYERS: BENCHMARK ANALYSIS
- 12.1. Chapter Overview
- 12.2. Scope and Methodology
- 12.3. Big Pharma Players: Benchmarking Analysis
- 12.3.1. Spider Web Analysis: Abbott
- 12.3.2. Spider Web Analysis: AbbVie
- 12.3.3. Spider Web Analysis: Amgen
- 12.3.4. Spider Web Analysis: AstraZeneca
- 12.3.5. Spider Web Analysis: Bayer
- 12.3.6. Spider Web Analysis: Boehringer Ingelheim
- 12.3.7. Spider Web Analysis: Bristol-Myers Squib
- 12.3.8. Spider Web Analysis: Eli Lilly
- 12.3.9. Spider Web Analysis: Gilead
- 12.3.10. Spider Web Analysis: GlaxoSmithKline
- 12.3.11. Spider Web Analysis: Merck
- 12.3.12. Spider Web Analysis: Novartis
- 12.3.13. Spider Web Analysis: Pfizer
- 12.3.14. Spider Web Analysis: Roche
- 12.3.15. Spider Web Analysis: Sanofi
- 12.4. Concluding Remarks
13. CASE STUDY: ANALYSIS OF VALUE CHAIN IN THE COMPANION DIAGNOSTICS INDUSTRY
- 13.1. Chapter Overview
- 13.2. Companion Diagnostics: Value Chain
- 13.3. Cost Distribution Across the Value Chain
- 13.3.1. Costs Associated with Research and Product Development
- 13.3.2. Costs Associated with Manufacturing and Assembly
- 13.3.3. Costs Associated with Clinical Trials, FDA Approval and Other Administrative Tasks
- 13.3.4. Costs Associated with Payer Negotiation and KOL Engagement
- 13.3.5. Costs Associated with Marketing and Sales
14. FUTURE GROWTH OPPORTUNITIES
- 14.1. Chapter Overview
- 14.2. Growing Focus on Personalized Medicines
- 14.3. Extent of Biomarker Testing for Various Oncological Disorders
- 14.4. Increase in Number of Biomarker-based Clinical Trials
- 14.5. Increased Adoption of Emerging Analytical Techniques for Biomarker Assessment
- 14.6. Development of Companion Diagnostic Products
15. GLOBAL CANCER BIOMARKERS MARKET
- 15.1. Chapter Overview
- 15.2. Assumptions and Methodology
- 15.3. Global Cancer Biomarkers Market, Historical Trends (since 2018) and Forecasted Estimates (till 2035)
- 15.3.1. Scenario Analysis
- 15.3.1.1. Conservative Scenario
- 15.3.1.2. Optimistic Scenario
- 15.3.1. Scenario Analysis
- 15.4. Key Market Segmentations
16. CANCER BIOMARKERS MARKET, BY TYPE OF BIOMARKER
- 16.1. Chapter Overview
- 16.2. Key Assumptions and Methodology
- 16.3. Cancer Biomarkers Market: Distribution by Type of Biomarker, 2018, 2024 and 2035
- 16.3.1. Cancer Biomarkers Market for HER2 Biomarkers: Historical Trends (since 2018) and Forecasted Estimates (till 2035)
- 16.3.2. Cancer Biomarkers Market for MET Biomarkers: Historical Trends (since 2018) and Forecasted Estimates (till 2035)
- 16.3.3. Cancer Biomarkers Market for EGFR Biomarkers: Historical Trends (since 2018) and Forecasted Estimates (till 2035)
- 16.3.4. Cancer Biomarkers Market for PD-L1 Biomarkers: Historical Trends (since 2018) and Forecasted Estimates (till 2035)
- 16.3.5. Cancer Biomarkers Market for NTRK Biomarkers: Historical Trends (since 2018) and Forecasted Estimates (till 2035)
- 16.3.6. Cancer Biomarkers Market for ALK Biomarkers: Historical Trends (since 2018) and Forecasted Estimates (till 2035)
- 16.3.7. Cancer Biomarkers Market for Other Biomarkers: Historical Trends (since 2018) and Forecasted Estimates (till 2035)
- 16.3.7.1. Cancer Biomarkers Market: Distribution of Novel Biomarkers, 2018, 2024 and 2035
- 16.3.7.1.1. Cancer Biomarkers Market for SNV Biomarkers: Historical Trends (since 2018) and Forecasted Estimates (till 2035)
- 16.3.7.1.2. Cancer Biomarkers Market for MSI Biomarkers: Historical Trends (since 2018) and Forecasted Estimates (till 2035)
- 16.3.7.1.3. Cancer Biomarkers Market for CNV Biomarkers: Historical Trends (since 2018) and Forecasted Estimates (till 2035)
- 16.3.7.1.4. Cancer Biomarkers Market for TMB Biomarkers: Historical Trends (since 2018) and Forecasted Estimates (till 2035)
- 16.3.7.1.5. Cancer Biomarkers Market for TIL Biomarkers: Historical Trends (since 2018) and Forecasted Estimates (till 2035)
- 16.3.7.1. Cancer Biomarkers Market: Distribution of Novel Biomarkers, 2018, 2024 and 2035
- 16.4. Data Triangulation and Validation
17. CANCER BIOMARKERS MARKET, BY TYPE OF CANCER
- 17.1. Chapter Overview
- 17.2. Key Assumptions and Methodology
- 17.3. Cancer Biomarkers Market: Distribution by Type of Cancer, 2018, 2024 and 2035
- 17.3.1. Cancer Biomarkers Market for Breast Cancer: Historical Trends (since 2018) and Forecasted Estimates (till 2035)
- 17.3.2. Cancer Biomarkers Market for Prostate Cancer: Historical Trends (since 2018) and Forecasted Estimates (till 2035)
- 17.3.3. Cancer Biomarkers Market for Colorectum Cancer: Historical Trends (since 2018) and Forecasted Estimates (till 2035)
- 17.3.4. Cancer Biomarkers Market for Lung Cancer: Historical Trends (since 2018) and Forecasted Estimates (till 2035)
- 17.3.5. Cancer Biomarkers Market for Thyroid Cancer: Historical Trends (since 2018) and Forecasted Estimates (till 2035)
- 17.3.6. Cancer Biomarkers Market for Bladder Cancer: Historical Trends (since 2018) and Forecasted Estimates (till 2035)
- 17.3.7. Cancer Biomarkers Market for Melanoma: Historical Trends (since 2018) and Forecasted Estimates (till 2035)
- 17.3.8. Cancer Biomarkers Market for Non-Hodgkin Lymphoma: Historical Trends (since 2018) and Forecasted Estimates (till 2035)
- 17.3.9. Cancer Biomarkers Market for Endometrial Cancer: Historical Trends (since 2018) and Forecasted Estimates (till 2035)
- 17.3.10. Cancer Biomarkers Market for Kidney Cancer: Historical Trends (since 2018) and Forecasted Estimates (till 2035)
- 17.3.11. Cancer Biomarkers Market for Leukemia: Historical Trends (since 2018) and Forecasted Estimates (till 2035)
- 17.4. Data Triangulation and Validation
18. CANCER BIOMARKERS MARKET, BY KEY GEOGRAPHICAL REGIONS
- 18.1. Chapter Overview
- 18.2. Key Assumptions and Methodology
- 18.3. Cancer Biomarkers Market: Distribution by Key Geographical Regions, 2018, 2024 and 2035
- 18.3.1. Cancer Biomarkers Market in North America: Historical Trends (since 2018) and Forecasted Estimates (till 2035)
- 18.3.1.1. Cancer Biomarkers Market in the US: Historical Trends (since 2018) and Forecasted Estimates (till 2035)
- 18.3.1.2. Cancer Biomarkers Market in Canada: Historical Trends (since 2018) and Forecasted Estimates (till 2035)
- 18.3.2. Cancer Biomarkers Market in Europe: Historical Trends (since 2018) and Forecasted Estimates (till 2035)
- 18.3.2.1. Cancer Biomarkers Market in the UK: Historical Trends (since 2018) and Forecasted Estimates (till 2035)
- 18.3.2.2. Cancer Biomarkers Market in Germany: Historical Trends (since 2018) and Forecasted Estimates (till 2035)
- 18.3.2.3. Cancer Biomarkers Market in France: Historical Trends (since 2018) and Forecasted Estimates (till 2035)
- 18.3.2.4. Cancer Biomarkers Market in Spain: Historical Trends (since 2018) and Forecasted Estimates (till 2035)
- 18.3.2.5. Cancer Biomarkers Market in Italy: Historical Trends (since 2018) and Forecasted Estimates (till 2035)
- 18.3.3. Cancer Biomarkers Market in Asia-Pacific: Historical Trends (since 2018) and Forecasted Estimates (till 2035)
- 18.3.3.1. Cancer Biomarkers Market in China: Historical Trends (since 2018) and Forecasted Estimates (till 2035)
- 18.3.3.2. Cancer Biomarkers Market in Japan: Historical Trends (since 2018) and Forecasted Estimates (till 2035)
- 18.3.3.3. Cancer Biomarkers Market in India: Historical Trends (since 2018) and Forecasted Estimates (till 2035)
- 18.3.3.4. Cancer Biomarkers Market in Australia: Historical Trends (since 2018) and Forecasted Estimates (till 2035)
- 18.3.3.5. Cancer Biomarkers Market in South Korea: Historical Trends (since 2018) and Forecasted Estimates (till 2035)
- 18.3.3.6. Cancer Biomarkers Market in New Zealand: Historical Trends (since 2018) and Forecasted Estimates (till 2035)
- 18.3.4. Cancer Biomarkers Market in Rest of the World: Historical Trends (since 2018) and Forecasted Estimates (till 2035)
- 18.3.4.1. Cancer Biomarkers Market in Brazil: Historical Trends (since 2018) and Forecasted Estimates (till 2035)
- 18.3.4.2. Cancer Biomarkers Market in Argentina: Historical Trends (since 2018) and Forecasted Estimates (till 2035)
- 18.3.4.3. Cancer Biomarkers Market in Chile: Historical Trends (since 2018) and Forecasted Estimates (till 2035)
- 18.3.4.4. Cancer Biomarkers Market in Egypt: Historical Trends (since 2018) and Forecasted Estimates (till 2035)
- 18.3.1. Cancer Biomarkers Market in North America: Historical Trends (since 2018) and Forecasted Estimates (till 2035)
- 18.4. Data Triangulation and Validation
19. CONCLUDING REMARKS
20. EXECUTIVE INSIGHTS
- 20.1. Chapter Overview
- 20.2. Cell IDc
- 20.2.1. Company Snapshot
- 20.2.2. Interview Transcript: David Schwartz, Chief Technical Officer and Helen Synder, Former Director of Preclinical Development & Strategic Partnerships
- 20.3. CeGat
- 20.2.1. Company Snapshot
- 20.2.2. Interview Transcript: Kirill Shur, Business Manager
- 20.4. NeoGenomics Laboratories
- 20.2.1. Company Snapshot
- 20.2.2. Interview Transcript: Lawrence Weiss, Former Chief Scientific Officer
21. APPENDIX 1: TABULATED DATA
22. APPENDIX 2: LIST OF COMPANIES AND ORGANIZATIONS
List of Tables
- Table 6.1 Cancer Biomarkers Testing Solutions: Information on Type of Biomarkers
- Table 6.2 Cancer Biomarkers Testing Solutions: Information on Profiling Technologies and Analytical Technique
- Table 6.3 Cancer Biomarkers Testing Solutions: Information on Turnaround Time, Sample Input and Type of Nucleic Acid Tested
- Table 6.4 Cancer Biomarkers Testing Solutions: Information on Type of Cancer
- Table 6.5 Cancer Biomarkers Testing Solutions: Information on Application Area and End Users
- Table 6.6 List of Cancer Biomarker Testing Solution Providers
- Table 8.1 Cancer Biomarkers Testing Solution Providers: List of Companies Profiled
- Table 8.2 Agilent: Company Overview
- Table 8.3 Agilent: Cancer Biomarkers Testing Solutions Portfolio
- Table 8.4 Agilent: Recent Developments and Future Outlook
- Table 8.5 ARUP Laboratories: Company Overview
- Table 8.6 ARUP Laboratories: Cancer Biomarker Testing Solutions Portfolio
- Table 8.7 ARUP Laboratories: Recent Developments and Future Outlook
- Table 8.8 BioReference: Company Overview
- Table 8.9 BioReference: Cancer Biomarker Testing Solutions Portfolio
- Table 8.10 BioReference: Recent Developments and Future Outlook
- Table 8.11 Foundation Medicine: Company Overview
- Table 8.12 Foundation Medicine: Cancer Biomarker Testing Solutions Portfolio
- Table 8.13 Foundation Medicine: Recent Developments and Future Outlook
- Table 8.14 OncoDNA: Company Overview
- Table 8.15 OncoDNA: Cancer Biomarker Testing Solutions Portfolio
- Table 8.16 OncoDNA: Recent Developments and Future Outlook
- Table 8.17 Q2 Solutions: Company Overview
- Table 8.18 Q2 Solutions: Cancer Biomarker Testing Solutions Portfolio
- Table 8.19 Q2 Solutions: Recent Developments and Future Outlook
- Table 8.20 Thermo Fisher Scientific: Company Overview
- Table 8.21 Thermo Fisher Scientific: Cancer Biomarker Testing Solutions Portfolio
- Table 8.22 Thermo Fisher Scientific: Recent Developments and Future Outlook
- Table 8.23 YuceBio: Company Overview
- Table 8.24 YuceBio: Cancer Biomarker Testing Solutions Portfolio
- Table 8.25 Asper Biogene: Company Overview
- Table 8.26 Asper Biogene: Cancer Biomarkers Testing Solutions Portfolio
- Table 8.27 Caris Life Sciences: Company Overview
- Table 8.28 Caris Life Sciences: Cancer Biomarkers Testing Solutions Portfolio
- Table 8.29 CeGaT: Company Overview
- Table 8.30 CeGaT: Cancer Biomarkers Testing Solutions Portfolio
- Table 8.31 Genekor Medical: Company Overview
- Table 8.32 Genekor Medical: Cancer Biomarkers Testing Solutions Portfolio
- Table 8.33 Guardant Health: Company Overview
- Table 8.34 Guardant Health: Cancer Biomarkers Testing Solutions Portfolio
- Table 8.35 Labcorp: Company Overview
- Table 8.36 Labcorp: Cancer Biomarkers Testing Solutions Portfolio
- Table 8.37 MedGenome: Company Overview
- Table 8.38 MedGenome: Cancer Biomarkers Testing Solutions Portfolio
- Table 8.39 NeoGenomics Laboratories: Company Overview
- Table 8.40 NeoGenomics Laboratories: Cancer Biomarkers Testing Solutions Portfolio
- Table 8.41 Nonacus: Company Overview
- Table 8.42 Nonacus: Cancer Biomarkers Testing Solutions Portfolio
- Table 8.43 Oxford Gene Technology: Company Overview
- Table 8.44 Oxford Gene Technology: Cancer Biomarkers Testing Solutions Portfolio
- Table 8.45 Personal Genome Diagnostics: Company Overview
- Table 8.46 Personal Genome Diagnostics: Cancer Biomarkers Testing Solutions Portfolio
- Table 8.47 PhenoPath: Company Overview
- Table 8.48 PhenoPath: Cancer Biomarkers Testing Solutions Portfolio
- Table 8.49 Positive Biosciences: Company Overview
- Table 8.50 Positive Biosciences: Cancer Biomarkers Testing Solutions Portfolio
- Table 8.51 Quest Diagnostics: Company Overview
- Table 8.52 Quest Diagnostics: Cancer Biomarkers Testing Solutions Portfolio
- Table 8.53 Tempus: Company Overview
- Table 8.54 Tempus: Cancer Biomarkers Testing Solutions Portfolio
- Table 20.1 Cell IDx: Company Snapshot
- Table 20.2 CeGat: Company Snapshot
- Table 20.3 NeoGenomics Laboratories: Company Snapshot
- Table 21.1 Cancer Biomarker Testing Solutions: Distribution by Type of Biomarker
- Table 21.2 Cancer Biomarker Testing Solutions: Distribution by Profiling Technology Used
- Table 21.3 Cancer Biomarker Testing Solutions: Distribution by Analytical Technique Used
- Table 21.4 Cancer Biomarker Testing Solutions: Distribution by Turnaround Time
- Table 21.5 Cancer Biomarker Testing Solutions: Distribution by Sample Input
- Table 21.6 Cancer Biomarker Testing Solutions: Distribution by Type of Nucleic Acid Tested
- Table 21.7 Cancer Biomarker Testing Solutions: Distribution by Type of Cancer
- Table 21.8 Cancer Biomarker Testing Solutions: Distribution by Application Area
- Table 21.9 Cancer Biomarker Testing Solution Providers: Distribution by Year of Establishment
- Table 21.10 Cancer Biomarker Testing Solution Providers: Distribution by Company Size
- Table 21.11 Cancer Biomarker Testing Solution Providers: Distribution by Location of Headquarters (Region)
- Table 21.12 Agilent: Annual Revenues, FY 2019 Onwards (USD Million)
- Table 21.13 Thermo Fisher Scientific: Annual Revenues, FY 2019 Onwards (USD Million)
- Table 21.14 Clinical Trial Analysis: Distribution by Trial Registration Year, since 2019
- Table 21.15 Clinical Trial Analysis: Distribution by Trial Status
- Table 21.16 Clinical Trial Analysis: Distribution by Trial Registration Year and Trial Status, since 2019
- Table 21.17 Clinical Trial Analysis: Distribution by Trial Phase
- Table 21.18 Clinical Trial Analysis: Distribution by Trial Registration Year and Trial Phase, since 2019
- Table 21.19 Clinical Trial Analysis: Distribution of Enrolled Patient Population by Trial Registration Year, since 2019
- Table 21.20 Clinical Trial Analysis: Distribution of Enrolled Patient Population by Trial Phase
- Table 21.21 Clinical Trial Analysis: Distribution by Type of Sponsor / Collaborator
- Table 21.22 Clinical Trial Analysis: Distribution by Study Design
- Table 21.23 Clinical Trial Analysis: Distribution by Type of Cancer
- Table 21.24 Most Active Players: Distribution by Number of Registered Trials
- Table 21.25 Clinical Trial Analysis: Distribution of Clinical Trials by Geography
- Table 21.26 Clinical Trial Analysis: Distribution of Clinical Trials by Trial Status and Geography
- Table 21.27 Clinical Trial Analysis: Distribution of Enrolled Patient Population by Geography
- Table 21.28 Clinical Trial Analysis: Distribution of Enrolled Patient Population by Trial Status and Geography
- Table 21.29 Publication Analysis: Cumulative Year-wise Trend of Publications, since 2019
- Table 21.30 Publication Analysis: Distribution by Type of Publication
- Table 21.31 Publication Analysis: Distribution by Type of Cancer
- Table 21.32 Most Popular Copyright Holders: Distribution by Number of Publications
- Table 21.33 Most Active Publishers: Distribution by Number of Publications
- Table 21.34 Key Journals: Distribution by Number of Publications
- Table 21.35 Key Journals: Distribution by Impact Factor
- Table 21.36 Benchmarking Analysis: Big Pharma players
- Table 21.37 Global Cancer Biomarkers Market, Historical Trends (since 2018) (USD Billion)
- Table 21.38 Global Cancer Biomarkers Market, Forecasted Estimates (till 2035) Conservative, Base and Optimistic Scenarios (USD Billion)
- Table 21.39 Cancer Biomarkers Market: Distribution by Type of Biomarker, 2018, 2024 and 2035 (USD Billion)
- Table 21.40 Cancer Biomarkers Market for HER2 Biomarkers: Historical Trends (since 2018) (USD Billion)
- Table 21.41 Cancer Biomarkers Market for HER2 Biomarkers: Forecasted Estimates (till 2035), Conservative, Base and Optimistic Scenarios (USD Billion)
- Table 21.42 Cancer Biomarkers Market for MET Biomarkers: Historical Trends (since 2018) (USD Billion)
- Table 21.43 Cancer Biomarkers Market for MET Biomarkers: Forecasted Estimates (till 2035), Conservative, Base and Optimistic Scenarios (USD Billion)
- Table 21.44 Cancer Biomarkers Market for EGFR Biomarkers: Historical Trends (since 2018) (USD Billion)
- Table 21.45 Cancer Biomarkers Market for EGFR Biomarkers: Forecasted Estimates (till 2035), Conservative, Base and Optimistic Scenarios (USD Billion)
- Table 21.46 Cancer Biomarkers Market for PD-L1 Biomarkers: Historical Trends (since 2018) (USD Billion)
- Table 21.47 Cancer Biomarkers Market for PD-L1 Biomarkers: Forecasted Estimates (till 2035), Conservative, Base and Optimistic Scenarios (USD Billion)
- Table 21.48 Cancer Biomarkers Market for NTRK Biomarkers: Historical Trends (since 2018) (USD Billion)
- Table 21.49 Cancer Biomarkers Market for NTRK Biomarkers: Forecasted Estimates (till 2035), Conservative, Base and Optimistic Scenarios (USD Billion)
- Table 21.50 Cancer Biomarkers Market for ALK Biomarkers: Historical Trends (since 2018) (USD Billion)
- Table 21.51 Cancer Biomarkers Market for ALK Biomarkers: Forecasted Estimates (till 2035), Conservative, Base and Optimistic Scenarios (USD Billion)
- Table 21.52 Cancer Biomarkers Market for Other Biomarkers: Historical Trends (since 2018) (USD Billion)
- Table 21.53 Cancer Biomarkers Market for Other Biomarkers: Forecasted Estimates (till 2035), Conservative, Base and Optimistic Scenarios (USD Billion)
- Table 21.54 Cancer Biomarkers Market: Distribution of Novel Biomarkers, 2018, 2024 and 2035 (USD Billion)
- Table 21.55 Cancer Biomarkers Market for SNV Biomarkers: Historical Trends (since 2018) (USD Billion)
- Table 21.56 Cancer Biomarkers Market for SNV Biomarkers: Forecasted Estimates (till 2035), Conservative, Base and Optimistic Scenarios (USD Billion)
- Table 21.57 Cancer Biomarkers Market for MSI Biomarkers: Historical Trends (since 2018) (USD Billion)
- Table 21.58 Cancer Biomarkers Market for MSI Biomarkers: Forecasted Estimates (till 2035), Conservative, Base and Optimistic Scenarios (USD Billion)
- Table 21.59 Cancer Biomarkers Market for CNV Biomarkers: Historical Trends (since 2018) (USD Billion)
- Table 21.60 Cancer Biomarkers Market for CNV Biomarkers: Forecasted Estimates (till 2035), Conservative, Base and Optimistic Scenarios (USD Billion)
- Table 21.61 Cancer Biomarkers Market for TMB Biomarkers: Historical Trends (since 2018) (USD Billion)
- Table 21.62 Cancer Biomarkers Market for TMB Biomarkers: Forecasted Estimates (till 2035), Conservative, Base and Optimistic Scenarios (USD Billion)
- Table 21.63 Cancer Biomarkers Market for TIL Biomarkers: Historical Trends (since 2018) (USD Billion)
- Table 21.64 Cancer Biomarkers Market for TIL Biomarkers: Forecasted Estimates (till 2035), Conservative, Base and Optimistic Scenarios (USD Billion)
- Table 21.65 Cancer Biomarkers Market: Distribution by Type of Cancer, 2018, 2024 and 2035 (USD Billion)
- Table 21.66 Cancer Biomarkers Market for Breast Cancer: Historical Trends (since 2018) (USD Billion)
- Table 21.67 Cancer Biomarkers Market for Breast Cancer: Forecasted Estimates (till 2035), Conservative, Base and Optimistic Scenarios (USD Billion)
- Table 21.68 Cancer Biomarkers Market for Prostate Cancer: Historical Trends (since 2018) (USD Billion)
- Table 21.69 Cancer Biomarkers Market for Prostate Cancer: Forecasted Estimates (till 2035), Conservative, Base and Optimistic Scenarios (USD Billion)
- Table 21.70 Cancer Biomarkers Market for Colorectum Cancer: Historical Trends (since 2018) (USD Billion)
- Table 21.71 Cancer Biomarkers Market for Colorectum Cancer: Forecasted Estimates (till 2035), Conservative, Base and Optimistic Scenarios (USD Billion)
- Table 21.72 Cancer Biomarkers Market for Lung Cancer: Historical Trends (since 2018) (USD Billion)
- Table 21.73 Cancer Biomarkers Market for Lung Cancer: Forecasted Estimates (till 2035), Conservative, Base and Optimistic Scenarios (USD Billion)
- Table 21.74 Cancer Biomarkers Market for Thyroid Cancer: Historical Trends (since 2018) (USD Billion)
- Table 21.75 Cancer Biomarkers Market for Thyroid Cancer: Forecasted Estimates (till 2035), Conservative, Base and Optimistic Scenarios (USD Billion)
- Table 21.76 Cancer Biomarkers Market for Bladder Cancer: Historical Trends (since 2018) (USD Billion)
- Table 21.77 Cancer Biomarkers Market for Bladder Cancer: Forecasted Estimates (till 2035), Conservative, Base and Optimistic Scenarios (USD Billion)
- Table 21.78 Cancer Biomarkers Market for Melanoma: Historical Trends (since 2018) (USD Billion)
- Table 21.79 Cancer Biomarkers Market for Melanoma: Forecasted Estimates (till 2035), Conservative, Base and Optimistic Scenarios (USD Billion)
- Table 21.80 Cancer Biomarkers Market for Non-Hodgkin Lymphoma: Historical Trends (since 2018) (USD Billion)
- Table 21.81 Cancer Biomarkers Market for Non-Hodgkin Lymphoma: Forecasted Estimates (till 2035), Conservative, Base and Optimistic Scenarios (USD Billion)
- Table 21.82 Cancer Biomarkers Market for Endometrial Cancer: Historical Trends (since 2018) (USD Billion)
- Table 21.83 Cancer Biomarkers Market for Endometrial Cancer: Forecasted Estimates (till 2035), Conservative, Base and Optimistic Scenarios (USD Billion)
- Table 21.84 Cancer Biomarkers Market for Kidney Cancer: Historical Trends (since 2018) (USD Billion)
- Table 21.85 Cancer Biomarkers Market for Kidney Cancer: Forecasted Estimates (till 2035), Conservative, Base and Optimistic Scenarios (USD Billion)
- Table 21.86 Cancer Biomarkers Market for Leukemia: Historical Trends (since 2018) (USD Billion)
- Table 21.87 Cancer Biomarkers Market for Leukemia: Forecasted Estimates (till 2035), Conservative, Base and Optimistic Scenarios (USD Billion)
- Table 21.88 Cancer Biomarkers Market: Distribution by Key Geographical Regions, 2018, 2024 and 2035 (USD Billion)
- Table 21.89 Cancer Biomarkers Market in North America: Historical Trends (since 2018) (USD Billion)
- Table 21.90 Cancer Biomarkers Market in North America: Forecasted Estimates (till 2035), Conservative, Base and Optimistic Scenarios (USD Billion)
- Table 21.91 Cancer Biomarkers Market in the US: Historical Trends (since 2018) (USD Billion)
- Table 21.92 Cancer Biomarkers Market in the US: Forecasted Estimates (till 2035), Conservative, Base and Optimistic Scenarios (USD Billion)
- Table 21.93 Cancer Biomarkers Market in Canada: Historical Trends (since 2018) (USD Billion)
- Table 21.94 Cancer Biomarkers Market in Canada: Forecasted Estimates (till 2035), Conservative, Base and Optimistic Scenarios (USD Billion)
- Table 21.95 Cancer Biomarkers Market in Europe: Historical Trends (since 2018) (USD Billion)
- Table 21.96 Cancer Biomarkers Market in Europe: Forecasted Estimates (till 2035), Conservative, Base and Optimistic Scenarios (USD Billion)
- Table 21.97 Cancer Biomarkers Market in the UK: Historical Trends (since 2018) (USD Billion)
- Table 21.98 Cancer Biomarkers Market in the UK: Forecasted Estimates (till 2035), Conservative, Base and Optimistic Scenarios (USD Billion)
- Table 21.99 Cancer Biomarkers Market in Germany: Historical Trends (since 2018) (USD Billion)
- Table 21.100 Cancer Biomarkers Market in Germany: Forecasted Estimates (till 2035), Conservative, Base and Optimistic Scenarios (USD Billion)
- Table 21.101 Cancer Biomarkers Market in France: Historical Trends (since 2018) (USD Billion)
- Table 21.102 Cancer Biomarkers Market in France: Forecasted Estimates (till 2035), Conservative, Base and Optimistic Scenarios (USD Billion)
- Table 21.103 Cancer Biomarkers Market in Spain: Historical Trends (since 2018) (USD Billion)
- Table 21.104 Cancer Biomarkers Market in Spain: Forecasted Estimates (till 2035), Conservative, Base and Optimistic Scenarios (USD Billion)
- Table 21.105 Cancer Biomarkers Market in Italy: Historical Trends (since 2018) (USD Billion)
- Table 21.106 Cancer Biomarkers Market in Italy: Forecasted Estimates (till 2035), Conservative, Base and Optimistic Scenarios (USD Billion)
- Table 21.107 Cancer Biomarkers Market in Asia-Pacific: Historical Trends (since 2018) (USD Billion)
- Table 21.108 Cancer Biomarkers Market in Asia-Pacific: Forecasted Estimates (till 2035), Conservative, Base and Optimistic Scenarios (USD Billion)
- Table 21.109 Cancer Biomarkers Market in China: Historical Trends (since 2018) (USD Billion)
- Table 21.110 Cancer Biomarkers Market in China: Forecasted Estimates (till 2035), Conservative, Base and Optimistic Scenarios (USD Billion)
- Table 21.111 Cancer Biomarkers Market in Japan: Historical Trends (since 2018) (USD Billion)
- Table 21.112 Cancer Biomarkers Market in Japan: Forecasted Estimates (till 2035), Conservative, Base and Optimistic Scenarios (USD Billion)
- Table 21.113 Cancer Biomarkers Market in India: Historical Trends (since 2018) (USD Billion)
- Table 21.114 Cancer Biomarkers Market in India: Forecasted Estimates (till 2035), Conservative, Base and Optimistic Scenarios (USD Billion)
- Table 21.115 Cancer Biomarkers Market in Australia: Historical Trends (since 2018) (USD Billion)
- Table 21.116 Cancer Biomarkers Market in Australia: Forecasted Estimates (till 2035), Conservative, Base and Optimistic Scenarios (USD Billion)
- Table 21.117 Cancer Biomarkers Market in South Korea: Historical Trends (since 2018) (USD Billion)
- Table 21.118 Cancer Biomarkers Market in South Korea: Forecasted Estimates (till 2035), Conservative, Base and Optimistic Scenarios (USD Billion)
- Table 21.119 Cancer Biomarkers Market in New Zealand: Historical Trends (since 2018) (USD Billion)
- Table 21.120 Cancer Biomarkers Market in New Zealand: Forecasted Estimates (till 2035), Conservative, Base and Optimistic Scenarios (USD Billion)
- Table 21.121 Cancer Biomarkers Market in Rest of the World: Historical Trends (since 2018) (USD Billion)
- Table 21.122 Cancer Biomarkers Market in Rest of the World: Forecasted Estimates (till 2035), Conservative, Base and Optimistic Scenarios (USD Billion)
- Table 21.123 Cancer Biomarkers Market in Brazil: Historical Trends (since 2018) (USD Billion)
- Table 21.124 Cancer Biomarkers Market in Brazil: Forecasted Estimates (till 2035), Conservative, Base and Optimistic Scenarios (USD Billion)
- Table 21.125 Cancer Biomarkers Market in Argentina: Historical Trends (since 2018) (USD Billion)
- Table 21.126 Cancer Biomarkers Market in Argentina: Forecasted Estimates (till 2035), Conservative, Base and Optimistic Scenarios (USD Billion)
- Table 21.127 Cancer Biomarkers Market in Chile: Historical Trends (since 2018) (USD Billion)
- Table 21.128 Cancer Biomarkers Market in Chile: Forecasted Estimates (till 2035), Conservative, Base and Optimistic Scenarios (USD Billion)
- Table 21.129 Cancer Biomarkers Market in Egypt: Historical Trends (since 2018) (USD Billion)
- Table 21.130 Cancer Biomarkers Market in Egypt: Forecasted Estimates (till 2035), Conservative, Base and Optimistic Scenarios (USD Billion)
List of Figures
- Figure 2.1 Research Methodology: Project Methodology
- Figure 2.2 Research Methodology: Forecast Methodology
- Figure 2.3 Research Methodology: Robust Quality Control
- Figure 2.4 Research Methodology: Key Market Segmentation
- Figure 3.1 Lessons Learnt from Past Recessions
- Figure 4.1 Executive Summary: Current Market Landscape (I/II)
- Figure 4.2 Executive Summary: Current Market Landscape (II/II)
- Figure 4.3 Executive Summary: Clinical Trial Analysis
- Figure 4.4 Executive Summary: Publication Analysis
- Figure 4.5 Executive Summary: Market Forecast and Opportunity Analysis
- Figure 6.1 Cancer Biomarker Testing Solutions: Distribution by Type of Biomarker
- Figure 6.2 Cancer Biomarker Testing Solutions: Distribution by Profiling Technology Used
- Figure 6.3 Cancer Biomarker Testing Solutions: Distribution by Analytical Technique Used
- Figure 6.4 Cancer Biomarker Testing Solutions: Distribution by Turnaround Time
- Figure 6.5 Cancer Biomarker Testing Solutions: Distribution by Sample Input
- Figure 6.6 Cancer Biomarker Testing Solutions: Distribution by Type of Nucleic Acid Tested
- Figure 6.7 Cancer Biomarker Testing Solutions: Distribution by Type of Cancer
- Figure 6.8 Cancer Biomarker Testing Solutions: Distribution by Application Area
- Figure 6.9 Cancer Biomarker Testing Solution Providers: Distribution by Year of Establishment
- Figure 6.10 Cancer Biomarker Testing Solution Providers: Distribution by Company Size
- Figure 6.11 Cancer Biomarker Testing Solution Providers: Distribution by Location of Headquarters (Region)
- Figure 7.1 Product Competitiveness Analysis: Cancer Biomarker Testing Solutions Offered by Players based in North America
- Figure 7.2 Product Competitiveness Analysis: Cancer Biomarker Testing Solutions Offered by Players based in Europe
- Figure 7.3 Product Competitiveness Analysis: Cancer Biomarker Testing Solutions Offered by Players based in Asia-Pacific
- Figure 8.1 Agilent: Annual Revenues, FY 2019 Onwards (USD Million)
- Figure 8.2 Thermo Fisher Scientific: Annual Revenues, FY 2019 Onwards (USD Million)
- Figure 9.1 Enrichment Clinical Trial Design: Steps Involved
- Figure 9.2 All-Comers Clinical Trial Design: Steps Involved
- Figure 9.3 Hybrid Clinical Trial Design: Steps Involved
- Figure 9.4 Adaptive Clinical Trial Design: Steps Involved
- Figure 10.1 Clinical Trial Analysis: Distribution by Trial Registration Year, since 2019
- Figure 10.2 Clinical Trial Analysis: Distribution by Trial Status
- Figure 10.3 Clinical Trial Analysis: Distribution by Trial Registration Year and Trial Status, since 2019
- Figure 10.4 Clinical Trial Analysis: Distribution by Trial Phase
- Figure 10.5 Clinical Trial Analysis: Distribution by Trial Registration Year and Trial Phase, since 2019
- Figure 10.6 Clinical Trial Analysis: Distribution of Enrolled Patient Population by Trial Registration Year, since 2019
- Figure 10.7 Clinical Trial Analysis: Distribution of Enrolled Patient Population by Trial Phase
- Figure 10.8 Clinical Trial Analysis: Distribution by Type of Sponsor / Collaborator
- Figure 10.9 Clinical Trial Analysis: Distribution by Study Design
- Figure 10.10 Clinical Trial Analysis: Distribution by Type of Cancer
- Figure 10.11 Most Active Players: Distribution by Number of Registered Trials
- Figure 10.12 Clinical Trial Analysis: Distribution of Clinical Trials by Geography
- Figure 10.13 Clinical Trial Analysis: Distribution of Clinical Trials by Trial Status and Geography
- Figure 10.14 Clinical Trial Analysis: Distribution of Enrolled Patient Population by Geography
- Figure 10.15 Clinical Trial Analysis: Distribution of Enrolled Patient Population by Trial Status and Geography
- Figure 11.1 Publication Analysis: Cumulative Year-wise Trend of Publications, since 2019
- Figure 11.2 Publication Analysis: Distribution by Type of Publication
- Figure 11.3 Publication Analysis: Distribution by Type of Cancer
- Figure 11.4 Most Popular Copyright Holders: Distribution by Number of Publications
- Figure 11.5 Word Cloud Analysis: Emerging Focus Areas
- Figure 11.6 Most Active Publishers: Distribution by Number of Publications
- Figure 11.7 Key Journals: Distribution by Number of Publications
- Figure 11.8 Key Journals: Distribution by Impact Factor
- Figure 12.1 Spider Web Analysis: Abbott
- Figure 12.2 Spider Web Analysis: AbbVie
- Figure 12.3 Spider Web Analysis: Amgen
- Figure 12.4 Spider Web Analysis: AstraZeneca
- Figure 12.5 Spider Web Analysis: Bayer
- Figure 12.6 Spider Web Analysis: Boehringer Ingelheim
- Figure 12.7 Spider Web Analysis: Bristol-Myers Squib
- Figure 12.8 Spider Web Analysis: Eli Lilly
- Figure 12.9 Spider Web Analysis: Gilead
- Figure 12.10 Spider Web Analysis:
GlaxoSmithKline
- Figure 12.11 Spider Web Analysis: Merck
- Figure 12.12 Spider Web Analysis: Novartis
- Figure 12.13 Spider Web Analysis: Pfizer
- Figure 12.14 Spider Web Analysis: Roche
- Figure 12.15 Spider Web Analysis: Sanofi
- Figure 12.16 Benchmarking Analysis: Big Pharma players
- Figure 13.1 Companion Diagnostics: Value Chain
- Figure 13.2 Cost Distribution Across Value Chain
- Figure 13.3 Costs Associated with Research and Product Development
- Figure 13.4 Costs Associated with Manufacturing and Assembly
- Figure 13.5 Costs Associated with Clinical Trials, FDA Approval and Other Administrative Tasks
- Figure 13.6 Costs Associated with Payer Negotiation and KOL Engagement
- Figure 13.7 Costs Associated with Marketing and Sales
- Figure 14.1 Cancer Biomarkers Market: Future Growth Opportunities
- Figure 15.1 Global Cancer Biomarkers Market, Historical Trends (since 2018) and Forecasted Estimates (till 2035) (USD Billion)
- Figure 15.2 Global Cancer Biomarkers Market, Forecasted Estimates (till 2035): Conservative Scenario (USD Billion)
- Figure 15.3 Global Cancer Biomarkers Market, Forecasted Estimates (till 2035): Optimistic Scenario (USD Billion)
- Figure 16.1 Cancer Biomarkers Market: Distribution by Type of Biomarker, 2018, 2024 and 2035
- Figure 16.2 Cancer Biomarkers Market for HER2 Biomarkers, Historical Trends (since 2018) and Forecasted Estimates (till 2035) (USD Billion)
- Figure 16.3 Cancer Biomarkers Market for MET Biomarkers, Historical Trends (since 2018) and Forecasted Estimates (till 2035) (USD Billion)
- Figure 16.4 Cancer Biomarkers Market for EGFR Biomarkers, Historical Trends (since 2018) and Forecasted Estimates (till 2035) (USD Billion)
- Figure 16.5 Cancer Biomarkers Market for PD-L1 Biomarkers, Historical Trends (since 2018) and Forecasted Estimates (till 2035) (USD Billion)
- Figure 16.6 Cancer Biomarkers Market for NTRK Biomarkers, Historical Trends (since 2018) and Forecasted Estimates (till 2035) (USD Billion)
- Figure 16.7 Cancer Biomarkers Market for ALK Biomarkers, Historical Trends (since 2018) and Forecasted Estimates (till 2035) (USD Billion)
- Figure 16.8 Cancer Biomarkers Market for Other Biomarkers, Historical Trends (since 2018) and Forecasted Estimates (till 2035) (USD Billion)
- Figure 16.9 Cancer Biomarkers Market: Distribution of Novel Biomarkers, 2018, 2024 and 2035
- Figure 16.10 Cancer Biomarkers Market for SNV Biomarkers, Historical Trends (since 2018) and Forecasted Estimates (till 2035) (USD Billion)
- Figure 16.11 Cancer Biomarkers Market for MSI Biomarkers, Historical Trends (since 2018) and Forecasted Estimates (till 2035) (USD Billion)
- Figure 16.12 Cancer Biomarkers Market for CNV Biomarkers, Historical Trends (since 2018) and Forecasted Estimates (till 2035) (USD Billion)
- Figure 16.13 Cancer Biomarkers Market for TMB Biomarkers, Historical Trends (since 2018) and Forecasted Estimates (till 2035) (USD Billion)
- Figure 16.14 Cancer Biomarkers Market for TIL Biomarkers, Historical Trends (since 2018) and Forecasted Estimates (till 2035) (USD Billion)
- Figure 17.1 Cancer Biomarkers Market: Distribution by Type of Cancer, 2018, 2024 and 2035
- Figure 17.2 Cancer Biomarkers Market for Breast Cancer, Historical Trends (since 2018) and Forecasted Estimates (till 2035) (USD Billion)
- Figure 17.3 Cancer Biomarkers Market for Prostate Cancer, Historical Trends (since 2018) and Forecasted Estimates (till 2035) (USD Billion)
- Figure 17.4 Cancer Biomarkers Market for Colorectum Cancer, Historical Trends (since 2018) and Forecasted Estimates (till 2035) (USD Billion)
- Figure 17.5 Cancer Biomarkers Market for Lung Cancer, Historical Trends (since 2018) and Forecasted Estimates (till 2035) (USD Billion)
- Figure 17.6 Cancer Biomarkers Market for Thyroid Cancer, Historical Trends (since 2018) and Forecasted Estimates (till 2035) (USD Billion)
- Figure 17.7 Cancer Biomarkers Market for Bladder Cancer, Historical Trends (since 2018) and Forecasted Estimates (till 2035) (USD Billion)
- Figure 17.8 Cancer Biomarkers Market for Melanoma, Historical Trends (since 2018) and Forecasted Estimates (till 2035) (USD Billion)
- Figure 17.9 Cancer Biomarkers Market for Non-Hodgkin Lymphoma, Historical Trends (since 2018) and Forecasted Estimates (till 2035) (USD Billion)
- Figure 17.10 Cancer Biomarkers Market for Endometrial Cancer, Historical Trends (since 2018) and Forecasted Estimates (till 2035) (USD Billion)
- Figure 17.11 Cancer Biomarkers Market for Kidney Cancer, Historical Trends (since 2018) and Forecasted Estimates (till 2035) (USD Billion)
- Figure 17.4 Cancer Biomarkers Market for Leukemia, Historical Trends (since 2018) and Forecasted Estimates (till 2035) (USD Billion)
- Figure 18.1 Cancer Biomarkers Market: Distribution by Key Geographical Regions, 2018, 2024 and 2035
- Figure 18.2 Cancer Biomarkers Market in North America, Historical Trends (since 2018) and Forecasted Estimates (till 2035) (USD Billion)
- Figure 18.3 Cancer Biomarkers Market in the US, Historical Trends (since 2018) and Forecasted Estimates (till 2035) (USD Billion)
- Figure 18.4 Cancer Biomarkers Market in Canada, Historical Trends (since 2018) and Forecasted Estimates (till 2035) (USD Billion)
- Figure 18.5 Cancer Biomarkers Market in Europe, Historical Trends (since 2018) and Forecasted Estimates (till 2035) (USD Billion)
- Figure 18.6 Cancer Biomarkers Market in the UK, Historical Trends (since 2018) and Forecasted Estimates (till 2035) (USD Billion)
- Figure 18.7 Cancer Biomarkers Market in Germany, Historical Trends (since 2018) and Forecasted Estimates (till 2035) (USD Billion)
- Figure 18.8 Cancer Biomarkers Market in France, Historical Trends (since 2018) and Forecasted Estimates (till 2035) (USD Billion)
- Figure 18.9 Cancer Biomarkers Market in Spain, Historical Trends (since 2018) and Forecasted Estimates (till 2035) (USD Billion)
- Figure 18.10 Cancer Biomarkers Market in Italy, Historical Trends (since 2018) and Forecasted Estimates (till 2035) (USD Billion)
- Figure 18.11 Cancer Biomarkers Market in Asia-Pacific, Historical Trends (since 2018) and Forecasted Estimates (till 2035) (USD Billion)
- Figure 18.12 Cancer Biomarkers Market in China, Historical Trends (since 2018) and Forecasted Estimates (till 2035) (USD Billion)
- Figure 18.13 Cancer Biomarkers Market in Japan, Historical Trends (since 2018) and Forecasted Estimates (till 2035) (USD Billion)
- Figure 18.14 Cancer Biomarkers Market in India, Historical Trends (since 2018) and Forecasted Estimates (till 2035) (USD Billion)
- Figure 18.15 Cancer Biomarkers Market in Australia, Historical Trends (since 2018) and Forecasted Estimates (till 2035) (USD Billion)
- Figure 18.16 Cancer Biomarkers Market in South Korea, Historical Trends (since 2018) and Forecasted Estimates (till 2035) (USD Billion)
- Figure 18.17 Cancer Biomarkers Market in New Zealand, Historical Trends (since 2018) and Forecasted Estimates (till 2035) (USD Billion)
- Figure 18.18 Cancer Biomarkers Market in Rest of the World, Historical Trends (since 2018) and Forecasted Estimates (till 2035) (USD Billion)
- Figure 18.19 Cancer Biomarkers Market in Brazil, Historical Trends (since 2018) and Forecasted Estimates (till 2035) (USD Billion)
- Figure 18.20 Cancer Biomarkers Market in Argentina, Historical Trends (since 2018) and Forecasted Estimates (till 2035) (USD Billion)
- Figure 18.21 Cancer Biomarkers Market in Chile, Historical Trends (since 2018) and Forecasted Estimates (till 2035) (USD Billion)
- Figure 18.22 Cancer Biomarkers Market in Egypt, Historical Trends (since 2018) and Forecasted Estimates (till 2035) (USD Billion)
- Figure 19.1 Concluding Remarks: Market Landscape
- Figure 19.2 Concluding Remarks: Clinical Trial Analysis
- Figure 19.3 Concluding Remarks: Publication Analysis
- Figure 19.4 Concluding Remarks: Market Forecast and Opportunity Analysis
 粒细胞集落刺激因子(GNLY)市场报告:趋势、预测和竞争分析(至2035年)
 儿童癌症生物标记市场-全球产业规模、份额、趋势、机会及预测(按适应症、类型、最终用途、地区和竞争格局划分,2021-2031年)
 全球癌症生物标记市场:市场规模、占有率、成长率、产业分析、依类型、应用和地区划分的考量因素以及未来预测(2026-2034)
 日本癌症生物标记市场报告(按分析技术、生物分子、癌症类型、应用、最终用户和地区划分,2026-2034)
 肿瘤血液检测市场按生物标记类型、技术、临床应用、癌症类型、最终用户和地区划分
 癌症生物标记市场分析及预测(至 2034 年):类型、产品、服务、技术、应用、最终用户、安装类型、功能、阶段2025 年至 2033 年癌症生物标记市场报告(按分析技术、生物分子、癌症类型、应用、最终用户和地区划分)
 癌症生物标记市场规模、份额、成长分析(按分析技术、按癌症类型、按产品、按应用、按最终用户、按地区)—2025 年至 2032 年行业预测PIVKA II 抗原市场报告:2031 年趋势、预测与竞争分析
 癌症生物标记市场机会、成长动力、产业趋势分析及 2025 - 2034 年预测