


 |
市场调查报告书
商品编码
1725775
汽车用天然气市场 (~2035年):燃料类型·车辆类型·终端用户·流通管道·各地区的产业趋势与全球预测Automotive Natural Gas Vehicle Market, Till 2035: Distribution by Type of Fuel, Type of Vehicle, End-User, Type of Distribution Channel and Geographical Regions: Industry Trends and Global Automotive Natural Gas Vehicle Market Forecasts |
||||||
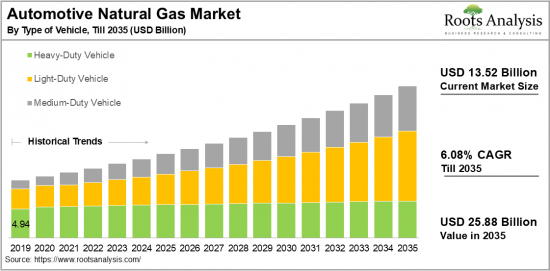
预计到2035年,全球天然气汽车市场规模将从目前的135.2亿美元增长至258.8亿美元,预测期内复合年增长率为6.08%。
汽车用天然气的市场机会:各市场区隔
各燃料类型
- 压缩天然气
- 液化天然气
各车辆类型
- 重型车
- 小型车
- 中型车
各服务形式
- 工程服务
- 安装·设计服务
- 维修服务
- 管理·服务
- 其他
各终端用户
- 汽车·运输
- 建设
- 电器及电子
- 包装
- 其他
各流通管道
- 直销
- 分销商
- 零售业者
各地区
- 北美
- 美国
- 加拿大
- 墨西哥
- 其他的北美各国
- 欧洲
- 奥地利
- 比利时
- 丹麦
- 法国
- 德国
- 爱尔兰
- 义大利
- 荷兰
- 挪威
- 俄罗斯
- 西班牙
- 瑞典
- 瑞士
- 英国
- 其他欧洲各国
- 亚洲
- 中国
- 印度
- 日本
- 新加坡
- 韩国
- 其他亚洲各国
- 南美
- 巴西
- 智利
- 哥伦比亚
- 委内瑞拉
- 其他的南美各国
- 中东·北非
- 埃及
- 伊朗
- 伊拉克
- 以色列
- 科威特
- 沙乌地阿拉伯
- UAE
- 其他的中东·北非各国
- 全球其他地区
- 澳洲
- 纽西兰
- 其他的国家
天然气汽车市场:成长与趋势
2024年,印度CNG(压缩天然气)汽车的普及率显着增加2019 年,天然气汽车销量较去年同期成长 33%。全球天然气汽车市场的成长得益于多种因素,其中之一就是低排放和二氧化碳减排,这使其成为具有环保意识的消费者和企业的理想选择。与绿色氨一样,天然气也正在成为重要的替代燃料。
此外,与传统的汽油和柴油汽车相比,天然气汽车的二氧化碳排放量更低,这使其成为减少温室气体排放和遵守更严格环保标准的明智之选。天然气汽车的技术进步,尤其是在提高引擎效率和延长续航里程方面,使其更具吸引力。
随着创新和技术进步,车用天然气领域也在不断变化,这有助于天然气成为更有效率、性能更高的汽车燃料。值得注意的技术创新包括先进涡轮增压器、直喷系统和电子引擎管理系统的引入。全球向清洁能源的转型也推动了天然气汽车的普及。尤其是低碳排放且经济优势显着的 CNG(压缩天然气)日益受到人们的青睐,这是关键的发展趋势之一。
本报告提供全球汽车用天然气的市场调查、彙整市场概要,背景,市场影响因素的分析,市场规模的转变·预测,各种区分·各地区的详细分析,竞争情形,主要企业简介等资讯。
目录
章节I:报告概要
第1章 序文
第2章 调查手法
第3章 市场动态
第4章 宏观经济指标
章节II:定性的洞察
第5章 摘要整理
第6章 简介
第7章 法规情势
章节III:市场概要
第8章 主要企业的总括的资料库
第9章 竞争情形
第10章 閒置频段分析
第11章 竞争分析
第12章 汽车用天然气车市场上Start-Ups生态系统
章节IV:企业简介
第13章 企业简介
- AB Volvo
- Beiqi Foton Motor
- BMW
- CNH Industrial
- Cummins
- Daimler
- Dongfeng Motors
- Ford Motors
- Honda Motors
- Mercedes-Benz
- Mitsubishi Motors
- Navistar International
- Nissan Motors
- Quantum Fuel Systems
- Shaanxi Automobile
- Tata Motors
- Toyota Motor
- Volkswagen
- Westport Fuel Systems
章节V:市场趋势
第14章 大趋势分析
第15章 未满足需求的分析
第16章 专利分析
第17章 最近的趋势
章节VI:市场机会分析
第18章 全球汽车用天然气市场
第19章 各燃料类型的市场机会
第20章 各车辆类型的市场机会
第21章 各终端用户的市场机会
第22章 各流通管道的市场机会
第23章 北美汽车用天然气的市场机会
第24章 欧洲的汽车用天然气的市场机会
第25章 亚洲的汽车用天然气的市场机会
第26章 中东·北非的汽车用天然气的市场机会
第27章 南美的汽车用天然气的市场机会
第28章 全球其他地区的汽车用天然气的市场机会
第29章 市场集中分析:各主要企业分布
第30章 邻近市场分析
章节VII:策略工具
第31章 主要成功策略
第32章 波特的五力分析
第33章 SWOT分析
第34章 价值链分析
第35章 ROOTS的策略性建议
章节VIII:其他的垄断的见解
第36章 一手资料研究洞察
第37章 报告书的结论
章节IX:附录
第38章 表格形式资料
第39章 企业·团体一览
第40章 客制化的机会
第41章 ROOTS的订阅服务
第42章 着者详细内容
Automotive Natural Gas Vehicle Market Overview
As per Roots Analysis, the global automotive natural gas vehicle market size is estimated to grow from USD 13.52 billion in the current year to USD 25.88 billion by 2035, at a CAGR of 6.08% during the forecast period, till 2035.
The opportunity for automotive natural gas vehicle market has been distributed across the following segments:
Type of Fuel
- Compressed Natural Gas
- Liquefied Natural Gas
Type of Vehicle
- Heavy-duty Vehicle
- Light-duty Vehicle
- Medium-duty Vehicle
Type of Services
- Engineering Services
- Installation and Design Services
- Maintenance Services
- Managed Services
- Others
End-User
- Automotive and Transportation
- Construction
- Electrical & Electronics
- Packaging
- Others
Type of Distribution Channel
- Direct Sales
- Distributor
- Retailer
Geographical Regions
- North America
- US
- Canada
- Mexico
- Other North American countries
- Europe
- Austria
- Belgium
- Denmark
- France
- Germany
- Ireland
- Italy
- Netherlands
- Norway
- Russia
- Spain
- Sweden
- Switzerland
- UK
- Other European countries
- Asia
- China
- India
- Japan
- Singapore
- South Korea
- Other Asian countries
- Latin America
- Brazil
- Chile
- Colombia
- Venezuela
- Other Latin American countries
- Middle East and North Africa
- Egypt
- Iran
- Iraq
- Israel
- Kuwait
- Saudi Arabia
- UAE
- Other MENA countries
- Rest of the World
- Australia
- New Zealand
- Other countries
AUTOMOTIVE NATURAL GAS VEHICLE MARKET: GROWTH AND TRENDS
In 2024, India witnessed a significant rise in the adoption of CNG vehicles, with sales increasing by 33% compared to the previous year. The growth of the global automotive natural gas market can be attributed to several factors, one of which is its lower emissions and reduced carbon footprints, making it a good choice for environmentally conscious consumers and businesses. Similar to green ammonia, natural gas has also established itself as a key alternative fuel.
Moreover, it provides a smaller carbon footprint in comparison to conventional gasoline or diesel vehicles, making it an appealing option for cutting greenhouse gas emissions and complying with stricter environmental standards. It is important to emphasize that advancements in natural gas vehicle technology, such as enhanced engine efficiency and extended range, make them more attractive.
The automotive natural gas vehicle sector is in a state of constant transformation, propelled by innovation and technological progress. This transition has contributed to the development of natural gas as a more efficient and high-performance fuel for vehicles. Additionally, some of the technological breakthroughs include the adoption of advanced turbocharging, direct injection systems, and electronic engine management systems. Another significant advancement is the global move towards cleaner energy sources, resulting in a wider acceptance of compressed natural gas (CNG) due to its lower carbon footprint and economic viability.
AUTOMOTIVE NATURAL GAS VEHICLE MARKET: KEY SEGMENTS
Market Share by Type of Fuel
Based on the type of fuel, the global automotive natural gas vehicle market is segmented into compressed natural gas and liquefied natural gas. According to our estimates, currently, compressed natural gas segment captures the majority share of the market. This can be attributed to its benefits, such as lower fuel expenses, decreased emissions, and its compatibility with existing infrastructure.
However, the liquefied natural gas segment is anticipated to grow at a higher CAGR during the forecast period. This is due to the increasing demand for cleaner and more efficient fuel alternatives, spurred by strict environmental regulations and a worldwide shift toward sustainability, which is driving the uptake of LNG vehicles.
Market Share by Type of Vehicle
Based on type of vehicle, the automotive natural gas vehicle market is segmented into heavy-duty vehicles, light-duty vehicles and medium-duty vehicles. According to our estimates, currently, light-duty vehicles segment captures the majority share of the market. Further, this segment is anticipated to experience the highest growth rate during the forecast period. This growth can be attributed to the appeal of cost savings and the environmental advantages of utilizing compressed natural gas (CNG) for individual consumers and small businesses. Additionally, the infrastructure for CNG refueling is more developed in regions where light-duty vehicles are commonly used.
Market Share by End-User
Based on end-users, the automotive natural gas vehicle market is segmented into automotive and transportation, construction, electrical & electronics, packaging and others. According to our estimates, currently, automotive and transportation segment captures the majority share of the market. Further, this segment is anticipated to experience the highest CAGR during the forecast period. This growth can be attributed to the strong demand for natural gas vehicles, such as buses and trucks, primarily due to their role as a cleaner alternative fuel and their cost advantages over conventional fuels.
Market Share by Type of Distribution Channel
Based on type of distribution channel, the automotive natural gas vehicle market is segmented into direct sales, distributor and retailer.. According to our estimates, currently, distributor segment captures the majority share of the market. Moreover, this segment is anticipated to experience the highest CAGR during the forecast period. This is primarily due to their capability to effectively manage the supply chain and engage a broader customer audience, as well as their well-established networks that facilitate connections between manufacturers, retailers, and end-users.
Market Share by Geographical Regions
Based on geographical regions, the automotive natural gas vehicle market is segmented into North America, Europe, Asia, Latin America, Middle East and North Africa, and Rest of the World. According to our estimates, currently, Asia captures the majority share of the market. This can be attributed to several factors, including vast number of vehicles, rising environmental concerns, and favorable government policies aimed at decreasing reliance on imported oil and enhancing air quality, especially in developing nations like China and India.
However, the market in North America is anticipated to grow at a higher CAGR during the forecast period, driven by increasing consumer awareness and a transition toward sustainable fuel sources.
Example Players in Automotive Natural Gas Vehicle Market
- AB Volvo
- Beiqi Foton Motor
- BMW
- CNH Industrial
- Cummins
- Daimler
- Dongfeng Motors
- Ford Motors
- Honda Motors
- Mercedes-Benz
- Mitsubishi Motors
- Navistar International
- Nissan Motors
- Quantum Fuel Systems
- Shaanxi Automobile
- Tata Motors
- Toyota Motor
- Volkswagen
- Westport Fuel Systems
AUTOMOTIVE NATURAL GAS VEHICLE MARKET: RESEARCH COVERAGE
The report on the automotive natural gas vehicle market features insights on various sections, including:
- Market Sizing and Opportunity Analysis: An in-depth analysis of the automotive natural gas vehicle market, focusing on key market segments, including [A] type of fire protection system, [B] type of fuel, [C] type of vehicle, [D] end-user, [E] type of distribution channel, and [F] geographical regions.
- Competitive Landscape: A comprehensive analysis of the companies engaged in the automotive natural gas vehicle market, based on several relevant parameters, such as [A] year of establishment, [B] company size, [C] location of headquarters and [D] ownership structure.
- Company Profiles: Elaborate profiles of prominent players engaged in the automotive natural gas vehicle market, providing details on [A] location of headquarters, [B]company size, [C] company mission, [D] company footprint, [E] management team, [F] contact details, [G] financial information, [H] operating business segments, [I] automotive natural gas vehicle portfolio, [J] moat analysis, [K] recent developments, and an informed future outlook.
- Recent Developments: An overview of the recent developments made in the automotive natural gas vehicle market, along with analysis based on relevant parameters, including [A] year of initiative, [B] type of initiative, [C] geographical distribution and [D] most active players.
- Porter's Five Forces Analysis: An analysis of five competitive forces prevailing in the automotive natural gas vehicle market, including threats of new entrants, bargaining power of buyers, bargaining power of suppliers, threats of substitute products and rivalry among existing competitors.
- SWOT Analysis: An insightful SWOT framework, highlighting the strengths, weaknesses, opportunities and threats in the domain. Additionally, it provides Harvey ball analysis, highlighting the relative impact of each SWOT parameter.
KEY QUESTIONS ANSWERED IN THIS REPORT
- How many companies are currently engaged in the automotive natural gas vehicle market?
- Which are the leading companies in this market?
- What factors are likely to influence the evolution of this market?
- What is the current and future market size?
- What is the CAGR of this market?
- How is the current and future market opportunity likely to be distributed across key market segments?
REASONS TO BUY THIS REPORT
- The report provides a comprehensive market analysis, offering detailed revenue projections of the overall market and its specific sub-segments. This information is valuable to both established market leaders and emerging entrants.
- Stakeholders can leverage the report to gain a deeper understanding of the competitive dynamics within the market. By analyzing the competitive landscape, businesses can make informed decisions to optimize their market positioning and develop effective go-to-market strategies.
- The report offers stakeholders a comprehensive overview of the market, including key drivers, barriers, opportunities, and challenges. This information empowers stakeholders to stay abreast of market trends and make data-driven decisions to capitalize on growth prospects.
ADDITIONAL BENEFITS
- Complimentary Excel Data Packs for all Analytical Modules in the Report
- 10% Free Content Customization
- Detailed Report Walkthrough Session with Research Team
- Free Updated report if the report is 6-12 months old or older
TABLE OF CONTENTS
SECTION I: REPORT OVERVIEW
1. PREFACE
- 1.1. Introduction
- 1.2. Market Share Insights
- 1.3. Key Market Insights
- 1.4. Report Coverage
- 1.5. Key Questions Answered
- 1.6. Chapter Outlines
2. RESEARCH METHODOLOGY
- 2.1. Chapter Overview
- 2.2. Research Assumptions
- 2.3. Database Building
- 2.3.1. Data Collection
- 2.3.2. Data Validation
- 2.3.3. Data Analysis
- 2.4. Project Methodology
- 2.4.1. Secondary Research
- 2.4.1.1. Annual Reports
- 2.4.1.2. Academic Research Papers
- 2.4.1.3. Company Websites
- 2.4.1.4. Investor Presentations
- 2.4.1.5. Regulatory Filings
- 2.4.1.6. White Papers
- 2.4.1.7. Industry Publications
- 2.4.1.8. Conferences and Seminars
- 2.4.1.9. Government Portals
- 2.4.1.10. Media and Press Releases
- 2.4.1.11. Newsletters
- 2.4.1.12. Industry Databases
- 2.4.1.13. Roots Proprietary Databases
- 2.4.1.14. Paid Databases and Sources
- 2.4.1.15. Social Media Portals
- 2.4.1.16. Other Secondary Sources
- 2.4.2. Primary Research
- 2.4.2.1. Introduction
- 2.4.2.2. Types
- 2.4.2.2.1. Qualitative
- 2.4.2.2.2. Quantitative
- 2.4.2.3. Advantages
- 2.4.2.4. Techniques
- 2.4.2.4.1. Interviews
- 2.4.2.4.2. Surveys
- 2.4.2.4.3. Focus Groups
- 2.4.2.4.4. Observational Research
- 2.4.2.4.5. Social Media Interactions
- 2.4.2.5. Stakeholders
- 2.4.2.5.1. Company Executives (CXOs)
- 2.4.2.5.2. Board of Directors
- 2.4.2.5.3. Company Presidents and Vice Presidents
- 2.4.2.5.4. Key Opinion Leaders
- 2.4.2.5.5. Research and Development Heads
- 2.4.2.5.6. Technical Experts
- 2.4.2.5.7. Subject Matter Experts
- 2.4.2.5.8. Scientists
- 2.4.2.5.9. Doctors and Other Healthcare Providers
- 2.4.2.6. Ethics and Integrity
- 2.4.2.6.1. Research Ethics
- 2.4.2.6.2. Data Integrity
- 2.4.3. Analytical Tools and Databases
- 2.4.1. Secondary Research
3. MARKET DYNAMICS
- 3.1. Forecast Methodology
- 3.1.1. Top-Down Approach
- 3.1.2. Bottom-Up Approach
- 3.1.3. Hybrid Approach
- 3.2. Market Assessment Framework
- 3.2.1. Total Addressable Market (TAM)
- 3.2.2. Serviceable Addressable Market (SAM)
- 3.2.3. Serviceable Obtainable Market (SOM)
- 3.2.4. Currently Acquired Market (CAM)
- 3.3. Forecasting Tools and Techniques
- 3.3.1. Qualitative Forecasting
- 3.3.2. Correlation
- 3.3.3. Regression
- 3.3.4. Time Series Analysis
- 3.3.5. Extrapolation
- 3.3.6. Convergence
- 3.3.7. Forecast Error Analysis
- 3.3.8. Data Visualization
- 3.3.9. Scenario Planning
- 3.3.10. Sensitivity Analysis
- 3.4. Key Considerations
- 3.4.1. Demographics
- 3.4.2. Market Access
- 3.4.3. Reimbursement Scenarios
- 3.4.4. Industry Consolidation
- 3.5. Robust Quality Control
- 3.6. Key Market Segmentations
- 3.7. Limitations
4. MACRO-ECONOMIC INDICATORS
- 4.1. Chapter Overview
- 4.2. Market Dynamics
- 4.2.1. Time Period
- 4.2.1.1. Historical Trends
- 4.2.1.2. Current and Forecasted Estimates
- 4.2.2. Currency Coverage
- 4.2.2.1. Overview of Major Currencies Affecting the Market
- 4.2.2.2. Impact of Currency Fluctuations on the Industry
- 4.2.3. Foreign Exchange Impact
- 4.2.3.1. Evaluation of Foreign Exchange Rates and Their Impact on Market
- 4.2.3.2. Strategies for Mitigating Foreign Exchange Risk
- 4.2.4. Recession
- 4.2.4.1. Historical Analysis of Past Recessions and Lessons Learnt
- 4.2.4.2. Assessment of Current Economic Conditions and Potential Impact on the Market
- 4.2.5. Inflation
- 4.2.5.1. Measurement and Analysis of Inflationary Pressures in the Economy
- 4.2.5.2. Potential Impact of Inflation on the Market Evolution
- 4.2.6. Interest Rates
- 4.2.6.1. Overview of Interest Rates and Their Impact on the Market
- 4.2.6.2. Strategies for Managing Interest Rate Risk
- 4.2.7. Commodity Flow Analysis
- 4.2.7.1. Type of Commodity
- 4.2.7.2. Origins and Destinations
- 4.2.7.3. Values and Weights
- 4.2.7.4. Modes of Transportation
- 4.2.8. Global Trade Dynamics
- 4.2.8.1. Import Scenario
- 4.2.8.2. Export Scenario
- 4.2.9. War Impact Analysis
- 4.2.9.1. Russian-Ukraine War
- 4.2.9.2. Israel-Hamas War
- 4.2.10. COVID Impact / Related Factors
- 4.2.10.1. Global Economic Impact
- 4.2.10.2. Industry-specific Impact
- 4.2.10.3. Government Response and Stimulus Measures
- 4.2.10.4. Future Outlook and Adaptation Strategies
- 4.2.11. Other Indicators
- 4.2.11.1. Fiscal Policy
- 4.2.11.2. Consumer Spending
- 4.2.11.3. Gross Domestic Product (GDP)
- 4.2.11.4. Employment
- 4.2.11.5. Taxes
- 4.2.11.6. R&D Innovation
- 4.2.11.7. Stock Market Performance
- 4.2.11.8. Supply Chain
- 4.2.11.9. Cross-Border Dynamics
- 4.2.1. Time Period
SECTION II: QUALITATIVE INSIGHTS
5. EXECUTIVE SUMMARY
6. INTRODUCTION
- 6.1. Chapter Overview
- 6.2. Overview of Automotive Natural Gas Vehicle Market
- 6.2.1. Type of Fuel
- 6.2.2. Type of Vehicle
- 6.2.3. Type of End-User
- 6.2.4. Type of Distribution Channel
- 6.3. Future Perspective
7. REGULATORY SCENARIO
SECTION III: MARKET OVERVIEW
8. COMPREHENSIVE DATABASE OF LEADING PLAYERS
9. COMPETITIVE LANDSCAPE
- 9.1. Chapter Overview
- 9.2. Automotive Natural Gas Vehicle : Overall Market Landscape
- 9.2.1. Analysis by Year of Establishment
- 9.2.2. Analysis by Company Size
- 9.2.3. Analysis by Location of Headquarters
- 9.2.4. Analysis by Ownership Structure
10. WHITE SPACE ANALYSIS
11. COMPETITIVE COMPETITIVENESS ANALYSIS
12. STARTUP ECOSYSTEM IN THE AUTOMOTIVE NATURAL GAS VEHICLE MARKET
- 12.1. Automotive Natural Gas Vehicle Market: Market Landscape of Startups
- 12.1.1. Analysis by Year of Establishment
- 12.1.2. Analysis by Company Size
- 12.1.3. Analysis by Company Size and Year of Establishment
- 12.1.4. Analysis by Location of Headquarters
- 12.1.5. Analysis by Company Size and Location of Headquarters
- 12.1.6. Analysis by Ownership Structure
- 12.2. Key Findings
SECTION IV: COMPANY PROFILES
13. COMPANY PROFILES
- 13.1. Chapter Overview
- 13.2. AB Volvo*
- 13.2.1. Company Overview
- 13.2.2. Company Mission
- 13.2.3. Company Footprint
- 13.2.4. Management Team
- 13.2.5. Contact Details
- 13.2.6. Financial Performance
- 13.2.7. Operating Business Segments
- 13.2.8. Service / Product Portfolio (project specific)
- 13.2.9. MOAT Analysis
- 13.2.10. Recent Developments and Future Outlook
- 13.3. Beiqi Foton Motor
- 13.4. BMW
- 13.5. CNH Industrial
- 13.6. Cummins
- 13.7. Daimler
- 13.8. Dongfeng Motors
- 13.9. Ford Motors
- 13.10. Honda Motors
- 13.11. Mercedes-Benz
- 13.12. Mitsubishi Motors
- 13.13. Navistar International
- 13.14. Nissan Motors
- 13.15. Quantum Fuel Systems
- 13.16. Shaanxi Automobile
- 13.17. Tata Motors
- 13.18. Toyota Motor
- 13.19. Volkswagen
- 13.20. Westport Fuel Systems
SECTION V: MARKET TRENDS
14. MEGA TRENDS ANALYSIS
15. UNMEET NEED ANALYSIS
16. PATENT ANALYSIS
17. RECENT DEVELOPMENTS
- 17.1. Chapter Overview
- 17.2. Recent Funding
- 17.3. Recent Partnerships
- 17.4. Other Recent Initiatives
SECTION VI: MARKET OPPORTUNITY ANALYSIS
18. GLOBAL AUTOMOTIVE NATURAL GAS VEHICLE MARKET
- 18.1. Chapter Overview
- 18.2. Key Assumptions and Methodology
- 18.3. Trends Disruption Impacting Market
- 18.4. Demand Side Trends
- 18.5. Supply Side Trends
- 18.6. Global Automotive Natural Gas Vehicle Market, Historical Trends (Since 2019) and Forecasted Estimates (Till 2035)
- 18.7. Multivariate Scenario Analysis
- 18.7.1. Conservative Scenario
- 18.7.2. Optimistic Scenario
- 18.8. Investment Feasibility Index
- 18.9. Key Market Segmentations
19. MARKET OPPORTUNITIES BASED ON TYPE OF FUEL
- 19.1. Chapter Overview
- 19.2. Key Assumptions and Methodology
- 19.3. Revenue Shift Analysis
- 19.4. Market Movement Analysis
- 19.5. Penetration-Growth (P-G) Matrix
- 19.6. Automotive Natural Gas Vehicle Market for Compressed Natural Gas: Historical Trends (Since 2019) and Forecasted Estimates (Till 2035)
- 19.7. Automotive Natural Gas Vehicle Market for Liquefied Natural Gas: Historical Trends (Since 2019) and Forecasted Estimates (Till 2035)
- 19.8. Data Triangulation and Validation
- 19.8.1. Secondary Sources
- 19.8.2. Primary Sources
- 19.8.3. Statistical Modeling
20. MARKET OPPORTUNITIES BASED ON TYPE OF VEHICLE
- 20.1. Chapter Overview
- 20.2. Key Assumptions and Methodology
- 20.3. Revenue Shift Analysis
- 20.4. Market Movement Analysis
- 20.5. Penetration-Growth (P-G) Matrix
- 20.6. Automotive Natural Gas Vehicle Market for Heavy-Duty Vehicle: Historical Trends (Since 2019) and Forecasted Estimates (Till 2035)
- 20.7. Automotive Natural Gas Vehicle Market for Light-Duty Vehicle: Historical Trends (Since 2019) and Forecasted Estimates (Till 2035)
- 20.8. Automotive Natural Gas Vehicle Medium-Duty Vehicle: Historical Trends (Since 2019) and Forecasted Estimates (Till 2035)
- 20.9. Automotive Natural Gas Vehicle Market for Others: Historical Trends (Since 2019) and Forecasted Estimates (Till 2035)
- 20.10. Data Triangulation and Validation
- 20.10.1. Secondary Sources
- 20.10.2. Primary Sources
- 20.10.3. Statistical Modeling
21. MARKET OPPORTUNITIES BASED ON TYPE OF END-USER
- 21.1. Chapter Overview
- 21.2. Key Assumptions and Methodology
- 21.3. Revenue Shift Analysis
- 21.4. Market Movement Analysis
- 21.5. Penetration-Growth (P-G) Matrix
- 21.6. Automotive Natural Gas Vehicle Market for Automotive and Transportation: Historical Trends (Since 2019) and Forecasted Estimates (Till 2035)
- 21.7. Automotive Natural Gas Vehicle Market for Construction: Historical Trends (Since 2019) and Forecasted Estimates (Till 2035)
- 21.8. Automotive Natural Gas Vehicle Market for Electrical & Electronics: Historical Trends (Since 2019) and Forecasted Estimates (Till 2035)
- 21.9. Automotive Natural Gas Vehicle Market for Packaging: Historical Trends (Since 2019) and Forecasted Estimates (Till 2035)
- 21.10. Automotive Natural Gas Vehicle Market for Others: Historical Trends (Since 2019) and Forecasted Estimates (Till 2035)
- 21.11. Data Triangulation and Validation
- 21.11.1. Secondary Sources
- 21.11.2. Primary Sources
- 21.11.3. Statistical Modeling
22. MARKET OPPORTUNITIES BASED ON TYPE OF DISTRIBUTION CHANNEL
- 22.1. Chapter Overview
- 22.2. Key Assumptions and Methodology
- 22.3. Revenue Shift Analysis
- 22.4. Market Movement Analysis
- 22.5. Penetration-Growth (P-G) Matrix
- 22.6. Automotive Natural Gas Vehicle Market for Direct Sales: Historical Trends (Since 2019) and Forecasted Estimates (Till 2035)
- 22.7. Automotive Natural Gas Vehicle Market for Distributor: Historical Trends (Since 2019) and Forecasted Estimates (Till 2035)
- 22.8. Automotive Natural Gas Vehicle Market for Retailer: Historical Trends (Since 2019) and Forecasted Estimates (Till 2035)
- 22.9. Data Triangulation and Validation
- 22.9.1. Secondary Sources
- 22.9.2. Primary Sources
- 22.9.3. Statistical Modeling
23. MARKET OPPORTUNITIES AUTOMOTIVE NATURAL GAS VEHICLE IN NORTH AMERICA
- 23.1. Chapter Overview
- 23.2. Key Assumptions and Methodology
- 23.3. Revenue Shift Analysis
- 23.4. Market Movement Analysis
- 23.5. Penetration-Growth (P-G) Matrix
- 23.6. Automotive Natural Gas Vehicle Market in North America: Historical Trends (Since 2019) and Forecasted Estimates (Till 2035)
- 23.6.1. Automotive Natural Gas Vehicle Market in the US: Historical Trends (Since 2019) and Forecasted Estimates (Till 2035)
- 23.6.2. Automotive Natural Gas Vehicle Market in Canada: Historical Trends (Since 2019) and Forecasted Estimates (Till 2035)
- 23.6.3. Automotive Natural Gas Vehicle Market in Mexico: Historical Trends (Since 2019) and Forecasted Estimates (Till 2035)
- 23.6.4. Automotive Natural Gas Vehicle Market in Other North American Countries: Historical Trends (Since 2019) and Forecasted Estimates (Till 2035)
- 23.7. Data Triangulation and Validation
24. MARKET OPPORTUNITIES FOR AUTOMOTIVE NATURAL GAS VEHICLE IN EUROPE
- 24.1. Chapter Overview
- 24.2. Key Assumptions and Methodology
- 24.3. Revenue Shift Analysis
- 24.4. Market Movement Analysis
- 24.5. Penetration-Growth (P-G) Matrix
- 24.6. Automotive Natural Gas Vehicle Market in Europe: Historical Trends (Since 2019) and Forecasted Estimates (Till 2035)
- 24.6.1. Automotive Natural Gas Vehicle Market in Austria: Historical Trends (Since 2019) and Forecasted Estimates (Till 2035)
- 24.6.2. Automotive Natural Gas Vehicle Market in Belgium: Historical Trends (Since 2019) and Forecasted Estimates (Till 2035)
- 24.6.3. Automotive Natural Gas Vehicle Market in Denmark: Historical Trends (Since 2019) and Forecasted Estimates (Till 2035)
- 24.6.4. Automotive Natural Gas Vehicle Market in France: Historical Trends (Since 2019) and Forecasted Estimates (Till 2035)
- 24.6.5. Automotive Natural Gas Vehicle Market in Germany: Historical Trends (Since 2019) and Forecasted Estimates (Till 2035)
- 24.6.6. Automotive Natural Gas Vehicle Market in Ireland: Historical Trends (Since 2019) and Forecasted Estimates (Till 2035)
- 24.6.7. Automotive Natural Gas Vehicle Market in Italy: Historical Trends (Since 2019) and Forecasted Estimates (Till 2035)
- 24.6.8. Automotive Natural Gas Vehicle Market in Netherlands: Historical Trends (Since 2019) and Forecasted Estimates (Till 2035)
- 24.6.9. Automotive Natural Gas Vehicle Market in Norway: Historical Trends (Since 2019) and Forecasted Estimates (Till 2035)
- 24.6.10. Automotive Natural Gas Vehicle Market in Russia: Historical Trends (Since 2019) and Forecasted Estimates (Till 2035)
- 24.6.11. Automotive Natural Gas Vehicle Market in Spain: Historical Trends (Since 2019) and Forecasted Estimates (Till 2035)
- 24.6.12. Automotive Natural Gas Vehicle Market in Sweden: Historical Trends (Since 2019) and Forecasted Estimates (Till 2035)
- 24.6.13. Automotive Natural Gas Vehicle Market in Sweden: Historical Trends (Since 2019) and Forecasted Estimates (Till 2035)
- 24.6.14. Automotive Natural Gas Vehicle Market in Switzerland: Historical Trends (Since 2019) and Forecasted Estimates (Till 2035)
- 24.6.15. Automotive Natural Gas Vehicle Market in the UK: Historical Trends (Since 2019) and Forecasted Estimates (Till 2035)
- 24.6.16. Automotive Natural Gas Vehicle Market in Other European Countries: Historical Trends (Since 2019) and Forecasted Estimates (Till 2035)
- 24.7. Data Triangulation and Validation
25. MARKET OPPORTUNITIES FOR AUTOMOTIVE NATURAL GAS VEHICLE IN ASIA
- 25.1. Chapter Overview
- 25.2. Key Assumptions and Methodology
- 25.3. Revenue Shift Analysis
- 25.4. Market Movement Analysis
- 25.5. Penetration-Growth (P-G) Matrix
- 25.6. Automotive Natural Gas Vehicle Market in Asia: Historical Trends (Since 2019) and Forecasted Estimates (Till 2035)
- 25.6.1. Automotive Natural Gas Vehicle Market in China: Historical Trends (Since 2019) and Forecasted Estimates (Till 2035)
- 25.6.2. Automotive Natural Gas Vehicle Market in India: Historical Trends (Since 2019) and Forecasted Estimates (Till 2035)
- 25.6.3. Automotive Natural Gas Vehicle Market in Japan: Historical Trends (Since 2019) and Forecasted Estimates (Till 2035)
- 25.6.4. Automotive Natural Gas Vehicle Market in Singapore: Historical Trends (Since 2019) and Forecasted Estimates (Till 2035)
- 25.6.5. Automotive Natural Gas Vehicle Market in South Korea: Historical Trends (Since 2019) and Forecasted Estimates (Till 2035)
- 25.6.6. Automotive Natural Gas Vehicle Market in Other Asian Countries: Historical Trends (Since 2019) and Forecasted Estimates (Till 2035)
- 25.7. Data Triangulation and Validation
26. MARKET OPPORTUNITIES FOR AUTOMOTIVE NATURAL GAS VEHICLE IN MIDDLE EAST AND NORTH AFRICA (MENA)
- 26.1. Chapter Overview
- 26.2. Key Assumptions and Methodology
- 26.3. Revenue Shift Analysis
- 26.4. Market Movement Analysis
- 26.5. Penetration-Growth (P-G) Matrix
- 26.6. Automotive Natural Gas Vehicle Market in Middle East and North Africa (MENA): Historical Trends (Since 2019) and Forecasted Estimates (Till 2035)
- 26.6.1. Automotive Natural Gas Vehicle Market in Egypt: Historical Trends (Since 2019) and Forecasted Estimates (Till 205)
- 26.6.2. Automotive Natural Gas Vehicle Market in Iran: Historical Trends (Since 2019) and Forecasted Estimates (Till 2035)
- 26.6.3. Automotive Natural Gas Vehicle Market in Iraq: Historical Trends (Since 2019) and Forecasted Estimates (Till 2035)
- 26.6.4. Automotive Natural Gas Vehicle Market in Israel: Historical Trends (Since 2019) and Forecasted Estimates (Till 2035)
- 26.6.5. Automotive Natural Gas Vehicle Market in Kuwait: Historical Trends (Since 2019) and Forecasted Estimates (Till 2035)
- 26.6.6. Automotive Natural Gas Vehicle Market in Saudi Arabia: Historical Trends (Since 2019) and Forecasted Estimates (Till 2035)
- 26.6.7. Automotive Natural Gas Vehicle Market in United Arab Emirates (UAE): Historical Trends (Since 2019) and Forecasted Estimates (Till 2035)
- 26.6.8. Automotive Natural Gas Vehicle Market in Other MENA Countries: Historical Trends (Since 2019) and Forecasted Estimates (Till 2035)
- 26.7. Data Triangulation and Validation
27. MARKET OPPORTUNITIES FOR AUTOMOTIVE NATURAL GAS VEHICLE IN LATIN AMERICA
- 27.1. Chapter Overview
- 27.2. Key Assumptions and Methodology
- 27.3. Revenue Shift Analysis
- 27.4. Market Movement Analysis
- 27.5. Penetration-Growth (P-G) Matrix
- 27.6. Automotive Natural Gas Vehicle Market in Latin America: Historical Trends (Since 2019) and Forecasted Estimates (Till 2035)
- 27.6.1. Automotive Natural Gas Vehicle Market in Argentina: Historical Trends (Since 2019) and Forecasted Estimates (Till 2035)
- 27.6.2. Automotive Natural Gas Vehicle Market in Brazil: Historical Trends (Since 2019) and Forecasted Estimates (Till 2035)
- 27.6.3. Automotive Natural Gas Vehicle Market in Chile: Historical Trends (Since 2019) and Forecasted Estimates (Till 2035)
- 27.6.4. Automotive Natural Gas Vehicle Market in Colombia Historical Trends (Since 2019) and Forecasted Estimates (Till 2035)
- 27.6.5. Automotive Natural Gas Vehicle Market in Venezuela: Historical Trends (Since 2019) and Forecasted Estimates (Till 2035)
- 27.6.6. Automotive Natural Gas Vehicle Market in Other Latin American Countries: Historical Trends (Since 2019) and Forecasted Estimates (Till 2035)
- 27.7. Data Triangulation and Validation
28. MARKET OPPORTUNITIES FOR AUTOMOTIVE NATURAL GAS VEHICLE IN REST OF THE WORLD
- 28.1. Chapter Overview
- 28.2. Key Assumptions and Methodology
- 28.3. Revenue Shift Analysis
- 28.4. Market Movement Analysis
- 28.5. Penetration-Growth (P-G) Matrix
- 28.6. Automotive Natural Gas Vehicle Market in Rest of the World: Historical Trends (Since 2019) and Forecasted Estimates (Till 2035)
- 28.6.1. Automotive Natural Gas Vehicle Market in Australia: Historical Trends (Since 2019) and Forecasted Estimates (Till 2035)
- 28.6.2. Automotive Natural Gas Vehicle Market in New Zealand: Historical Trends (Since 2019) and Forecasted Estimates (Till 2035)
- 28.6.3. Automotive Natural Gas Vehicle Market in Other Countries
- 28.7. Data Triangulation and Validation
29. MARKET CONCENTRATION ANALYSIS: DISTRIBUTION BY LEADING PLAYERS
- 29.1. Leading Player 1
- 29.2. Leading Player 2
- 29.3. Leading Player 3
- 29.4. Leading Player 4
- 29.5. Leading Player 5
- 29.6. Leading Player 6
- 29.7. Leading Player 7
- 29.8. Leading Player 8
30. ADJACENT MARKET ANALYSIS
SECTION VII: STRATEGIC TOOLS
31. KEY WINNING STRATEGIES
32. PORTER FIVE FORCES ANALYSIS
33. SWOT ANALYSIS
34. VALUE CHAIN ANALYSIS
35. ROOTS STRATEGIC RECOMMENDATIONS
- 35.1. Chapter Overview
- 35.2. Key Business-related Strategies
- 35.2.1. Research & Development
- 35.2.2. Product Manufacturing
- 35.2.3. Commercialization / Go-to-Market
- 35.2.4. Sales and Marketing
- 35.3. Key Operations-related Strategies
- 35.3.1. Risk Management
- 35.3.2. Workforce
- 35.3.3. Finance
- 35.3.4. Others
SECTION VIII: OTHER EXCLUSIVE INSIGHTS
36. INSIGHTS FROM PRIMARY RESEARCH
37. REPORT CONCLUSION
SECTION IX: APPENDIX
38. TABULATED DATA
39. LIST OF COMPANIES AND ORGANIZATIONS
40. CUSTOMIZATION OPPORTUNITIES
41. ROOTS SUBSCRIPTION SERVICES
42. AUTHOR DETAILS
 天然气汽车(NGV)在汽车应用领域的全球市场份额和排名、总销量和需求预测(2025-2031年)
 汽车天然气汽车市场:依燃料类型、驱动方式、储槽类型、车辆类型、应用领域和改装类型划分-2025-2032年全球预测
 2025年全球天然气汽车市场报告
 天然气汽车的全球市场的评估,车辆类别,各燃料类型,各地区,机会,预测,2018~2032年
 全球天然气汽车市场规模(按车辆类型、燃料类型、应用、地区和预测)
 天然气汽车市场规模、份额、趋势分析报告:按燃料类型、车辆类型、地区、细分市场预测,2025-2030 年
 天然气汽车市场(引擎/系统类型:专用燃料、双燃料和双燃料;燃料类型:液化石油气和压缩天然气)- 2024-2034 年全球产业分析、规模、份额、成长、趋势和预测
 汽车天然气汽车市场,按燃料类型、车辆类型、国家和地区划分 - 2024-2032 年行业分析、市场规模、市场份额和预测