


 |
市场调查报告书
商品编码
1737048
自动注射器的按全球市场:使用法,各给药途径,各通知分子类型,作用机制类别,各容器容量,各终端用户,各标的适应症,各主要地区Global Autoinjectors Market by Usability, Route of Administration, Type of Molecule Delivered, Type of Actuation Mechanism, Volume of Container, End-user, Target Indication and Key Geographical Regions |
||||||
预计到 2035 年,全球自动注射器市场规模将从目前的 906 亿美元增长至 1,759 亿美元,预测期内复合年增长率为 6.2%。
市场区隔与机会分析依下列参数细分:
按使用法
- 抛弃式
- 再利用型
各给药途径
- 皮下
- 静脉内
- 肌肉内
各通知分子类型
- 抗体
- [月太]
- 蛋白质
- 低分子
- 其他
作用机制类别
- 手动
- 自动
各容器容量
- 不满1mL
- 1~2 mL
- 2mL以上
各终端用户
- 门诊病人手术中心
- 居家医疗
- 医院及诊疗所
各标的适应症
- 过敏性反应
- 糖尿病
- 偏头痛
- 多发性硬化症
- 类风湿性关节炎
- 体重减少
- 其他
各主要地区
- 北美
- 欧洲
- 亚太地区
- 中东·北非
- 南美
全球自动注射器市场(第五版):成长与趋势
糖尿病、多发性硬化症、类风湿性关节炎和严重过敏等慢性疾病在全球范围内的增多,促使了迫切需要更有效率、创新且用户友好的给药系统。值得注意的是,这些慢性疾病对患者的影响巨大,相关的费用和併发症可能会随着时间的推移而急剧增加。因此,医疗产业投入了大量精力来开发新的给药装置,包括自动注射器。
自动注射器是用于皮下或肌肉注射给药的自动注射器。它们主要由弹簧驱动,使用预充式註射器或药筒作为主要容器。透过完全或部分自动化给药过程,这些装置使给药过程更加便捷。因此,自动注射器作为下一代以病人为中心的装置,能够安全可靠地输送注射药物,展现出巨大的潜力。此外,新型生物製剂的出现也增加了对更大剂量、更高黏度药物的需求。因此,包括 BD Medical 和 SHL 在内的许多设备製造商都在推出大容量自动注射器。此外,目前正在开发的新型自动注射器可以满足个别患者的特定需求和愿望。这些注射器的设计旨在根据使用者的需求调整剂量和设备功能。事实上,将注射器数位化连接到各种产品和平台有望提高患者的依从性和生活品质。鑑于自动注射器的这些进步,未来对有效药物输送系统和疾病管理日益增长的需求将得到有效满足。
全球自动注射器市场:关键洞察
本报告深入探讨了全球自动注射器市场的现状,并识别了该行业的潜在成长机会。主要发现包括:
目前,全球各地的不同厂商提供/生产近150种自动注射器。
市面上大多数自动注射器适用于皮下注射。这些自动注射器整合了声音和视觉指示器,可以输送多种分子。
此外,大多数洲际和洲内合作都由欧洲企业达成。
自2019年以来,已有超过1,100项与自动注射器相关的专利提交/授予各利益相关方,以保护该领域产生的智慧财产权。
许多隶属于学术/医疗/商业组织的科学家、临床医生和业界资深人士正在带头进行与自动注射器相关的研究。
此外,近60%的自动注射器组合开发公司都是大型企业。
市面上约 75% 的自动注射器组合与注射器相容,值得注意的是,这些组合大多用于成人家庭护理。
目前,超过 70 种用于治疗各种适应症的自动注射器组合正处于早期和晚期研发阶段。
目前,约 90% 的早期和晚期组合正处于不同的临床研发阶段,其中大多数用于治疗慢性疾病(主要是类风湿性关节炎)。
自动注射器市场预计将保持稳定成长。特别是,一次性自动注射器预计将在 2024 年占据 88% 以上的市场占有率,因为它们无需手动填充药物,而且污染风险较低。
预计到2035年,具有自动作用机制的自动注射器将以更快的速度成长(约7%)。此外,用于输送类风湿性关节炎药物的自动注射器很可能在当前市场占据主导地位。
预计在预测期内,适用于家庭医疗保健的自动注射器将占据大部分市场占有率。预计到2035年,亚太地区将以更高的速度成长。
全球自动注射器市场(第五版):主要细分市场
依用途,市场分为一次性自动注射器和可重复使用自动注射器。目前,一次性自动注射器在全球自动注射器市场中占有最大占有率。未来几年,这一趋势可能保持不变。
预测期内,用于静脉给药的自动注射器是全球自动注射器市场中成长最快的细分市场。
依给药途径,市场分为皮下注射、肌肉注射和静脉注射。目前,用于皮下给药的自动注射器在全球自动注射器市场中占有最大占有率。值得注意的是,静脉注射自动注射器领域的全球自动注射器市场很可能以相对较高的复合年增长率成长。
依递送分子类型,市场分为抗体、胜肽、蛋白质、小分子和其他。目前,用于蛋白质递送的自动注射器在全球自动注射器市场中占有最大占有率。这一趋势在不久的将来可能会改变。
根据作用机制类型,市场细分为手动作用机制和自动作用机制的自动注射器。目前,自动作用机制的自动注射器占据全球自动注射器市场的最大占有率。此外,值得注意的是,全球自动作用机制的自动注射器市场很可能以相对较高的复合年增长率成长。
根据容器容量,市场细分为储存容量小于1毫升、1-2毫升及2毫升及以上的自动注射器。目前,储存容量为1-2毫升的自动注射器占据全球自动注射器市场的最大占有率。预计未来十年这一趋势不会改变。
根据最终用户,市场细分为家庭医疗保健、医院/诊所和门诊手术中心。目前,家庭医疗保健领域使用的自动注射器占据全球自动注射器市场的最大占有率。此外,与其他细分市场相比,该细分市场的成长速度可能更快。
根据目标适应症,市场细分为过敏反应、糖尿病、偏头痛、多发性硬化症、类风湿性关节炎、减重和其他适应症。虽然类风湿性关节炎适应症预计将成为整体市场的主要驱动力,但值得注意的是,减重细分市场的全球自动注射器市场可能会以相对更高的复合年增长率成长。
根据主要地区,市场细分为北美、欧洲、亚太地区、拉丁美洲以及中东和北非。预计北美和欧洲的公司将占据大部分市场占有率。
自动注射器的全球市场的参与企业案例
- Amgen
- Antares Pharma
- ChemProtect.SK
- Elcam Medical
- Eli Lilly and Company
- Jiangsu Delfu Medical Device
- Kindeva Drug Delivery
- Merck
- Novartis
- Novo Nordisk
- Oval Medical Technologies
- Owen Mumford
- PreciHealth
- Recipharm
- Sanofi
- SHL Medical
- Teva Pharmaceuticals
- Union Medico
- Ypsomed
本报告提供全球自动注射器市场相关调查,提供市场概要,以及使用法,各给药途径,各通知分子类型,作用机制类别,各容器容量,各终端用户,各标的适应症,各主要地区的趋势,及加入此市场的主要企业简介等资讯。
目录
第1章 序文
第2章 调查手法
第3章 经济以及其他的计划特有的考虑事项
第4章 摘要整理
第5章 简介
- 章概要
- 药物递输系统的种类
- 传统的非口服给药系统的缺点
- 自我管理新的潮流
- 自我给药设备的种类
- 自动注射器概要
- 法规上的考虑事项
- 未来展望
第6章 自动注射器所使用的主要药物容器
- 章概要
- 包装的种类
- 主要的医药品容器
- 一次医药品容器所扮演的角色
- 滤芯
- 注射器
- 管瓶
- 各种各样的製造材料的比较
第7章 自动注射器:市场概要
- 章概要
- 自动注射器:市场形势
- 自动注射器厂商:市场形势
第8章 产品竞争力分析
- 章概要
- 前提主要的参数
- 调查手法
- 自动注射器:产品竞争力分析
- 抛弃式自动注射器
- 再利用型自动注射器
第9章 品牌定位分析
- 章概要
- 前提主要的参数
- 调查手法
- 自动注射器厂商:品牌定位组成架构
- 品牌定位组成架构:Owen Mumford
- 品牌定位组成架构:Ypsomed
- 品牌定位组成架构:Elcam Medical
- 品牌定位组成架构:SHL Medical
- 品牌定位组成架构:Union Medico
- 品牌定位组成架构:Antares Pharma
- 品牌定位组成架构:PreciHealth
- 品牌定位组成架构:Jiangsu Delfu Medical Device
- 品牌定位组成架构:Oval Medical Technologies
- 品牌定位组成架构:Recipharm
第10章 自动注射器厂商:详细的企业简介
- 章概要
- Antares Pharma
- Elcam Medical
- Jiangsu Delfu Medical Device
- Oval Medical Technologies
- Owen Mumford
- PreciHealth
- Recipharm
- SHL Medical
- Union Medico
- Ypsomed
第11章 伙伴关係和合作
- 章概要
- 伙伴关係模式
- 自动注射器:伙伴关係和合作
第12章 专利分析
- 章概要
- 范围与调查手法
- 自动注射器:专利分析
- 专利基准分析
- 专利评估
- 引用数前几名的专利
第13章 药物·设备的组合:已上市自动注射器
- 章概要
- 药物·设备的组合:已上市自动注射器
- 药物·设备的组合:已上市自动注射器开发商
第14章 药物·设备的组合:初期阶段及后期阶段的自动注射器
- 章概要
- 药物·设备的组合:初期阶段及后期阶段的自动注射器
- 医药品设备的组合:初期阶段及后期阶段的自动注射器开发商的形势
第15章 企业简介:自动注射器复合产品开发企业
- 章概要
- Amgen
- ChemProtect.SK
- Eli Lilly and Company
- Kindeva Drug Delivery
- Merck
- Novartis
- Novo Nordisk
- Sanofi
- Teva Pharmaceutical Industries
第16章 KOL分析
第17章 案例研究:主要的治疗适应
- 章概要
- 过敏性反应
- 多发性硬化症
- 偏头痛
- 类风湿性关节炎
第18章 案例研究:医疗设备契约服务供应商
- 章概要
- 医疗设备製造伴随的课题
- 医疗设备製造的CMO所扮演的角色
- 医疗设备CMO所提供的服务
- 医疗设备CMO所提供的优点
- CMO的外包伴随的风险
- 药物输送设备服务供应商
- 结论
第19章 案例研究:预填充式注射器
- 章概要
- 预填充式注射器:市场形势
- 预填充式注射器厂商:市场形势
- 未来展望
第20章 SWOT分析
第21章 全球自动注射器市场
- 章概要
- 主要的前提与调查手法
- 全球自动注射器市场,历史的趋势(2018年以后)及预测(到2035年)
- Scenario分析
- 主要的市场区隔
第22章 类风湿性关节炎用自动注射器市场
第23章 多发性硬化症用自动注射器市场
第24章 糖尿病用自动注射器市场
第25章 减重用自动注射器市场
第26章 过敏性反应用自动注射器市场
第27章 偏头痛治疗用自动注射器市场
第28章 其他的适应症事情自动注射器市场
第29章 按自动注射器市场,使用法
第30章 自动注射器市场,各给药途径
第31章 自动注射器市场,各通知分子类型
第32章 自动注射器市场,作用机制类别
第33章 自动注射器市场,各容器容量
第34章 自动注射器市场,各终端用户
第35章 自动注射器市场,各标的适应症
第36章 自动注射器市场,各主要地区
第37章 结论
第38章 执行洞察
第39章 附录1:表格形式资料
第40章 附录2:企业及组织的一览
GLOBAL AUTOINJECTORS MARKET (5TH EDITION): OVERVIEW
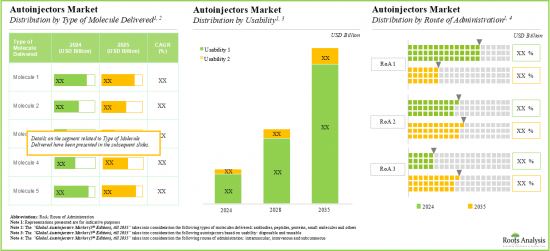
As per Roots Analysis, the global autoinjectors market is estimated to grow from USD 90.6 billion in the current year to USD 175.9 billion by 2035, at a CAGR of 6.2% during the forecast period, till 2035.
The market sizing and opportunity analysis has been segmented across the following parameters:
Usability
- Disposable
- Reusable
Route of Administration
- Subcutaneous
- Intravenous
- Intramuscular
Type of Molecule Delivered
- Antibodies
- Peptides
- Proteins
- Small Molecules
- Others
Type of Actuation Mechanism
- Manual
- Automatic
Volume of Container
- Less than 1 mL
- 1-2 mL
- More than 2 mL
End-user
- Ambulatory Surgical Centers
- Home Care
- Hospitals and Clinics
Target Indication
- Anaphylaxis
- Diabetes
- Migraine
- Multiple Sclerosis
- Rheumatoid Arthritis
- Weight Loss
- Others
Key Geographical Regions
- North America
- Europe
- Asia-Pacific
- Middle East and North Africa
- Latin America
GLOBAL AUTOINJECTORS MARKET (5TH EDITION): GROWTH AND TRENDS
The global rise in chronic diseases, such as diabetes, multiple sclerosis, rheumatoid arthritis and severe allergies, has driven a pressing requirement for a more efficient, innovative and user-friendly drug delivery systems. It is worth highlighting that the impact of these chronic conditions on patients is substantial, as the associated costs and complications can escalate dramatically over a period. As a result, the medical industry has made significant efforts in developing novel drug delivery devices, including autoinjectors.
Autoinjectors are automatic injection devices that are used for the delivery of drugs through the subcutaneous or intramuscular routes. These are primarily spring-driven devices that use prefilled syringes or cartridges as primary containers. By complete or partial automation of the drug delivery process, these devices make the dosing process more convenient. Owing to which, autoinjectors have demonstrated significant potential as the next generation of patient-centric devices, capable of safe and reliable delivery of injectables. Further, the advent of novel biologics is driving the demand for injection of higher viscosities of drugs in larger volumes. Consequently, many device manufacturers, such as BD Medical and SHL, have introduced large volume autoinjectors. Additionally, the new autoinjector devices, which are currently under development, are capable of addressing the specific needs and wants of individual patients. These are designed to enable adjustments in the dosage or features of the device based upon the requirements of the user. In fact, connecting the injectors digitally to various products and platforms is expected to improve adherence and quality of life for the patients. Given these advancements in autoinjectors, the growing need for effective drug delivery systems and disease management can be efficiently addressed in the future.
GLOBAL AUTOINJECTORS MARKET: KEY INSIGHTS
The report delves into the current state of the global autoinjectors market and identifies potential growth opportunities within the industry. Some key findings from the report include:
1. Presently, close to 150 autoinjectors are available / being manufactured by various players, globally; the majority of the autoinjector manufacturers are headquartered in North America.
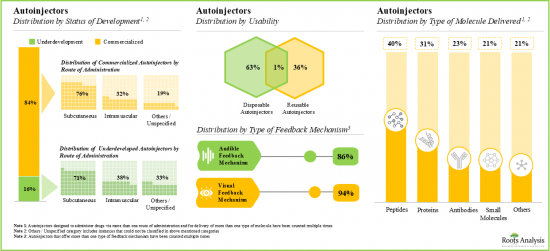
2. Most of the commercially available autoinjectors are suitable for subcutaneous administration; these autoinjectors are integrated with audible and visual indicators and can deliver a myriad of molecules.
3. More than 50% of the deals in the autoinjectors domain were inked in the last three years; further, most of the intercontinental as well as intracontinental partnerships have been signed by players based in Europe.
4. Since 2019, more than 1,100 patents related to autoinjectors have been filed by / granted to various stakeholders to protect the intellectual property generated within this domain.
5. Several scientists, clinicians and industry veterans, affiliated to academic / medical / commercial organizations, are spearheading research related to autoinjectors.
6. Nearly 160 autoinjector combination products (with different drugs) have been approved by regulatory authorities, across the world; further, close to 60% of autoinjector combination product developers are very large players.
7. Around 75% of the commercialized autoinjector combination products are compatible with syringes; notably, majority of these combination products are intended to be used in homecare settings by adults.
8. More than 70 autoinjector combination products intended for the treatment of various indications are currently being evaluated in early and late stages of development; further, most of the developers for these products are publicly listed companies.
9. Around 90% of the early and late-stage combination products are currently in different clinical phases of development; majority of these are being developed for the treatment of chronic conditions (primarily rheumatoid arthritis).
10. The autoinjectors market is anticipated to grow at a steady rate; notably, disposable autoinjectors are likely to capture over 88% market share in 2024 as they eliminate the need for manual loading of medication and have lower risk of contamination.
11. Autoinjectors with automatic actuation mechanism are anticipated to grow at faster pace (~7%) till 2035; further, the autoinjectors intended for delivering drugs targeting rheumatoid arthritis are likely to dominate the current market.
12. The autoinjectors suitable for home care are likely to capture majority share in the market during the forecasted period; Asia-Pacific is anticipated to grow at higher rate in this domain, till 2035.
GLOBAL AUTOINJECTORS MARKET (5TH EDITION): KEY SEGMENTS
Disposable Autoinjectors Occupies the Largest Share of the Global Autoinjectors Market
Based on the usability, the market is segmented into disposable autoinjectors and reusable autoinjectors. At present, disposable autoinjectors segment hold the maximum share of the global autoinjectors market. This trend is likely to remain the same in the forthcoming years.
Autoinjectors for Intravenous Drug Delivery is the Fastest Growing Segment of the Global Autoinjectors Market During the Forecast Period
Based on the route of administration, the market is segmented into subcutaneous, intramuscular and intravenous routes. Currently, autoinjectors used for subcutaneous drug delivery capture the highest proportion of the global autoinjectors market. It is worth highlighting that the global autoinjector market for intravenous autoinjector segment is likely to grow at a relatively higher CAGR.
Proteins Segment Occupy the Largest Share of the Global Autoinjectors Market by Type of Molecule Delivered
Based on the type of molecule delivered, the market is segmented into antibodies, peptides, proteins, small molecules and others. At present, autoinjectors designed for the delivery of proteins hold the maximum share of the global autoinjectors market. This trend is likely to change in the foreseeable future.
By Type of Actuation Mechanism, Autoinjectors with Automatic Actuation Mechanism is the Fastest Growing Segment of the Global Autoinjectors Market During the Forecast Period
Based on the type of actuation mechanism, the market is segmented into manual and automatic actuation mechanism based autoinjectors. At present, autoinjectors equipped with automatic actuation mechanisms capture the highest proportion of the global autoinjectors market. Further, it is worth highlighting that the global autoinjector market for automatic actuation mechanism based autoinjectors is likely to grow at a relatively higher CAGR.
Autoinjectors with Volume Containers of 1-2 mL Account for the Largest Share of the Global Autoinjectors Market
Based on the volume of containers, the market is segmented into autoinjectors with less than 1 ml, 1-2 ml and more than 2 ml storing volumes. Currently, autoinjectors with a drug storing capacity of 1-2 ml of a drug hold the maximum share of the global autoinjectors market. This trend is likely to remain the same in the coming decade.
By End-user, Home Care Segment is Likely to Dominate the Global Autoinjectors Market
Based on the end-user, the market is segmented into home care, hospitals and clinics and ambulatory surgical centers. At present autoinjectors used in the home care segment hold the maximum share of the global autoinjectors market. Additionally, this segment is likely to grow at a faster pace, compared to the other segments.
Autoinjectors Designed for the Treatment of Rheumatoid Arthritis Occupy the Largest Share of the Global Autoinjectors Market
Based on the target indication, the market is segmented into anaphylaxis, diabetes, migraine, multiple sclerosis, rheumatoid arthritis, weight loss and other indications. Whilst rheumatoid arthritis target indication segment is expected to be the primary driver of the overall market, it is worth highlighting that the global autoinjectors market for weight loss segment is likely to grow at a relatively higher CAGR.
North America Accounts for the Largest Share of the Market
Based on key geographical regions, the market is segmented into North America, Europe, Asia-Pacific, Latin America, and Middle East and North Africa. The majority share is expected to be captured by players based in North America and Europe.
Example Players in the Global Autoinjectors Market
- Amgen
- Antares Pharma
- ChemProtect.SK
- Elcam Medical
- Eli Lilly and Company
- Jiangsu Delfu Medical Device
- Kindeva Drug Delivery
- Merck
- Novartis
- Novo Nordisk
- Oval Medical Technologies
- Owen Mumford
- PreciHealth
- Recipharm
- Sanofi
- SHL Medical
- Teva Pharmaceuticals
- Union Medico
- Ypsomed
GLOBAL AUTOINJECTORS MARKET: RESEARCH COVERAGE
- Market Sizing and Opportunity Analysis: The report features an in-depth analysis of the global autoinjectors market, focusing on key market segments, including [A] usability, [B] route of administration, [C] type of molecule delivered, [D] type of actuation mechanism, [E] volume of container, [F] end-user, [G] target indication and [H] key geographical regions.
- Autoinjectors Market Landscape: A comprehensive evaluation of autoinjectors, considering various parameters, such as [A] status of development, [B] usability, [C] type of primary drug container, [D] requirement of needle, [E] volume of container, [F] type of dose delivered, [G] route of administration, [H] type of actuation mechanism, [I] type of feedback mechanism, [J] availability of connectivity feature, [K] target indication, [L] type of molecule delivered and [M] end-user. Additionally, a comprehensive evaluation of the companies engaged in manufacturing autoinjectors, based on several relevant parameters, such as [N] year of establishment, [O] company size (in terms of employee count), [P] location of headquarters, [Q] type of company and [R] most active players (in terms of number of autoinjectors manufactured).
- Product Competitiveness Analysis: A comprehensive competitive analysis of autoinjectors, examining factors, such as [A] manufacturer strength and [B] product strength.
- Brand Positioning Analysis: A comprehensive brand positioning assessment framework of the autoinjector manufacturers focusing on the current perceptions of their proprietary brands across various device types. This analysis evaluates autoinjector manufacturers by various parameters, including [A] strength and diversity of product portfolio, [B] routes of administration, [C] type of actuation mechanism, [D] type of feedback mechanism, [E] geographical presence / reach and [F] supplier strength of each player.
- Company Profiles of Autoinjectors Manufacturers: In-depth profiles of key autoinjector manufacturers, focusing on [A] company overviews, [B] financial information (if available), [C] autoinjectors portfolio, [D] manufacturing capabilities and facilities, [E] recent developments and [F] an informed future outlook.
- Partnerships and Collaborations: An insightful analysis of the deals inked by stakeholders in the global autoinjectors market, based on several parameters, such as [A] year of partnership, [B] type of partnership, [C] type of partner, [D] most active players (in terms of the number of partnerships signed) and [E] geographical distribution of partnership activity.
- Patent Analysis: An in-depth analysis of patents filed / granted till date in the autoinjectors domain, based on various relevant parameters, such as [A] type of patent, [B] patent publication year, [C] patent application year, [D] patent jurisdiction, [E] CPC symbols, [F] type of applicant, [G] most active players, [H] patent benchmarking and [I] patent valuation analysis.
- Commercialized Autoinjector Combination Product Market Landscape: A comprehensive evaluation of commercialized autoinjector combination products, considering various parameters, such as [A] approval year, [B] usability, [C] type of primary drug container, [D] requirement of needle, [E] volume of container, [F] injection time, [G] type of dose delivered, [H] route of administration, [I] type of actuation mechanism, [J] type of feedback mechanism, [K] availability of connectivity feature, [L] target indication, [M] severity of indication, [N] type of molecule delivered, [O] end-user and [P] target population. Additionally, a comprehensive evaluation of the companies engaged in manufacturing commercialized autoinjector combination product, based on several relevant parameters, such as [Q] year of establishment, [R] company size (in terms of employee count), [S] location of headquarters, [T] type of company and [U] most active players (in terms of number of commercialized autoinjector combination products developed).
- Early and Late Stage Autoinjectors Combination Product Market Landscape: A comprehensive evaluation of early and late stage autoinjector combination products, considering various parameters, such as [A] stage of development, [B] route of administration, [C] dose strength, [D] target indication, [E] severity of indication, [F] type of molecule delivered, [G] end-user, [H] target population and [I] gender of target population. Additionally, a comprehensive evaluation of the companies engaged in manufacturing early and late stage autoinjector combination products, based on several relevant parameters, such as [J] year of establishment, [K] company size (in terms of employee count), [L] location of headquarters and [M] type of company.
- Short Company Profiles of Autoinjector Combination Product Manufacturers: Short profiles of key autoinjector combination product manufacturers, focusing on [A] company overviews and [B] autoinjector product portfolio.
- Key Opinion Leaders (KOLs]: An in-depth analysis that emphasizes the key opinion leaders in this domain, considering various parameters, such as [A] role of KOL, [B] type of sponsor organization, [C] affiliated organization, [D] target indication, [E] location of clinical trials and [F] most prominent KOLs.
- Case Study 1: A general discussion on most commonly targeted indications, providing information on approved autoinjector combination products.
- Case Study 2: A general discussion on the role of medical device CMOs in the manufacturing and assembly of drug-delivery devices, including autoinjectors, based on several relevant parameters, such as [A] scale of operation and [B] types of services provided for production of devices.
- Case Study 3: A detailed assessment of prefilled syringes that are either commercialized or under development based on several relevant parameters, such as [A] type of barrel fabrication material, [B] number of barrel chambers, [C] type of needle system. In addition, the chapter provides a detailed analysis of prefilled syringe manufacturers, based on various parameters, such as [D] year of establishment, [E] company size (in terms of employee count) and [F] location of headquarters.
- SWOT Analysis: An analysis of industry affiliated trends, opportunities and challenges, which are likely to impact the evolution of autoinjectors market; it includes a Harvey ball analysis, assessing the relative impact of each SWOT parameter on industry dynamics.
KEY QUESTIONS ANSWERED IN THIS REPORT
- How many companies are currently engaged in this market?
- Which are the leading companies in this market?
- What factors are likely to influence the evolution of this market?
- What is the current and future market size?
- What is the CAGR of this market?
- How is the current and future market opportunity likely to be distributed across key market segments?
REASONS TO BUY THIS REPORT
- The report provides a comprehensive market analysis, offering detailed revenue projections of the overall market and its specific sub-segments. This information is valuable to both established market leaders and emerging entrants.
- Stakeholders can leverage the report to gain a deeper understanding of the competitive dynamics within the market. By analyzing the competitive landscape, businesses can make informed decisions to optimize their market positioning and develop effective go-to-market strategies.
- The report offers stakeholders a comprehensive overview of the market, including key drivers, barriers, opportunities, and challenges. This information empowers stakeholders to stay abreast of market trends and make data-driven decisions to capitalize on growth prospects.
ADDITIONAL BENEFITS
- Complimentary PPT Insights Packs
- Complimentary Excel Data Packs for all Analytical Modules in the Report
- 10% Free Content Customization
- Detailed Report Walkthrough Session with Research Team
- Free Updated report if the report is 6-12 months old or older
TABLE OF CONTENTS
1. PREFACE
- 1.1. Introduction
- 1.2. Market Share Insights
- 1.3. Key Marget Insights
- 1.4. Report Coverage
- 1.5. Key Questions Answered
- 1.6. Chapter Outlines
2. RESEARCH METHODOLOGY
- 2.1. Chapter Overview
- 2.2. Research Assumptions
- 2.3. Project Methodology
- 2.4. Forecast Methodology
- 2.5. Robust Quality Control
- 2.6. Key Market Segmentation
- 2.7. Key Considerations
- 2.7.1. Demographics
- 2.7.2. Economic Factors
- 2.7.3. Government Regulations
- 2.7.4. Supply Chain
- 2.7.5. COVID Impact
- 2.7.6. Market Access
- 2.7.7. Healthcare Policies
- 2.7.8. Industry Consolidation
3.ECONOMIC AND OTHER PROJECT SPECIFIC CONSIDERATIONS
- 3.1. Chapter Overview
- 3.2. Market Dynamics
- 3.2.1. Time Period
- 3.2.1.1. Historical Trends
- 3.2.1.2. Current and Future Estimates
- 3.2.2. Currency Coverage and Foreign Exchange Rate
- 3.2.2.1. Major Currencies Affecting the Market
- 3.2.2.2. Factors Affecting Currency Fluctuations and Foreign Exchange Rates
- 3.2.2.3. Impact of Foreign Exchange Rate Volatility on the Market
- 3.2.2.4. Strategies for Mitigating Foreign Exchange Risk
- 3.2.3. Trade Policies
- 3.2.3.1. Impact of Trade Barriers on the Market
- 3.2.3.2. Strategies for Mitigating the Risks Associated with Trade Barriers
- 3.2.4. Recession
- 3.2.4.1. Historical Analysis of Past Recessions and Lessons Learnt
- 3.2.4.2. Assessment of Current Economic Conditions and Potential Impact on the Market
- 3.2.5. Inflation
- 3.2.5.1. Measurement and Analysis of Inflationary Pressures in the Economy
- 3.2.5.2. Potential Impact of Inflation on the Market Evolution
- 3.2.1. Time Period
4. EXECUTIVE SUMMARY
5. INTRODUCTION
- 5.1. Chapter Overview
- 5.2. Types of Drug Delivery Systems
- 5.3. Drawbacks of Conventional Parenteral Delivery Systems
- 5.4. Emerging Trend of Self-Administration
- 5.4.1. Rising Burden of Chronic Diseases
- 5.4.2. Healthcare Cost Savings
- 5.4.3. Need for Immediate Treatment in Emergency Situations
- 5.4.4. Growth of Injectable Biologics Market
- 5.4.5. Addressing Key User Safety Requirements
- 5.5. Types of Self-Administration Devices
- 5.5.1. Prefilled Syringes
- 5.5.2. Pen-Injectors
- 5.5.3. Needle-Free Injectors
- 5.5.4. Large Volume Wearable Injectors
- 5.5.5. Autoinjectors
- 5.6. Overview of Autoinjectors
- 5.6.1. Components of Autoinjectors
- 5.6.2. Classification of Autoinjectors
- 5.6.2.1. Classification Based on Mechanism of Action
- 5.6.2.2. Classification Based on Usability
- 5.6.2.3. Classification Based on Type of Dose Delivered
- 5.6.3. Manufacturing / Packaging of Autoinjectors
- 5.6.4. Benefits of Autoinjectors
- 5.7. Regulatory Considerations
- 5.7.1. Medical Devices
- 5.7.2. Drug Device Combination Products
- 5.8. Future Perspectives
6. PRIMARY DRUG CONTAINERS USED IN AUTOINJECTORS
- 6.1. Chapter Overview
- 6.2. Types of Packaging
- 6.3. Primary Drug Containers
- 6.3.1. Role of Primary Drug Containers
- 6.3.2. Cartridges
- 6.3.2.1. Components of Cartridges
- 6.3.2.2. Types of Cartridges
- 6.3.2.2.1. Single Chamber Cartridge
- 6.3.2.2.2. Dual Chamber Cartridge
- 6.3.2.3. Commercially Available Cartridges
- 6.3.3. Syringes
- 6.3.3.1. Components of Syringes
- 6.3.3.2. Classification of Syringes
- 6.3.3.2.1. Classification Based on Barrel Fabrication Material
- 6.3.3.2.2. Classification Based on Number of Chambers in the Barrel
- 6.3.3.2.3. Classification Based on Type of Needle
- 6.3.4. Vials
- 6.3.4.1. Components of Vials
- 6.3.4.2. Commercially Available Vials
- 6.4. Comparison of Different Fabrication Materials
7. AUTOINJECTORS: MARKET OVERVIEW
- 7.1. Chapter Overview
- 7.2. Autoinjectors: Overall Market Landscape
- 7.2.1. Analysis by Stage of Development
- 7.2.2. Analysis by Usability
- 7.2.3. Analysis by Type of Primary Drug Container
- 7.2.4. Analysis by Requirement of Needle
- 7.2.5. Analysis by Volume of Container
- 7.2.6. Analysis by Type of Dose Delivered
- 7.2.7. Analysis by Route of Administration
- 7.2.8. Analysis by Type of Actuation Mechanism
- 7.2.9. Analysis by Type of Feedback Mechanism
- 7.2.10. Analysis by Availability of Connectivity Feature
- 7.2.11. Analysis by Target Indication
- 7.2.12. Analysis by Type of Molecule Delivered
- 7.2.13. Analysis by End-user
- 7.3. Autoinjector Manufacturers: Overall Market Landscape
- 7.3.1. Analysis by Year of Establishment
- 7.3.2. Analysis by Company Size
- 7.3.3. Analysis by Location of Headquarters
- 7.3.4. Analysis by Company Size and Location of Headquarters
- 7.3.5. Analysis by Type of Company
- 7.3.6. Most Active Players: Analysis by Number of Autoinjectors
8. PRODUCT COMPETITIVENESS ANALYSIS
- 8.1. Chapter Overview
- 8.2. Assumptions and Key Parameters
- 8.3. Methodology
- 8.4. Autoinjectors: Product Competitiveness Analysis
- 8.4.1. Disposable Autoinjectors
- 8.4.2. Reusable Autoinjectors
9. BRAND POSITIONING ANALYSIS
- 9.1. Chapter Overview
- 9.2. Assumptions and Key Parameters
- 9.3. Methodology
- 9.4. Autoinjector Manufacturers: Brand Positioning Framework
- 9.4.1. Brand Positioning Framework: Owen Mumford
- 9.4.2. Brand Positioning Framework: Ypsomed
- 9.4.3. Brand Positioning Framework: Elcam Medical
- 9.4.4. Brand Positioning Framework: SHL Medical
- 9.4.5. Brand Positioning Framework: Union Medico
- 9.4.6. Brand Positioning Framework: Antares Pharma
- 9.4.7. Brand Positioning Framework: PreciHealth
- 9.4.8. Brand Positioning Framework: Jiangsu Delfu Medical Device
- 9.4.9. Brand Positioning Framework: Oval Medical Technologies
- 9.4.10. Brand Positioning Framework: Recipharm
10. AUTOINJECTOR MANUFACTURERS: DETAILED COMPANY PROFILES
- 10.1. Chapter Overview
- 10.2. Antares Pharma
- 10.2.1. Company Overview
- 10.2.2. Financial Information
- 10.2.3. Autoinjectors Portfolio
- 10.2.4 Recent Developments and Future Outlook
- 10.3. Elcam Medical
- 10.3.1. Company Overview
- 10.3.2. Autoinjectors Portfolio
- 10.3.3. Recent Developments and Future Outlook
- 10.4. Jiangsu Delfu Medical Device
- 10.4.1. Company Overview
- 10.4.2. Autoinjectors Portfolio
- 10.4.3. Recent Developments and Future Outlook
- 10.5. Oval Medical Technologies
- 10.5.1. Company Overview
- 10.5.2. Autoinjectors Portfolio
- 10.5.3. Recent Developments and Future Outlook
- 10.6. Owen Mumford
- 10.6.1. Company Overview
- 10.6.2. Autoinjectors Portfolio
- 10.6.3. Recent Developments and Future Outlook
- 10.7. PreciHealth
- 10.7.1. Company Overview
- 10.7.2. Autoinjectors Portfolio
- 10.7.3. Recent Developments and Future Outlook
- 10.8. Recipharm
- 10.8.1. Company Overview
- 10.8.2. Financial Information
- 10.8.3. Autoinjectors Portfolio
- 10.8.4. Recent Developments and Future Outlook
- 10.9. SHL Medical
- 10.9.1. Company Overview
- 10.9.2. Autoinjectors Portfolio
- 10.9.3. Recent Developments and Future Outlook
- 10.10. Union Medico
- 10.10.1. Company Overview
- 10.10.2. Autoinjectors Portfolio
- 10.10.3. Recent Developments and Future Outlook
- 10.11. Ypsomed
- 10.11.1. Company Overview
- 10.11.2. Financial Information
- 10.11.3. Autoinjectors Portfolio
- 10.11.4. Recent Developments and Future Outlook
11. PARTNERSHIPS AND COLLABORATIONS
- 11.1. Chapter Overview
- 11.2. Partnership Models
- 11.3. Autoinjectors: Partnerships and Collaborations
- 11.3.1. Analysis by Year of Partnership
- 11.3.2. Analysis by Type of Partnership
- 11.3.3. Analysis by Year and Type of Partnership
- 11.3.4. Analysis by Type of Product
- 11.3.5. Analysis by Type of Partner
- 11.3.6. Most Active Players: Analysis by Number of Partnerships
- 11.3.7. Analysis by Geography
- 11.3.7.1. Intracontinental and Intercontinental Deals
- 11.3.7.2. International and Local Deals
12. PATENT ANALYSIS
- 12.1. Chapter Overview
- 12.2. Scope and Methodology
- 12.3. Autoinjectors: Patent Analysis
- 12.3.1. Analysis by Patent Publication Year
- 12.3.2. Analysis by Type of Patent and Patent Publication Year
- 12.3.3. Analysis by Patent Application Year
- 12.3.4. Analysis by Patent Jurisdiction
- 12.3.5. Analysis by CPC Symbols
- 12.3.6. Analysis by Type of Applicant
- 12.3.7. Leading Industry Players: Analysis by Number of Patents
- 12.3.8. Leading Individual Assignees: Analysis by Number of Patents
- 12.4. Patent Benchmarking Analysis
- 12.4.1. Analysis By Patent Characteristics
- 12.5. Patent Valuation
- 12.6. Leading Patents by Number of Citations
13. DRUG DEVICE COMBINATIONS: COMMERCIALIZED AUTOINJECTORS
- 13.1. Chapter Overview
- 13.2. Drug Device Combinations: Commercialized Autoinjectors
- 13.2.1. Analysis by Approval Year
- 13.2.2. Analysis by Usability
- 13.2.3. Analysis by Type of Primary Drug Container
- 13.2.4. Analysis by Requirement of Needle
- 13.2.5. Analysis by Volume of Container
- 13.2.6. Analysis by Injection Time
- 13.2.7. Analysis by Type of Dose Delivered
- 13.2.8. Analysis by Route of Administration
- 13.2.9. Analysis by Type of Actuation Mechanism
- 13.2.10. Analysis by Type of Feedback Mechanism
- 13.2.11. Analysis by Availability of Connectivity Feature
- 13.2.12. Analysis by Target Indication
- 13.2.13. Analysis by Severity of Indication
- 13.2.14. Analysis by Type of Molecule Delivered
- 13.2.15. Analysis by End-user
- 13.2.16. Analysis by Target Population
- 13.3. Drug Device Combinations: Commercialized Autoinjector Developers
- 13.3.1. Analysis by Year of Establishment
- 13.3.2. Analysis by Company Size
- 13.3.3. Analysis by Location of Headquarters
- 13.3.4. Analysis by Company Size and Location of Headquarters
- 13.3.5. Analysis by Type of Company
- 13.3.6. Most Active Players: Analysis by Number of Commercialized Autoinjector Combination Products
14. DRUG DEVICE COMBINATIONS: EARLY AND LATE STAGE AUTOINJECTORS
- 14.1. Chapter Overview
- 14.2. Drug Device Combinations: Early and Late Stage Autoinjectors
- 14.2.1. Analysis by Stage of Development
- 14.2.2. Analysis by Route of Administration
- 14.2.3. Analysis by Dose Strength
- 14.2.4. Analysis by Target Indication
- 14.2.5. Analysis by Severity of Indication
- 14.2.6. Analysis by Type of Molecule Delivered
- 14.2.7. Analysis by End-user
- 14.2.8. Analysis by Target Population
- 14.2.9. Analysis by Gender of Target Population
- 14.3. Drug Device Combinations: Early and Late Stage Autoinjector Developers Landscape
- 14.3.1. Analysis by Year of Establishment
- 14.3.2. Analysis by Company Size
- 14.3.3. Analysis by Location of Headquarters
- 14.3.4. Analysis by Company Size and Location of Headquarters
- 14.3.5. Analysis by Type of Company
15 SHORT COMPANY PROFILES: AUTOINJECTOR COMBINATION PRODUCT DEVELOPERS
- 15.1. Chapter Overview
- 15.2. Amgen
- 15.2.1. Company Overview
- 15.2.2. Autoinjector Combination Product Portfolio
- 15.3. ChemProtect.SK
- 15.3.1. Company Overview
- 15.3.2. Autoinjector Combination Product Portfolio
- 15.4. Eli Lilly and Company
- 15.4.1. Company Overview
- 15.4.2. Autoinjector Combination Product Portfolio
- 15.5. Kindeva Drug Delivery
- 15.5.1. Company Overview
- 15.5.2. Autoinjector Combination Product Portfolio
- 15.6. Merck
- 15.6.1. Company Overview
- 15.6.2. Autoinjector Combination Product Portfolio
- 15.7. Novartis
- 15.7.1. Company Overview
- 15.7.2. Autoinjector Combination Product Portfolio
- 15.8. Novo Nordisk
- 15.8.1. Company Overview
- 15.8.2. Autoinjector Combination Product Portfolio
- 15.9. Sanofi
- 15.9.1. Company Overview
- 15.9.2. Autoinjector Combination Product Portfolio
- 15.10. Teva Pharmaceutical Industries
- 15.10.1. Company Overview
- 15.10.2. Autoinjector Combination Product Portfolio
16. KEY OPINION LEADER ANALYSIS
- 16.1. Chapter Overview
- 16.2. Assumption and Key Parameters
- 16.3. Methodology
- 16.4. Autoinjectors: Key Opinion Leaders
- 16.4.1. Analysis by Role of KOL
- 16.4.2. Analysis by Type of Sponsor Organization
- 16.4.3. Analysis by Affiliated Organization
- 16.4.4. Analysis by Target Indication
- 16.4.5. Analysis by Location of Clinical Trials
- 16.4.6 Most Prominent KOLs: Analysis by Activeness, Expertise and Strength of KOL
- 16.4.7. Most Prominent KOLs: Analysis by Roots Analysis Score
17. CASE STUDY: KEY THERAPEUTIC INDICATIONS
- 17.1. Chapter Overview
- 17.2. Anaphylaxis
- 17.2.1. Overview and Epidemiology
- 17.2.2. Treatment for Anaphylaxis
- 17.2.3. Autoinjectors for Anaphylaxis
- 17.3. Multiple Sclerosis
- 17.3.1. Overview and Epidemiology
- 17.3.2. Treatment for Multiple Sclerosis
- 17.3.3. Autoinjectors for Multiple Sclerosis
- 17.4. Migraine
- 17.4.1. Overview and Epidemiology
- 17.4.2. Treatment for Migraine
- 17.4.3. Autoinjectors for Migraine
- 17.5. Rheumatoid Arthritis
- 17.5.1. Overview and Epidemiology
- 17.5.2. Treatment for Rheumatoid Arthritis
- 17.5.3. Autoinjectors for Rheumatoid Arthritis
18. CASE STUDY: MEDICAL DEVICE CONTRACT SERVICE PROVIDERS
- 18.1. Chapter Overview
- 18.2. Challenges Associated with Medical Device Manufacturing
- 18.3. Role of CMOs in Medical Device Manufacturing
- 18.4. Services Offered by Medical Device CMOs
- 18.5. Advantages Offered by Medical Device CMOs
- 18.6. Risks Associated with Outsourcing to CMOs
- 18.7. Drug Delivery Device Service Providers
- 18.7.1. Analysis by Year of Establishment
- 18.7.2. Analysis by Company Size
- 18.7.3. Analysis by Location of Headquarters
- 18.7.4. Analysis by Type of Services
- 18.8. Concluding Remarks
19. CASE STUDY: PREFILLED SYRINGES
- 19.1. Chapter Overview
- 19.2. Prefilled Syringes: Market Landscape
- 19.2.1. Analysis by Type of Barrel Fabrication Material
- 19.2.2. Analysis by Number of Barrel Chambers
- 19.2.3. Analysis by Type of Needle System
- 19.3. Prefilled Syringes Manufacturers: Overall Market Landscape
- 19.3.1. Analysis by Year of Establishment
- 19.3.2. Analysis by Company Size
- 19.3.3. Analysis by Location of Headquarters
- 19.4. Future Perspectives
20. SWOT ANALYSIS
- 20.1. Chapter Overview
- 20.2. Strengths
- 20.2.1. Ease of Drug Delivery
- 20.2.2. Ability to Minimize / Eliminate Medication Errors
- 20.2.3. Enhanced Safety Features
- 20.2.4. Economic Advantages
- 20.2.5. Drug Life Cycle Management
- 20.3. Weaknesses
- 20.3.1. Manufacturing Complexities
- 20.3.2. Customized Design for Different Formulations
- 20.3.3. Use Errors
- 20.3.4. Stringent Regulatory Guidelines
- 20.4. Opportunities
- 20.4.1. Rich and Growing Pipeline of Biologics and Biosimilars
- 20.4.2. Growing Preference for Self-Injection Devices
- 20.4.3. Integration of Advanced Technologies
- 20.4.4. Rising Popularity across the Globe
- 20.5. Threats
- 20.5.1. Material Compatibility Issues
- 20.5.2. Availability of Alternative Drug Delivery Devices
- 20.5.3. Concern Related to Numerous Product Recalls in Past
- 20.6. Concluding Remarks
21. GLOBAL AUTOINJECTORS MARKET
- 21.1. Chapter Overview
- 21.2. Key Assumptions and Methodology
- 21.3. Global Autoinjectors Market, Historical Trends (Since 2018) and Forecasted Estimates (Till 2035)
- 21.3.1. Scenario Analysis
- 21.3.1.1. Conservative Scenario
- 21.3.1.2 Optimistic Scenario
- 21.3.1. Scenario Analysis
- 21.4. Key Market Segmentations
22. AUTOINJECTORS MARKET, FOR RHEUMATOID ARTHRITIS
- 22.1. Chapter Overview
- 22.2. Key Assumptions and Methodology
- 22.3. Autoinjectors Market for Rheumatoid Arthritis: Distribution by Usability
- 22.3.1. Disposable Autoinjectors Market for Rheumatoid Arthritis, Historical Trends (Since 2018) and Forecasted Estimates (Till 2035)
- 22.3.2. Reusable Autoinjectors Market for Rheumatoid Arthritis, Historical Trends (Since 2018) and Forecasted Estimates (Till 2035)
- 22.4. Autoinjectors Market for Rheumatoid Arthritis: Distribution by Route of Administration
- 22.4.1. Subcutaneous Autoinjectors Market for Rheumatoid Arthritis, Historical Trends (Since 2018) and Forecasted Estimates (Till 2035)
- 22.4.2. Subcutaneous / Intravenous Autoinjectors Market for Rheumatoid Arthritis, Historical Trends (Since 2018) and Forecasted Estimates (Till 2035)
- 22.4.3. Intravenous Autoinjectors Market for Rheumatoid Arthritis, Historical Trends (Since 2018) and Forecasted Estimates (Till 2035)
- 22.5. Autoinjectors Market for Rheumatoid Arthritis: Distribution by Type of Molecule Delivered
- 22.5.1. Protein-based Autoinjectors Market for Rheumatoid Arthritis, Historical Trends (Since 2018) and Forecasted Estimates (Till 2035)
- 22.5.2. Antibody-based Autoinjectors Market for Rheumatoid Arthritis, Historical Trends (Since 2018) and Forecasted Estimates (Till 2035)
- 22.5.3. Small Molecule-based Autoinjectors Market for Rheumatoid Arthritis, Historical Trends (Since 2018) and Forecasted Estimates (Till 2035)
- 22.6. Leading Player
23. AUTOINJECTORS MARKET, FOR MULTIPLE SCLEROSIS
- 23.1. Chapter Overview
- 23.2. Key Assumptions and Methodology
- 23.3. Autoinjectors Market for Multiple Sclerosis: Distribution by Usability
- 23.3.1. Disposable Autoinjectors Market for Multiple Sclerosis, Historical Trends (Since 2018) and Forecasted Estimates (Till 2035)
- 23.3.2. Reusable Autoinjectors Market for Multiple Sclerosis, Historical Trends (Since 2018) and Forecasted Estimates (Till 2035)
- 23.4. Autoinjectors Market for Multiple Sclerosis: Distribution by Route of Administration
- 23.4.1. Subcutaneous Autoinjectors Market for Multiple Sclerosis, Historical Trends (Since 2018) and Forecasted Estimates (Till 2035)
- 23.4.2. Intramuscular Autoinjectors Market for Multiple Sclerosis, Historical Trends (Since 2018) and Forecasted Estimates (Till 2035)
- 23.5. Autoinjectors Market for Multiple Sclerosis: Distribution by Type of Molecule Delivered
- 23.5.1. Protein-based Autoinjectors Market for Multiple Sclerosis, Historical Trends (Since 2018) and Forecasted Estimates (Till 2035)
- 23.5.2. Peptide-based Autoinjectors Market for Multiple Sclerosis, Historical Trends (Since 2018) and Forecasted Estimates (Till 2035)
- 23.5.3. Antibody-based Autoinjectors Market for Multiple Sclerosis, Historical Trends (Since 2018) and Forecasted Estimates (Till 2035)
- 23.6. Leading Player
24. AUTOINJECTORS MARKET, FOR DIABETES
- 24.1. Chapter Overview
- 24.2. Key Assumptions and Methodology
- 24.3. Autoinjectors Market for Diabetes: Distribution by Usability
- 24.3.1. Disposable Autoinjectors Market for Diabetes, Historical Trends (Since 2018) and Forecasted Estimates (Till 2035)
- 24.3.2. Reusable Autoinjectors Market for Diabetes, Historical Trends (Since 2018) and Forecasted Estimates (Till 2035)
- 24.4. Autoinjectors Market for Diabetes: Distribution by Route of Administration
- 24.4.1. Subcutaneous Autoinjectors Market for Diabetes, Historical Trends (Since 2018) and Forecasted Estimates (Till 2035)
- 24.5. Autoinjectors Market for Diabetes: Distribution by Type of Molecule Delivered
- 24.5.1. Protein-based Autoinjectors Market for Diabetes, Historical Trends (Since 2018) and Forecasted Estimates (Till 2035)
- 24.5.2. Antibody-based Autoinjectors Market for Diabetes, Historical Trends (Since 2018) and Forecasted Estimates (Till 2035)
- 24.6. Leading Player
25. AUTOINJECTORS MARKET, FOR WEIGHT LOSS
- 25.1. Chapter Overview
- 25.2. Key Assumptions and Methodology
- 25.3. Autoinjectors Market for Weight Loss: Distribution by Usability
- 25.3.1. Disposable Autoinjectors Market for Weight Loss, Historical Trends (Since 2018) and Forecasted Estimates (Till 2035)
- 25.4. Autoinjectors Market for Weight Loss: Distribution by Route of Administration
- 25.4.1. Subcutaneous Autoinjectors Market for Weight Loss, Historical Trends (Since 2018) and Forecasted Estimates (Till 2035)
- 25.5. Autoinjectors Market for Weight Loss: Distribution by Type of Molecule Delivered
- 25.5.1. Peptide-based Autoinjectors Market for Weight Loss, Historical Trends (Since 2018) and Forecasted Estimates (Till 2035)
- 25.5.2. Small Molecule-based Autoinjectors Market for Weight Loss, Historical Trends (Since 2018) and Forecasted Estimates (Till 2035)
- 25.6. Leading Player
26. AUTOINJECTORS MARKET, FOR ANAPHYLAXIS
- 26.1. Chapter Overview
- 26.2. Key Assumptions and Methodology
- 26.3. Autoinjectors Market for Anaphylaxis: Distribution by Usability
- 26.3.1. Disposable Autoinjectors Market for Anaphylaxis, Historical Trends (Since 2018) and Forecasted Estimates (Till 2035)
- 26.4. Autoinjectors Market for Anaphylaxis: Distribution by Route of Administration
- 26.4.1. Subcutaneous / Intramuscular Autoinjectors Market for Anaphylaxis, Historical Trends (Since 2018) and Forecasted Estimates (Till 2035)
- 26.4.2. Intramuscular Autoinjectors Market for Anaphylaxis, Historical Trends (Since 2018) and Forecasted Estimates (Till 2035)
- 26.5. Autoinjectors Market for Anaphylaxis: Distribution by Type of Molecule Delivered
- 26.5.1. Small Molecule-based Autoinjectors Market for Anaphylaxis, Historical Trends (Since 2018) and Forecasted Estimates (Till 2035)
- 26.6. Leading Player
27. AUTOINJECTORS MARKET, FOR MIGRAINE
- 27.1. Chapter Overview
- 27.2. Key Assumptions and Methodology
- 27.3. Autoinjectors Market for Migraine: Distribution by Usability
- 27.3.1. Disposable Autoinjectors Market for Migraine, Historical Trends (Since 2018) and Forecasted Estimates (Till 2035)
- 27.4. Autoinjectors Market for Migraine: Distribution by Route of Administration
- 27.4.1. Subcutaneous Autoinjectors Market for Migraine, Historical Trends (Since 2018) and Forecasted Estimates (Till 2035)
- 27.5. Autoinjectors Market for Migraine: Distribution by Type of Molecule Delivered
- 27.5.1. Antibody-based Autoinjectors Market for Migraine, Historical Trends (Since 2018) and Forecasted Estimates (Till 2035)
- 27.5.2. Protein-based Autoinjectors Market for Migraine, Historical Trends (Since 2018) and Forecasted Estimates (Till 2035)
- 27.5.3. Small Molecule-based Autoinjectors Market for Migraine, Historical Trends (Since 2018) and Forecasted Estimates (Till 2035)
- 27.6. Leading Player
28. AUTOINJECTORS MARKET, FOR OTHER INDICATIONS
- 28.1. Chapter Overview
- 28.2. Key Assumptions and Methodology
- 28.3. Autoinjectors Market for Other Indications: Distribution by Usability
- 28.3.1. Disposable Autoinjectors Market for Other Indications, Historical Trends (Since 2018) and Forecasted Estimates (Till 2035)
- 28.3.2. Reusable Autoinjectors Market for Other Indications, Historical Trends (Since 2018) and Forecasted Estimates (Till 2035)
- 28.4. Autoinjectors Market for Other Indications: Distribution by Route of Administration
- 28.4.1. Subcutaneous Autoinjectors Market for Other Indications,
Historical Trends (Since 2018) and Forecasted Estimates (Till 2035)
- 28.4.2. Subcutaneous / Intramuscular Autoinjectors Market for Other Indications, Historical Trends (Since 2018) and Forecasted Estimates (Till 2035)
- 28.4.3. Subcutaneous / Intravenous Autoinjectors Market for Other Indications, Historical Trends (Since 2018) and Forecasted Estimates (Till 2035)
- 28.5. Autoinjectors Market for Other Indications: Distribution by Type of Molecule Delivered
- 28.5.1. Antibody-based Autoinjectors Market for Other Indications, Historical Trends (Since 2018) and Forecasted Estimates (Till 2035)
- 28.5.2. Protein-based Autoinjectors Market for Other Indications, Historical Trends (Since 2018) and Forecasted Estimates (Till 2035)
- 28.5.3. Small Molecule-based Autoinjectors Market for Other Indications, Historical Trends (Since 2018) and Forecasted Estimates (Till 2035)
- 28.5.4. Other Molecule-based Autoinjectors Market for Other Indications, Historical Trends (Since 2018) and Forecasted Estimates (Till 2035)
- 28.6. Leading Player
29. AUTOINJECTORS MARKET, BY USABILITY
- 29.1. Chapter Overview
- 29.2. Key Assumptions and Methodology
- 29.3. Autoinjectors Market: Distribution by Usability
- 29.3.1. Disposable Autoinjectors Market: Historical Trends (Since 2018) and Forecasted Estimates (Till 2035)
- 29.3.2. Reusable Autoinjectors Market: Historical Trends (Since 2018) and Forecasted Estimates (Till 2035)
- 29.4. Data Triangulation and Validation
30. AUTOINJECTORS MARKET, BY ROUTE OF ADMINISTRATION
- 30.1. Chapter Overview
- 30.2. Key Assumptions and Methodology
- 30.3. Autoinjectors Market: Distribution by Route of Administration
- 30.3.1. Autoinjectors Market for Subcutaneous Administration: Historical Trends (Since 2018) and Forecasted Estimates (Till 2035)
- 30.3.2. Autoinjectors Market for Subcutaneous / Intramuscular Administration: Historical Trends (Since 2018) and Forecasted Estimates (Till 2035)
- 30.3.3. Autoinjectors Market for Subcutaneous / Intravenous Administration: Historical Trends (Since 2018) and Forecasted Estimates (Till 2035)
- 30.3.4. Autoinjectors Market for Intramuscular Administration: Historical Trends (Since 2018) and Forecasted Estimates (Till 2035)
- 30.3.5. Autoinjectors Market for Intravenous Administration: Historical Trends (Since 2018) and Forecasted Estimates (Till 2035)
- 30.4. Data Triangulation and Validation
31. AUTOINJECTORS MARKET, BY TYPE OF MOLECULE DELIVERED
- 31.1. Chapter Overview
- 31.2. Key Assumptions and Methodology
- 31.3. Autoinjectors Market: Distribution by Type of Molecule Delivered
- 31.3.1. Autoinjectors Market for Proteins: Historical Trends (Since 2018) and Forecasted Estimates (Till 2035)
- 31.3.2. Autoinjectors Market for Antibodies: Historical Trends (Since 2018) and Forecasted Estimates (Till 2035)
- 31.3.3. Autoinjectors Market for Small Molecules: Historical Trends (Since 2018) and Forecasted Estimates (Till 2035)
- 31.3.4. Autoinjectors Market for Peptides: Historical Trends (Since 2018) and Forecasted Estimates (Till 2035)
- 31.3.5. Autoinjectors Market for Other Molecules: Historical Trends (Since 2018) and Forecasted Estimates (Till 2035)
- 31.4. Data Triangulation and Validation
32. AUTOINJECTORS MARKET, BY TYPE OF ACTUTATION MECHANISM
- 32.1. Chapter Overview
- 32.2. Key Assumptions and Methodology
- 32.3. Autoinjectors Market: Distribution by Type of Actuation Mechanism
- 32.3.1. Autoinjectors Market for Manual Actuation: Historical Trends (Since 2018) and Forecasted Estimates (Till 2035)
- 32.3.2. Autoinjectors Market for Automatic Actuation: Historical Trends (Since 2018) and Forecasted Estimates (Till 2035)
- 32.4. Data Triangulation and Validation
33. AUTOINJECTORS MARKET, BY VOLUME OF CONTAINER
- 33.1. Chapter Overview
- 33.2. Key Assumptions and Methodology
- 33.3. Autoinjectors Market: Distribution by Volume of Container
- 33.3.1. Autoinjectors Market for Containers with Less than 1 mL Volume: Historical Trends (Since 2018) and Forecasted Estimates (Till 2035)
- 33.3.2. Autoinjectors Market for Containers with 1- 2 mL Volume: Historical Trends (Since 2018) and Forecasted Estimates (Till 2035)
- 33.3.3. Autoinjectors Market for Containers with More than 2 mL Volume: Historical Trends (Since 2018) and Forecasted Estimates (Till 2035)
- 33.4. Data Triangulation and Validation
34. AUTOINJECTORS, BY END-USER
- 34.1. Chapter Overview
- 34.2. Key Assumptions and Methodology
- 34.3. Autoinjectors Market: Distribution by End-user
- 34.3.1. Autoinjectors Market for Home Care: Historical Trends (Since 2018) and Forecasted Estimates (Till 2035)
- 34.3.2. Autoinjectors Market for Hospitals and Clinics: Historical Trends (Since 2018) and Forecasted Estimates (Till 2035)
- 34.3.3. Autoinjectors Market for Ambulatory Surgical Centers: Historical Trends (Since 2018) and Forecasted Estimates (Till 2035)
- 34.4. Data Triangulation and Validation
35. AUTOINJECTORS MARKET, BY TARGET INDICATION
- 35.1. Chapter Overview
- 35.2. Key Assumptions and Methodology
- 35.3. Autoinjectors Market: Distribution by Target Indication
- 35.3.1. Autoinjectors Market for Rheumatoid Arthritis: Historical Trends (Since 2018) and Forecasted Estimates (Till 2035)
- 35.3.2. Autoinjectors Market for Multiple Sclerosis: Historical Trends (Since 2018) and Forecasted Estimates (Till 2035)
- 35.3.3 Autoinjectors Market for Diabetes: Historical Trends (Since 2018) and Forecasted Estimates (Till 2035) Data Triangulation
- 35.3.4. Autoinjectors Market for Anaphylaxis: Historical Trends (Since 2018) and Forecasted Estimates (Till 2035)
- 35.3.5. Autoinjectors Market for Weight Loss: Historical Trends (Since 2018) and Forecasted Estimates (Till 2035)
- 35.3.6. Autoinjectors Market for Migraine: Historical Trends (Since 2018) and Forecasted Estimates (Till 2035)
- 35.3.7. Autoinjectors Market for Other Indications: Historical Trends (Since 2018) and Forecasted Estimates (Till 2035)
- 35.4. Data Triangulation and Validation
36. AUTOINJECTORS, BY KEY GEOGRAPHICAL REGIONS
- 36.1. Chapter Overview
- 36.2. Key Assumptions and Methodology
- 36.3. Autoinjectors Market: Distribution by Key Geographical Regions
- 36.3.1. Autoinjectors Market in North America: Historical Trends (Since 2018) and Forecasted Estimates (Till 2035)
- 36.3.2. Autoinjectors Market in Europe: Historical Trends (Since 2018) and Forecasted Estimates (Till 2035)
- 36.3.3. Autoinjectors Market in Asia-Pacific: Historical Trends (Since 2018) and Forecasted Estimates (Till 2035)
- 36.3.4. Autoinjectors Market in Middle East and North Africa: Historical Trends (Since 2018) and Forecasted Estimates (Till 2035)
- 36.3.4. Autoinjectors Market in Latin America: Historical Trends (Since 2018) and Forecasted Estimates (Till 2035)
- 36.4. Data Triangulation and Validation
37. CONCLUDING REMARKS
38. EXECUTIVE INSIGHTS
- 38.1. Chapter Overview
- 38.2. Aktiv Pharma
- 38.2.1. Company Snapshot
- 38.2.2. Interview Transcript
- 38.3. Rx Bandz
- 38.3.1. Company Snapshot
- 38.3.2. Interview Transcript
- 38.4. Kindeva Drug Delivery
- 38.4.1. Company Snapshot
- 38.4.2. Interview Transcript
- 38.5. DALI Medical Devices
- 38.5.1. Company Snapshot
- 38.5.2. Interview Transcript:
- 38.6. Elcam Medical
- 38.6.1. Company Snapshot
- 38.6.2. Interview Transcript
- 38.7. Pharma Consult
- 38.7.1. Company Snapshot
- 38.7.2. Interview Transcript
- 38.8. IDEO
- 38.8.1. Company Snapshot
- 38.8.2. Interview Transcript
- 38.9. Bill & Melinda Gates Foundation
- 38.9.1. Company Snapshot
- 38.9.2. Interview Transcript
- 38.10. Oval Medical Technologies
- 38.10.1. Company Snapshot
- 38.10.2. Interview Transcript
- 38.11. Anonymous
- 38.12. Anonymous
- 38.13. Anonymous
- 38.14. Anonymous
39. APPENDIX 1: TABULATED DATA
40. APPENDIX 2: LIST OF COMPANIES AND ORGANIZATION
List of Tables
- Table 5.1 Comparison of Self-Injection Devices
- Table 5.2 Benefits of Autoinjectors
- Table 6.1 Commercially Available Cartridges
- Table 6.2 Classification of Syringes
- Table 6.3 Commercially Available Glass Syringes
- Table 6.4 Commercially Available Plastic Syringes
- Table 6.5 Commercially Available Vials
- Table 6.6 Comparison of Fabrication Material Used for Primary Drug Containers
- Table 7.1 Autoinjectors: Overall Market Landscape
- Table 7.2 Autoinjectors: Information on Requirement of Needle, Volume of Container, Type of Dose Delivered and Route of Administration
- Table 7.3 Autoinjectors: Information on Type of Actuation Mechanism, Type of Feedback Mechanism, Availability of Connectivity Feature and Target Indication
- Table 7.4 Autoinjectors: Information on Type of Molecule Delivered and End-user
- Table 7.5 Autoinjector Manufacturers: Overall Market Landscape
- Table 10.1 Autoinjector Manufacturers: List of Companies Profiled
- Table 10.2 Antares Pharma: Company Snapshot
- Table 10.3 Antares Pharma: Autoinjectors Portfolio
- Table 10.4 Halozyme (Parent Company of Antares Pharma): Recent Developments and Future Outlook
- Table 10.5 Elcam Medical: Company Snapshot
- Table 10.6 Elcam Medical: Autoinjectors Portfolio
- Table 10.7 Jiangsu Delfu Medical Device: Company Snapshot
- Table 10.8 Jiangsu Delfu Medical Device: Autoinjectors Portfolio
- Table 10.9 Oval Medical Technologies: Company Snapshot
- Table 10.10 Oval Medical Technologies: Autoinjectors Portfolio
- Table 10.11 Oval Medical Technologies: Recent Developments and Future Outlook
- Table 10.12 Owen Mumford: Company Snapshot
- Table 10.13 Owen Mumford: Autoinjectors Portfolio
- Table 10.14 Owen Mumford: Recent Developments and Future Outlook
- Table 10.15 PreciHealth: Company Snapshot
- Table 10.16 PreciHealth: Autoinjectors Portfolio
- Table 10.17 PreciHealth: Recent Developments and Future Outlook
- Table 10.18 Recipharm: Company Snapshot
- Table 10.19 Recipharm: Autoinjectors Portfolio
- Table 10.20 Recipharm: Recent Developments and Future Outlook
- Table 10.21 SHL Medical: Company Snapshot
- Table 10.22 SHL Medical: Autoinjectors Portfolio
- Table 10.23 SHL Medical: Recent Developments and Future Outlook
- Table 10.24 Union Medico: Company Snapshot
- Table 10.25 Union Medico: Autoinjectors Portfolio
- Table 10.26 Ypsomed: Company Snapshot
- Table 10.27 Ypsomed: Autoinjectors Portfolio
- Table 10.28 Ypsomed: Recent Developments and Future Outlook
- Table 11.1 Autoinjectors: List of Partnerships and Collaborations, Since 2016
- Table 12.1 Patent Analysis: Top CPC Sections
- Table 12.2 Patent Analysis: Top CPC Symbols
- Table 12.3 Patent Analysis: Top CPC Codes
- Table 12.4 Patent Analysis: Summary of Benchmarking Analysis
- Table 12.5 Patent Analysis: Categorization based on Weighted Valuation Scores
- Table 12.6 Patent Portfolio: List of Leading Patents (by Highest Relative Valuation)
- Table 12.7 Patent Portfolio: List of Leading Patents (by Number of Citations)
- Table 13.1 Drug Device Combinations: Commercialized Autoinjectors
- Table 13.2 Commercialized Autoinjector Combination Products: Information on Requirement of Needle, Volume of Container, Injection Time and Type of Dose Delivered
- Table 13.3 Commercialized Autoinjector Combination Products: Information on Route of Administration, Type of Actuation Mechanism, Type of Feedback Mechanism and
- Table 13.4 Commercialized Autoinjector Combination Products: Information on Target Therapeutic Indication and Severity of Indication
- Table 13.5 Commercialized Autoinjector Combination Products: Information on Type of Molecule Delivered, End-user and Target Population
- Table 13.6 Commercialized Autoinjector Combination Products: List of Developers
- Table 14.1 Drug Device Combinations: Early and Late Stage Autoinjectors
- Table 14.2 Early and Late Stage Autoinjector Combination Products: Information on Dose Strength, Target Indication and Severity of Indication
- Table 14.3 Early and Late Stage Autoinjector Combination Products: Information on Type of Molecule Delivered and End-user
- Table 14.4 Early and Late Stage Autoinjector Combination Products: Information on Target Population and Gender of Target Population
- Table 14.5 Early and Late Stage Autoinjector Combination Products: List of Developers
- Table 15.1 Autoinjector Combination Products Developers: List of Companies Profiled
- Table 15.2 Amgen: Company Snapshot
- Table 15.3 Amgen: Autoinjector Combination Product Portfolio
- Table 15.4 ChemProtect.SK: Company Snapshot
- Table 15.5 ChemProtect.SK: Autoinjector Combination Product Portfolio
- Table 15.6 Eli Lilly and Company: Company Snapshot
- Table 15.7 Eli Lilly and Company: Autoinjector Combination Product Portfolio
- Table 15.8 Kindeva Drug Delivery: Company Snapshot
- Table 15.9 Kindeva Drug Delivery: Autoinjector Combination Product Portfolio
- Table 15.10 Merck: Company Snapshot
- Table 15.11 Merck: Autoinjector Combination Product Portfolio
- Table 15.12 Novartis: Company Snapshot
- Table 15.13 Novartis: Autoinjector Combination Product Portfolio
- Table 15.14 Novo Nordisk: Company Snapshot
- Table 15.15 Novo Nordisk: Autoinjector Combination Product Portfolio
- Table 15.16 Sanofi: Company Snapshot
- Table 15.17 Sanofi: Autoinjector Combination Product Portfolio
- Table 15.18 Teva Pharmaceutical Industries: Company Snapshot
- Table 15.19 Teva Pharmaceutical Industries: Autoinjector Combination Product Portfolio
- Table 16.1 Autoinjectors: List of Key Opinion Leaders
- Table 17.1 Anaphylaxis: Commercially Available Autoinjector Combination Products
- Table 17.2 Multiple Sclerosis: Commercially Available Autoinjector Combination Products
- Table 17.3 Migraine: Commercially Available Autoinjector Combination Products
- Table 17.4 Rheumatoid Arthritis: Commercially Available Autoinjector Combination Products
- Table 18.1 List of Medical Device CMOs Offering Services for Drug Delivery Devices
- Table 18.2 Medical Device CMOs Offering Services for Drug Delivery Devices: Information on Production Services
- Table 19.1 Prefilled Syringes: List of Products
- Table 19.2 Prefilled Syringes: List of Manufacturers
- Table 39.1 Autoinjectors: Distribution by Stage of Development
- Table 39.2 Autoinjectors: Distribution by Usability
- Table 39.3 Autoinjectors: Distribution by Type of Primary Drug Container
- Table 39.4 Autoinjectors: Distribution by Requirement of Needle
- Table 39.5 Autoinjectors: Distribution by Volume of Container
- Table 39.6 Autoinjectors: Distribution by Type of Dose Delivered
- Table 39.7 Autoinjectors: Distribution by Route of Administration
- Table 39.8 Autoinjectors: Distribution by Type of Actuation Mechanism
- Table 39.9 Autoinjectors: Distribution by Type of Feedback Mechanism
- Table 39.10 Autoinjectors: Distribution by Availability of Connectivity Feature
- Table 39.11 Autoinjectors: Distribution by Target Indication
- Table 39.12 Autoinjectors: Distribution by Type of Molecule Delivered
- Table 39.13 Autoinjectors: Distribution by End-user
- Table 39.14 Autoinjector Manufacturers: Distribution by Year of Establishment
- Table 39.15 Autoinjector Manufacturers: Distribution by Company Size
- Table 39.16 Autoinjector Manufacturers: Distribution by Location of Headquarters (Region)
- Table 39.17 Autoinjector Manufacturers: Distribution by Location of Headquarters (Country)
- Table 39.18 Autoinjector Manufacturers: Distribution by Company Size and Location of Headquarters
- Table 39.19 Autoinjector Manufacturers: Distribution by Type of Company
- Table 39.20 Most Active Players: Distribution by Number of Autoinjectors
- Table 39.21 Antares Pharma: Annual Revenues, Since FY 2017 (USD Billion)
- Table 39.22 Recipharm: Annual Revenues, Since FY 2018 (SEK Billion)
- Table 39.23 Ypsomed: Annual Revenues, Since FY 2018 (CHF Billion)
- Table 39.24 Partnerships and Collaborations: Cumulative Year-wise Trend, Since 2019
- Table 39.25 Partnerships and Collaborations: Distribution by Type of Partnership
- Table 39.26 Partnerships and Collaborations: Distribution by Year and Type of Partnership
- Table 39.27 Partnerships and Collaborations: Distribution by Type of Product
- Table 39.28 Partnerships and Collaborations: Distribution by Type of Partner
- Table 39.29 Most Active Players: Distribution by Number of Partnerships
- Table 39.90 Partnerships and Collaborations: Intracontinental and Intercontinental Deals
- Table 39.31 Partnerships and Collaborations: International and Local Deals
- Table 39.32 Patent Analysis: Distribution by Type of Patent
- Table 39.33 Patent Analysis: Distribution by Patent Publication Year, Since 2019
- Table 39.34 Patent Analysis: Distribution by Type of Patent and Publication Year
- Table 39.35 Patent Analysis: Distribution by Patent Application Year, Since Pre-2014
- Table 39.36 Patent Analysis: Distribution by Patent Jurisdiction
- Table 39.37 Patent Analysis: Cumulative Year-wise Distribution by Type of Applicant, Since 2019
- Table 39.38 Leading Industry Players: Distribution by Number of Patents
- Table 39.39 Leading Individual Assignees: Distribution by Number of Patents
- Table 39.40 Patent Analysis: Distribution by Patent Age
- Table 39.41 Patent Analysis: Patent Valuation
- Table 39.42 Commercialized Autoinjector Combination Products: Distribution by Approval Year
- Table 39.43 Commercialized Autoinjector Combination Products: Distribution by Usability
- Table 39.44 Commercialized Autoinjector Combination Products: Distribution by Type of Primary Drug Container
- Table 39.45 Commercialized Autoinjector Combination Products: Distribution by Requirement of Needle
- Table 39.46 Commercialized Autoinjector Combination Products: Distribution by Volume of Container
- Table 39.47 Commercialized Autoinjector Combination Products: Distribution by Injection Time
- Table 39.48 Commercialized Autoinjector Combination Products: Distribution by Type of Dose Delivered
- Table 39.49 Commercialized Autoinjector Combination Products: Distribution by Route of Administration
- Table 39.50 Commercialized Autoinjector Combination Products: Distribution by Type of Actuation Mechanism
- Table 39.51 Commercialized Autoinjector Combination Products: Distribution by Type of Feedback Mechanism
- Table 39.52 Commercialized Autoinjector Combination Products: Distribution by Availability of Connectivity Feature
- Table 39.53 Commercialized Autoinjector Combination Products: Distribution by Target Indication
- Table 39.54 Commercialized Autoinjector Combination Products: Distribution by Severity of Indication
- Table 39.55 Commercialized Autoinjector Combination Products: Distribution by Type of Molecule Delivered
- Table 39.56 Commercialized Autoinjector Combination Products: Distribution by End-user
- Table 39.57 Commercialized Autoinjector Combination Products: Distribution by Target Population
- Table 39.58 Commercialized Autoinjector Combination Product Developers: Distribution by Year of Establishment
- Table 39.59 Commercialized Autoinjector Combination Product Developers: Distribution by Company Size
- Table 39.60 Commercialized Autoinjector Combination Product Developers: Distribution by Location of Headquarters (Region)
- Table 39.61 Commercialized Autoinjector Combination Product Developers: Distribution by Location of Headquarters (Country)
- Table 39.62 Commercialized Autoinjector Combination Product Developers: Distribution by Company Size and Location of Headquarters
- Table 39.63 Commercialized Autoinjector Combination Product Developers: Distribution by Type of Company
- Table 39.64 Most Active Players: Distribution by Number of Commercialized Autoinjector Combination Products
- Table 39.65 Early and Late Stage Autoinjector Combination Products: Distribution by Stage of Development
- Table 39.66 Early and Late Stage Autoinjector Combination Products: Distribution by Route of Administration
- Table 39.67 Early and Late Stage Autoinjector Combination Products: Distribution by Dose Strength
- Table 39.68 Early and Late Stage Autoinjector Combination Products: Distribution by Target Indication
- Table 39.69 Early and Late Stage Autoinjector Combination Products: Distribution by Severity of Indication
- Table 39.70 Early and Late Stage Autoinjector Combination Products: Distribution by Type of Molecule Delivered
- Table 39.71 Early and Late Stage Autoinjector Combination Products: Distribution by End- user
- Table 39.72 Early and Late Stage Autoinjector Combination Products: Distribution by Target Population
- Table 39.73 Early and Late Stage Autoinjector Combination Products: Distribution by Gender of Target Population
- Table 39.74 Early and Late Stage Autoinjector Combination Product Developers: Distribution by Year of Establishment
- Table 39.75 Early and Late Stage Autoinjector Combination Product Developers: Distribution by Company Size
- Table 39.76 Early and Late Stage Autoinjector Combination Product Developers: Distribution by Location of Headquarters
- Table 39.77 Early and Late Stage Autoinjector Combination Product Developers: Distribution by Company Size and Location of Headquarters
- Table 39.78 Early and Late Stage Autoinjector Combination Product Developers: Distribution by Type of Company
- Table 39.79 KOL Analysis: Distribution by Role of KOLs
- Table 39.80 KOL Analysis: Distribution by Type of Sponsor Organization
- Table 39.81 KOL Analysis: Distribution by Affiliated Organization
- Table 39.82 KOL Analysis: Distribution by Target Indication
- Table 39.83 KOL Analysis: Distribution by Location of Clinical Trials
- Table 39.84 Most Prominent KOLs: Distribution by Roots Analysis Score
- Table 39.85 Medical Device CMOs Offering Services for Drug Delivery Devices: Distribution by Year of Establishment
- Table 39.86 Medical Device CMOs Offering Services for Drug Delivery Devices: Distribution by Company Size
- Table 39.87 Medical Device CMOs Offering Services for Drug Delivery Devices: Distribution by Location of Headquarters
- Table 39.88 Medical Device CMOs Offering Services for Drug Delivery Devices: Distribution by Types of Services
- Table 39.89 Prefilled Syringes: Distribution by Type of Barrel Fabrication Material
- Table 39.90 Prefilled Syringes: Distribution by Number of Barrel Chambers
- Table 39.91 Prefilled Syringes: Distribution by Type of Needle System
- Table 39.92 Prefilled Syringe Manufacturers: Distribution by Year of Establishment
- Table 39.93 Prefilled Syringe Manufacturers: Distribution by Company Size
- Table 39.94 Prefilled Syringe Manufacturers: Distribution by Location of Headquarters
- Table 39.99 Global Autoinjectors Market, Historical Trends (Since 2018) (USD Billion)
- Table 39.100 Global Autoinjectors Market, Forecasted Estimates (Till 2035), Conservative, Base and Optimistic Scenario (USD Billion)
- Table 39.101 Disposable Autoinjectors Market for Rheumatoid Arthritis, Historical Trends (Since 2018) (USD Billion)
- Table 39.102 Disposable Autoinjectors Market for Rheumatoid Arthritis, Forecasted Estimates (Till 2035), Conservative, Base and Optimistic Scenario (USD Billion)
- Table 39.103 Reusable Autoinjectors Market for Rheumatoid Arthritis, Historical Trends (Since 2018) (USD Billion)
- Table 39.104 Reusable Autoinjectors Market for Rheumatoid Arthritis, Forecasted Estimates (Till 2035), Conservative, Base and Optimistic Scenario (USD Billion)
- Table 39.105 Subcutaneous Autoinjectors Market for Rheumatoid Arthritis, Historical Trends (Since 2018) (USD Billion)
- Table 39.106 Subcutaneous Autoinjectors Market for Rheumatoid Arthritis, Forecasted Estimates (Till 2035), Conservative, Base and Optimistic Scenario (USD Billion)
- Table 39.107 Subcutaneous / Intravenous Autoinjectors Market for Rheumatoid Arthritis, Historical Trends (Since 2018) (USD Billion)
- Table 39.108 Subcutaneous / Intravenous Autoinjectors Market for Rheumatoid Arthritis, Forecasted Estimates (Till 2035), Conservative, Base and Optimistic Scenario (USD Billion)
- Table 39.109 Intravenous Autoinjectors Market for Rheumatoid Arthritis, Historical Trends (Since 2018) (USD Billion)
- Table 39.110 Intravenous Autoinjectors Market for Rheumatoid Arthritis, Forecasted Estimates (Till 2035), Conservative, Base and Optimistic Scenario (USD Billion)
- Table 39.111 Proteins Autoinjectors Market for Rheumatoid Arthritis, Historical Trends (Since 2018) (USD Billion)
- Table 39.112 Proteins Autoinjectors Market for Rheumatoid Arthritis, Forecasted Estimates (Till 2035), Conservative, Base and Optimistic Scenario (USD Billion)
- Table 39.113 Antibody-based Autoinjectors Market for Rheumatoid Arthritis, Historical Trends (Since 2018) (USD Billion)
- Table 39.114 Antibody-based Autoinjectors Market for Rheumatoid Arthritis, Forecasted Estimates (Till 2035), Conservative, Base and Optimistic Scenario (USD Billion)
- Table 39.115 Small Molecule-based Autoinjectors Market for Rheumatoid Arthritis, Historical Trends (Since 2018) (USD Billion)
- Table 39.116 Small Molecule-based Autoinjectors Market for Rheumatoid Arthritis, Forecasted Estimates (Till 2035), Conservative, Base and Optimistic Scenario (USD Billion)
- Table 39.117 Disposable Autoinjectors Market for Multiple Sclerosis, Historical Trends (Since 2018) (USD Billion)
- Table 39.118 Disposable Autoinjectors Market for Multiple Sclerosis, Forecasted Estimates (Till 2035), Conservative, Base and Optimistic Scenario (USD Billion)
- Table 39.119 Reusable Autoinjectors Market for Multiple Sclerosis, Historical Trends (Since 2018) (USD Billion)
- Table 39.120 Reusable Autoinjectors Market for Multiple Sclerosis, Forecasted Estimates (Till 2035), Conservative, Base and Optimistic Scenario (USD Billion)
- Table 39.121 Subcutaneous Autoinjectors Market for Multiple Sclerosis, Historical Trends (Since 2018) (USD Billion)
- Table 39.122 Subcutaneous Autoinjectors Market for Multiple Sclerosis, Forecasted Estimates (Till 2035), Conservative, Base and Optimistic Scenario (USD Billion)
- Table 39.123 Intramuscular Autoinjectors Market for Multiple Sclerosis, Historical Trends (Since 2018) (USD Billion)
- Table 39.124 Intramuscular Autoinjectors Market for Multiple Sclerosis, Forecasted Estimates (Till 2035), Conservative, Base and Optimistic Scenario (USD Billion)
- Table 39.125 Protein-based Autoinjectors Market for Multiple Sclerosis, Historical Trends (Since 2018) (USD Billion)
- Table 39.126 Protein-based Autoinjectors Market for Multiple Sclerosis, Forecasted Estimates (Till 2035), Conservative, Base and Optimistic Scenario (USD Billion)
- Table 39.127 Peptide-based Autoinjectors Market for Multiple Sclerosis, Historical Trends (Since 2018) (USD Billion)
- Table 39.128 Peptide-based Autoinjectors Market for Multiple Sclerosis, Forecasted Estimates (Till 2035), Conservative, Base and Optimistic Scenario (USD Billion)
- Table 39.129 Antibody-based Autoinjectors Market for Multiple Sclerosis, Historical Trends (Since 2018) (USD Billion)
- Table 39.130 Antibody-based Autoinjector Market for Multiple Sclerosis, Forecasted Estimates (Till 2035), Conservative, Base and Optimistic Scenario (USD Billion)
- Table 39.131 Disposable Autoinjectors Market for Diabetes, Historical Trends (Since 2018) (USD Billion)
- Table 39.132 Disposable Autoinjectors Market for Diabetes, Forecasted Estimates (Till 2035), Conservative, Base and Optimistic Scenario (USD Billion)
- Table 39.133 Reusable Autoinjectors Market for Diabetes, Historical Trends (Since 2018) (USD Billion)
- Table 39.134 Reusable Autoinjectors Market for Diabetes, Forecasted Estimates (Till 2035), Conservative, Base and Optimistic Scenario (USD Billion)
- Table 39.135 Subcutaneous Autoinjectors Market for Diabetes, Historical Trends (Since 2018) (USD Billion)
- Table 39.136 Subcutaneous Autoinjectors Market for Diabetes, Forecasted Estimates (Till 2035), Conservative, Base and Optimistic Scenario (USD Billion)
- Table 39.137 Protein-based Autoinjectors Market for Diabetes, Historical Trends (Since 2018) (USD Billion)
- Table 39.138 Protein-based Autoinjectors Market for Diabetes, Forecasted Estimates (Till 2035), Conservative, Base and Optimistic Scenario (USD Billion)
- Table 39.139 Antibody-based Autoinjectors Market for Diabetes, Historical Trends (Since 2018) (USD Billion)
- Table 39.140 Antibody-based Autoinjectors Market for Diabetes, Forecasted Estimates (Till 2035), Conservative, Base and Optimistic Scenario (USD Billion)
- Table 39.141 Disposable Autoinjectors Market for Anaphylaxis, Historical Trends (Since 2018) (USD Billion)
- Table 39.142 Disposable Autoinjectors Market for Anaphylaxis, Forecasted Estimates (Till 2035), Conservative, Base and Optimistic Scenario (USD Billion)
- Table 39.143 Intramuscular Autoinjectors Market for Anaphylaxis, Historical Trends (Since 2018) (USD Billion)
- Table 39.144 Intramuscular Autoinjectors Market for Anaphylaxis, Forecasted Estimates (Till 2035), Conservative, Base and Optimistic Scenario (USD Billion)
- Table 39.145 Subcutaneous / Intramuscular Autoinjectors Market for Anaphylaxis, Historical Trends (Since 2018) (USD Billion)
- Table 39.146 Subcutaneous / Intramuscular Autoinjectors Market for Anaphylaxis, Forecasted Estimates (Till 2035), Conservative, Base and Optimistic Scenario (USD Billion)
- Table 39.147 Small Molecule-based Autoinjectors Market for Anaphylaxis, Historical Trends (Since 2018) (USD Billion)
- Table 39.148 Small Molecule-based Autoinjectors Market for Anaphylaxis, Forecasted Estimates (Till 2035), Conservative, Base and Optimistic Scenario (USD Billion)
- Table 39.149 Disposable Autoinjectors Market for Weight Loss, Historical Trends (Since 2018) (USD Billion)
- Table 39.150 Disposable Autoinjectors Market for Weight Loss, Forecasted Estimates (Till 2035), Conservative, Base and Optimistic Scenario (USD Billion)
- Table 39.151 Subcutaneous Autoinjectors Market for Weight Loss, Historical Trends (Since 2018) (USD Billion)
- Table 39.152 Subcutaneous Autoinjectors Market for Weight Loss, Forecasted Estimates (Till 2035), Conservative, Base and Optimistic Scenario (USD Billion)
- Table 39.153 Peptide-based Autoinjectors Market for Weight Loss, Historical Trends (Since 2018) (USD Billion)
- Table 39.154 Peptide-based Autoinjectors Market for Weight Loss, Forecasted Estimates (Till 2035), Conservative, Base and Optimistic Scenario (USD Billion)
- Table 39.155 Small Molecule-based Autoinjectors Market for Anaphylaxis, Historical Trends (Since 2018) (USD Billion)
- Table 39.156 Small Molecule-based Autoinjectors Market for Anaphylaxis, Forecasted Estimates (Till 2035), Conservative, Base and Optimistic Scenario (USD Billion)
- Table 39.157 Disposable Autoinjectors Market for Migraine, Historical Trends (Since 2018) (USD Billion)
- Table 39.158 Disposable Autoinjectors Market for Migraine, Forecasted Estimates (Till 2035), Conservative, Base and Optimistic Scenario (USD Billion)
- Table 39.159 Subcutaneous Autoinjectors Market for Migraine, Historical Trends (Since 2018) (USD Billion)
- Table 39.160 Subcutaneous Autoinjectors Market for Migraine, Forecasted Estimates (Till 2035), Conservative, Base and Optimistic Scenario (USD Billion)
- Table 39.161 Antibody-based Autoinjectors Market for Migraine, Historical Trends (Since 2018) (USD Billion)
- Table 39.162 Antibody-based Autoinjectors Market for Migraine, Forecasted Estimates (Till 2035), Conservative, Base and Optimistic Scenario (USD Billion)
- Table 39.163 Protein-based Autoinjectors Market for Migraine, Historical Trends (Since 2018) (USD Billion)
- Table 39.164 Protein-based Autoinjectors Market for Migraine, Forecasted Estimates (Till 2035), Conservative, Base and Optimistic Scenario (USD Billion)
- Table 39.165 Small Molecule-based Autoinjectors Market for Migraine, Historical Trends (Since 2018) (USD Billion)
- Table 39.166 Small Molecule-based Autoinjectors Market for Migraine, Forecasted Estimates (Till 2035), Conservative, Base and Optimistic Scenario (USD Billion)
- Table 39.167 Disposable Autoinjectors Market for Other Indications, Historical Trends (Since 2018) (USD Billion)
- Table 39.168 Disposable Autoinjectors Market for Other Indications, Forecasted Estimates (Till 2035), Conservative, Base and Optimistic Scenario (USD Billion)
- Table 39.169 Reusable Autoinjectors Market for Other Indications, Historical Trends (Since 2018) (USD Billion)
- Table 39.170 Reusable Autoinjectors Market for Other Indications, Forecasted Estimates (Till 2035), Conservative, Base and Optimistic Scenario (USD Billion)
- Table 39.171 Subcutaneous Autoinjectors Market for Other Indications, Historical Trends (Since 2018) (USD Billion)
- Table 39.172 Subcutaneous Autoinjectors Market for Other Indications, Forecasted Estimates (Till 2035), Conservative, Base and Optimistic Scenario (USD Billion)
- Table 39.173 Subcutaneous / Intramuscular Autoinjectors Market for Other Indications, Historical Trends (Since 2018) (USD Billion)
- Table 39.174 Subcutaneous / Intramuscular Autoinjectors Market for Other Indications, Forecasted Estimates (Till 2035), Conservative, Base and Optimistic Scenario (USD Billion)
- Table 39.175 Subcutaneous / Intravenous Autoinjectors Market for Other Indications, Historical Trends (Since 2018) (USD Billion)
- Table 39.176 Subcutaneous / Intravenous Autoinjectors Market for Other Indications, Forecasted Estimates (Till 2035), Conservative, Base and Optimistic Scenario (USD Billion)
- Table 39.177 Antibody-based Autoinjectors Market for Other Indications, Historical Trends (Since 2018) (USD Billion)
- Table 39.178 Antibody-based Autoinjectors Market for Other Indications, Forecasted Estimates (Till 2035), Conservative, Base and Optimistic Scenario (USD Billion)
- Table 39.179 Protein-based Autoinjectors Market for Other Indications, Historical Trends (Since 2018) (USD Billion)
- Table 39.180 Protein-based Autoinjectors Market for Other Indications, Forecasted Estimates (Till 2035), Conservative, Base and Optimistic Scenario (USD Billion)
- Table 39.181 Small Molecule-based Autoinjectors Market for Other Indications, Historical Trends (Since 2018) (USD Billion)
- Table 39.182 Small Molecule-based Autoinjectors Market for Other Indications, Forecasted Estimates (Till 2035), Conservative, Base and Optimistic Scenario (USD Billion)
- Table 39.183 Other Molecule-based Autoinjectors Market for Other Indications, Historical Trends (Since 2018) (USD Billion)
- Table 39.184 Other Molecule-based Autoinjectors Market for Other Indications, Forecasted Estimates (Till 2035), Conservative, Base and Optimistic Scenario (USD Billion)
- Table 39.185 Autoinjectors Market: Distribution by Usability
- Table 39.186 Disposable Autoinjectors Market, Historical Trends (Since 2018) (USD Billion)
- Table 39.187 Disposable Autoinjectors Market, Forecasted Estimates (Till 2035), Conservative, Base and Optimistic Scenario (USD Billion)
- Table 39.188 Reusable Autoinjectors Market, Historical Trends (Since 2018) (USD Billion)
- Table 39.189 Reusable Autoinjectors Market, Forecasted Estimates (Till 2035), Conservative, Base and Optimistic Scenario (USD Billion)
- Table 39.190 Autoinjectors Market: Distribution by Route of Administration
- Table 39.191 Autoinjectors Market for Subcutaneous Administration, Historical Trends (Since 2018) (USD Billion)
- Table 39.192 Autoinjectors Market for Subcutaneous Administration, Forecasted Estimates (Till 2035), Conservative, Base and Optimistic Scenario (USD Billion)
- Table 39.193 Autoinjectors Market for Intramuscular Administration, Historical Trends (Since 2018) (USD Billion)
- Table 39.194 Autoinjectors Market for Intramuscular Administration, Forecasted Estimates (Till 2035), Conservative, Base and Optimistic Scenario (USD Billion)
- Table 39.195 Autoinjectors Market for Intravenous Administration, Historical Trends (Since 2018) (USD Billion)
- Table 39.196 Autoinjectors Market for Intravenous Administration t, Forecasted Estimates (Till 2035), Conservative, Base and Optimistic Scenario (USD Billion)
- Table 39.197 Autoinjectors Market for Subcutaneous / Intramuscular Administration, Historical Trends (Since 2018) (USD Billion)
- Table 39.198 Autoinjectors Market for Subcutaneous / Intramuscular Administration, Forecasted Estimates (Till 2035), Conservative, Base and Optimistic Scenario (USD Billion)
- Table 39.199 Autoinjectors Market for Subcutaneous / Intravenous Administration, Historical Trends (Since 2018) (USD Billion)
- Table 39.200 Autoinjectors Market for Subcutaneous / Intravenous Administration, Forecasted Estimates (Till 2035), Conservative, Base and Optimistic Scenario (USD Billion)
- Table 39.201 Autoinjectors Market: Distribution by Type of Molecule Delivered
- Table 39.202 Autoinjectors Market for Proteins, Historical Trends (Since 2018) (USD Billion)
- Table 39.203 Autoinjectors Market for Proteins, Forecasted Estimates (Till 2035), Conservative, Base and Optimistic Scenario (USD Billion)
- Table 39.204 Autoinjectors Market for Small Molecules, Historical Trends (Since 2018) (USD Billion)
- Table 39.205 Autoinjectors Market for Small Molecules, Forecasted Estimates (Till 2035), Conservative, Base and Optimistic Scenario (USD Billion)
- Table 39.206 Autoinjectors Market for Antibodies, Historical Trends (Since 2018) (USD Billion)
- Table 39.207 Autoinjectors Market for Antibodies, Forecasted Estimates (Till 2035), Conservative, Base and Optimistic Scenario (USD Billion)
- Table 39.208 Autoinjectors Market for Peptides, Historical Trends (Since 2018) (USD Billion)
- Table 39.209 Autoinjectors Market for Peptides, Forecasted Estimates (Till 2035), Conservative, Base and Optimistic Scenario (USD Billion)
- Table 39.210 Autoinjectors Market for Other Molecules, Historical Trends (Since 2018) (USD Billion)
- Table 39.211 Autoinjectors Market for Other Molecules, Forecasted Estimates (Till 2035), Conservative, Base and Optimistic Scenario (USD Billion)
- Table 39.212 Autoinjectors Market: Distribution by Type of Actuation Mechanism
- Table 39.213 Autoinjectors Market for Manual Actuation, Historical Trends (Since 2018) (USD Billion)
- Table 39.214 Autoinjectors Market for Manual Actuation, Forecasted Estimates (Till 2035), Conservative, Base and Optimistic Scenario (USD Billion)
- Table 39.215 Autoinjectors Market for Automatic Actuation, Historical Trends (Since 2018) (USD Billion)
- Table 39.216 Autoinjectors Market for Automatic Actuation, Forecasted Estimates (Till 2035), Conservative, Base and Optimistic Scenario (USD Billion)
- Table 39.217 Autoinjectors Market: Distribution by Volume of Container
- Table 39.218 Autoinjectors Market for Less than 1 mL Volume, Historical Trends (Since 2018) (USD Billion)
- Table 39.219 Autoinjectors Market for Less than 1 mL Volume, Forecasted Estimates (Till 2035), Conservative, Base and Optimistic Scenario (USD Billion)
- Table 39.220 Autoinjectors Market for 1-2 mL Volume, Historical Trends (Since 2018) (USD Billion)
- Table 39.221 Autoinjectors Market for 1-2 mL Volume, Forecasted Estimates (Till 2035), Conservative, Base and Optimistic Scenario (USD Billion)
- Table 39.222 Autoinjectors Market for More than 2 mL Volume, Historical Trends (Since 2018) (USD Billion)
- Table 39.223 Autoinjectors Market for More than 2 mL Volume, Forecasted Estimates (Till 2035), Conservative, Base and Optimistic Scenario (USD Billion)
- Table 39.224 Autoinjectors Market: Distribution by End-user
- Table 39.225 Autoinjectors Market for Home Care, Historical Trends (Since 2018) (USD Billion)
- Table 39.226 Autoinjectors Market for Home Care, Forecasted Estimates (Till 2035), Conservative, Base and Optimistic Scenario (USD Billion)
- Table 39.227 Autoinjectors Market for Hospitals and Clinics, Historical Trends (Since 2018) (USD Billion)
- Table 39.228 Autoinjectors Market for Hospitals and Clinics, Forecasted Estimates (Till 2035), Conservative, Base and Optimistic Scenario (USD Billion)
- Table 39.229 Autoinjectors Market for Ambulatory Surgical Centers, Historical Trends (Since 2018) (USD Billion)
- Table 39.230 Autoinjectors Market for Ambulatory Surgical Centers, Forecasted Estimates (Till 2035), Conservative, Base and Optimistic Scenario (USD Billion)
- Table 39.231 Autoinjectors Market: Distribution by Target Indication
- Table 39.232 Autoinjectors Market for Rheumatoid Arthritis, Historical Trends (Since 2018) (USD Billion)
- Table 39.233 Autoinjectors Market for Rheumatoid Arthritis, Forecasted Estimates (Till 2035)
List of Figures
- Figure 2.1 Research Methodology: Project Methodology
- Figure 2.2 Research Methodology: Secondary Research: Data Sources
- Figure 3.1 Lessons Learnt from Past Recessions
- Figure 4.1 Executive Summary: Autoinjectors Market Overview
- Figure 4.2 Executive Summary: Partnerships and Collaborations
- Figure 4.3 Executive Summary: Patent Analysis
- Figure 4.4 Executive Summary: Commercialized Autoinjector Combination Products Market Overview
- Figure 4.5 Executive Summary: Early and Late Stage Autoinjector Combination Products Market Overview
- Figure 4.6 Executive Summary: Market Forecast and Opportunity Analysis
- Figure 5.1 Drug Delivery Systems
- Figure 5.2 Types of Self-Injection Devices
- Figure 5.3 Components of Autoinjector
- Figure 5.4 Cartridge Based Autoinjectors versus Prefilled Syringe Based Autoinjectors
- Figure 5.5 Classification of Autoinjectors
- Figure 7.1 Autoinjectors: Distribution by Stage of Development
- Figure 7.2 Autoinjectors: Distribution by Usability
- Figure 7.3 Autoinjectors: Distribution by Type of Primary Drug Container
- Figure 7.4 Autoinjectors: Distribution by Requirement of Needle
- Figure 7.5 Autoinjectors: Distribution by Volume of Container
- Figure 7.6 Autoinjectors: Distribution by Type of Dose Delivered
- Figure 7.7 Autoinjectors: Distribution by Route of Administration
- Figure 7.8 Autoinjectors: Distribution by Type of Actuation Mechanism
- Figure 7.9 Autoinjectors: Distribution by Type of Feedback Mechanism
- Figure 7.10 Autoinjectors: Distribution by Availability of Connectivity Feature
- Figure 7.11 Autoinjectors: Distribution by Target Indication
- Figure 7.12 Autoinjectors: Distribution by Type of Molecule Delivered
- Figure 7.13 Autoinjectors: Distribution by End-user
- Figure 7.14 Autoinjector Manufacturers: Distribution by Year of Establishment
- Figure 7.15 Autoinjector Manufacturers: Distribution by Company Size
- Figure 7.16 Autoinjector Manufacturers: Distribution by Location of Headquarters (Region)
- Figure 7.17 Autoinjector Manufacturers: Distribution by Location of Headquarters (Country)
- Figure 7.18 Autoinjector Manufacturers: Distribution by Company Size and Location of Headquarters
- Figure 7.19 Autoinjector Manufacturers: Distribution by Type of Company
- Figure 7.20 Most Active Players: Distribution by Number of Autoinjectors
- Figure 8.1 Product Competitiveness Analysis: Disposable Autoinjectors
- Figure 8.2 Product Competitiveness Analysis: Reusable Autoinjectors
- Figure 9.1 Brand Positioning Analysis: Competitive Advantage
- Figure 9.2 Brand Positioning Analysis: Reasons to Believe
- Figure 9.3 Brand Positioning Framework: Owen Mumford
- Figure 9.4 Brand Positioning Framework: Ypsomed
- Figure 9.5 Brand Positioning Framework: Elcam Medical
- Figure 9.6 Brand Positioning Framework: SHL Medical
- Figure 9.7. Brand Positioning Framework: Union Medico
- Figure 9.8 Brand Positioning Framework: Antares Pharma
- Figure 9.9 Brand Positioning Framework: PreciHealth
- Figure 9.10 Brand Positioning Framework: Jiangsu Delfu Medical Device
- Figure 9.11 Brand Positioning Framework: Oval Medical Technologies
- Figure 9.12 Brand Positioning Framework: Recipharm
- Figure 10.1 Antares Pharma: Annual Revenues, Since FY 2017 (USD Billion)
- Figure 10.2 Recipharm: Annual Revenues, Since FY 2018 (SEK Billion)
- Figure 10.3 Ypsomed: Annual Revenues, Since FY 2018 (CHF Billion)
- Figure 11.1 Partnerships and Collaborations: Cumulative Year-wise Trend, Since Pre-2019
- Figure 11.2 Partnerships and Collaborations: Distribution by Type of Partnership
- Figure 11.3 Partnerships and Collaborations: Distribution by Year and Type of Partnership
- Figure 11.4 Partnerships and Collaborations: Distribution by Type of Product
- Figure 11.5 Partnerships and Collaborations: Distribution by Type of Partner
- Figure 11.6 Most Active Players: Distribution by Number of Partnerships
- Figure 11.7 Partnerships and Collaborations: Intracontinental and Intercontinental Deals
- Figure 11.8 Partnerships and Collaborations: International and Local Deals
- Figure 12.1 Patent Analysis: Distribution by Type of Patent
- Figure 12.2 Patent Analysis: Cumulative Distribution by Patent Publication Year, Since 2019
- Figure 12.3 Patent Analysis: Distribution by Type of Patent and Publication Year
- Figure 12.4 Patent Analysis: Distribution by Patent Application Year, Since Pre-2014
- Figure 12.5 Patent Analysis: Distribution by Patent Jurisdiction
- Figure 12.6 Patent Analysis: Distribution by CPC Symbols
- Figure 12.7 Patent Analysis: Cumulative Year-wise Distribution by Type of Applicant, Since 2019
- Figure 12.8 Leading Industry Players: Distribution by Number of Patents
- Figure 12.9 Leading Individual Assignees: Distribution by Number of Patents
- Figure 12.10 Patent Benchmarking Analysis: Distribution of Leading Industry Players by Patent Characteristics (Top CPC Codes)
- Figure 12.11 Patent Benchmarking Analysis: Distribution of Patent Characteristics (CPC Codes) by Leading Industry Players
- Figure 12.12 Patent Analysis: Distribution by Patent Age
- Figure 12.13 Patent Valuation
- Figure 13.1 Commercialized Autoinjector Combination Products: Distribution by Approval Year
- Figure 13.2 Commercialized Autoinjector Combination Products: Distribution by Usability
- Figure 13.3 Commercialized Autoinjector Combination Products: Distribution by Type of Primary Drug Container
- Figure 13.4 Commercialized Autoinjector Combination Products: Distribution by Requirement of Needle
- Figure 13.5 Commercialized Autoinjector Combination Products: Distribution by Volume of Container
- Figure 13.6 Commercialized Autoinjector Combination Products: Distribution by Injection Time
- Figure 13.7 Commercialized Autoinjector Combination Products: Distribution by Type of Dose Delivered
- Figure 13.8 Commercialized Autoinjector Combination Products: Distribution by Route of Administration
- Figure 13.9 Commercialized Autoinjector Combination Products: Distribution by Type of Actuation Mechanism
- Figure 13.10 Commercialized Autoinjector Combination Products: Distribution by Type of Feedback Mechanism
- Figure 13.11 Commercialized Autoinjector Combination Products: Distribution by Availability of Connectivity Feature
- Figure 13.12 Commercialized Autoinjector Combination Products: Distribution by Target Indication
- Figure 13.13 Commercialized Autoinjector Combination Products: Distribution by Severity of Indication
- Figure 13.14 Commercialized Autoinjector Combination Products: Distribution by Type of Molecule Delivered
- Figure 13.15 Commercialized Autoinjector Combination Products: Distribution by End-user
- Figure 13.16 Commercialized Autoinjector Combination Products: Distribution by Target Population
- Figure 13.17 Commercialized Autoinjector Combination Product Developers: Distribution by Year of Establishment
- Figure 13.18 Commercialized Autoinjector Combination Product Developers: Distribution by Company Size
- Figure 13.19 Commercialized Autoinjector Combination Product Developers: Distribution by Location of Headquarters
- Figure 13.20 Commercialized Autoinjector Combination Product Developers: Distribution by Company Size and Location of
- Figure 13.21 Commercialized Autoinjector Combination Product Developers: Distribution by Type of Company
- Figure 13.22 Most Active Players: Distribution by Number of Commercialized Autoinjector Combination Products
- Figure 14.1 Early and Late Stage Autoinjector Combination Products: Distribution by Stage of Development
- Figure 14.2 Early and Late Stage Autoinjector Combination Products: Distribution by Route of Administration
- Figure 14.3 Early and Late Stage Autoinjector Combination Products: Distribution by
- Figure 14.4 Early and Late Stage Autoinjector Combination Products: Distribution by Target Indication
- Figure 14.5 Early and Late Stage Autoinjector Combination Products: Distribution by Severity of Indication
- Figure 14.6 Early and Late Stage Autoinjector Combination Products: Distribution by Type of Molecule Delivered
- Figure 14.7 Early and Late Stage Autoinjector Combination Products: Distribution by End- user
- Figure 14.8 Early and Late Stage Autoinjector Combination Products: Distribution by Target Population
- Figure 14.9 Early and Late Stage Autoinjector Combination Products: Distribution by Gender of Target Population
- Figure 14.10 Early and Late Stage Autoinjector Combination Product Developers: Distribution by Year of Establishment
- Figure 14.11 Early and Late Stage Autoinjector Combination Product Developers: Distribution by Company Size
- Figure 14.12 Early and Late Stage Autoinjector Combination Product Developers: Distribution by Location of Headquarters
- Figure 14.13 Early and Late Stage Autoinjector Combination Product Developers: Distribution by Company Size and Location of Headquarters
- Figure 14.14 Early and Late Stage Autoinjector Combination Product Developers: Distribution by Type of Company
- Figure 16.1 KOL Analysis: Distribution by Role of KOLs
- Figure 16.2 KOL Analysis: Distribution by Type of Sponsor Organization
- Figure 16.3 KOL Analysis: Distribution by Affiliated Organization
- Figure 16.4 KOL Analysis: Distribution by Target Indication
- Figure 16.5 KOL Analysis: Distribution by Location of Clinical Trials
- Figure 16.6 Most Prominent KOLs: Distribution by Activeness, Expertise and Strength of KOL
- Figure 16.7 Most Prominent KOLs: Distribution by Roots Analysis Score
- Figure 18.1 Challenges Associated with Medical Device Manufacturing
- Figure 18.2 Services Offered by Medical Device CMOs
- Figure 18.3 Advantages of Outsourcing to CMOs
- Figure 18.4 Risks Associated with Outsourcing to CMOs
- Figure 18.5 Medical Device CMOs Offering Services for Drug Delivery Devices: Distribution by Year of Establishment
- Figure 18.6 Medical Device CMOs Offering Services for Drug Delivery Devices: Distribution by Company Size
- Figure 18.7 Medical Device CMOs Offering Services for Drug Delivery Devices: Distribution by Location of Headquarters
- Figure 18.8 Medical Device CMOs Offering Services for Drug Delivery Devices: Distribution by Types of Services
- Figure 19.1 Prefilled Syringes: Distribution by Type of Barrel Fabrication Material
- Figure 19.2 Prefilled Syringes: Distribution by Number of Barrel Chambers
- Figure 19.3 Prefilled Syringes: Distribution by Type of Needle System
- Figure 19.4 Prefilled Syringe Manufacturers: Distribution by Year of Establishment
- Figure 19.5 Prefilled Syringe Manufacturers: Distribution by Company Size
- Figure 19.6 Prefilled Syringe Manufacturers: Distribution by Location of Headquarters
- Figure 20.1 Autoinjectors: SWOT Analysis
- Figure 20.2 Comparison of SWOT Factors: Harvey Ball Analysis
- Figure 21.1 Global Autoinjectors Market, Historical Trends (Since 2018) and Forecasted Estimates (Till 2035) (USD Billion)
- Figure 21.2 Global Autoinjectors Market, Forecasted Estimates (Till 2035): Conservative Scenario (USD Billion)
- Figure 21.3 Global Autoinjectors Market, Forecasted Estimates (Till 2035): Optimistic Scenario (USD Billion)
- Figure 22.1 Disposable Autoinjectors Market for Rheumatoid Arthritis, Historical Trends (Since 2018) and Forecasted Estimates (Till 2035) (USD Billion)
- Figure 22.2 Reusable Autoinjectors Market for Rheumatoid Arthritis, Historical Trends (Since 2018) and Forecasted Estimates (Till 2035) (USD Billion)
- Figure 22.3 Subcutaneous Autoinjectors Market for Rheumatoid Arthritis, Historical Trends (Since 2018) and Forecasted Estimates (Till 2035) (USD Billion)
- Figure 22.4 Subcutaneous / Intravenous Autoinjectors Market for Rheumatoid Arthritis, Historical Trends (Since 2018) and Forecasted Estimates (Till 2035) (USD Billion)
- Figure 22.5 Intravenous Autoinjectors Market for Rheumatoid Arthritis, Historical Trends (Since 2018) and Forecasted Estimates (Till 2035) (USD Billion)
- Figure 22.6 Protein-based Autoinjectors Market for Rheumatoid Arthritis, Historical Trends (Since 2018) and Forecasted Estimates (Till 2035) (USD Billion)
- Figure 22.7 Antibody-based Autoinjectors Market for Rheumatoid Arthritis, Historical Trends (Since 2018) and Forecasted Estimates (Till 2035) (USD Billion)
- Figure 22.8 Small Molecule-based Autoinjectors Market for Rheumatoid Arthritis, Historical Trends (Since 2018) and Forecasted Estimates (Till 2035) (USD Billion)
- Figure 23.1 Disposable Autoinjectors Market for Multiple Sclerosis, Historical Trends (Since 2018) and Forecasted Estimates (Till 2035) (USD Billion)
- Figure 23.2 Reusable Autoinjectors Market for Multiple Sclerosis, Historical Trends (Since 2018) and Forecasted Estimates (Till 2035) (USD Billion)
- Figure 23.3 Subcutaneous Autoinjectors Market for Multiple Sclerosis, Historical Trends (Since 2018) and Forecasted Estimates (Till 2035) (USD Billion)
- Figure 23.4 Intramuscular Autoinjectors Market for Multiple Sclerosis, Historical Trends (Since 2018) and Forecasted Estimates (Till 2035) (USD Billion)
- Figure 23.5 Protein-based Autoinjectors Market for Multiple Sclerosis, Historical Trends (Since 2018) and Forecasted Estimates (Till 2035) (USD Billion)
- Figure 23.6 Peptide-based Autoinjectors Market for Multiple Sclerosis, Historical Trends (Since 2018) and Forecasted Estimates (Till 2035) (USD Billion)
- Figure 23.7 Antibody-based Autoinjectors Market for Multiple Sclerosis, Historical Trends (Since 2018) and Forecasted Estimates (Till 2035) (USD Billion)
- Figure 24.1 Disposable Autoinjectors Market for Diabetes, Historical Trends (Since 2018) and Forecasted Estimates (Till 2035) (USD Billion)
- Figure 24.2 Reusable Autoinjectors Market for Diabetes, Historical Trends (Since 2018) and Forecasted Estimates (Till 2035) (USD Billion)
- Figure 24.3 Subcutaneous Autoinjectors Market for Diabetes, Historical Trends (Since 2018) and Forecasted Estimates (Till 2035) (USD Billion)
- Figure 24.4 Protein-based Autoinjectors Market for Diabetes, Historical Trends (Since 2018) and Forecasted Estimates (Till 2035)
- Figure 24.5 Antibody-based Autoinjectors Market for Diabetes, Historical Trends (Since 2018) and Forecasted Estimates (Till 2035) (USD Billion)
- Figure 25.1 Disposable Autoinjectors Market for Weight Loss, Historical Trends (Since 2018) and Forecasted Estimates (Till 2035) (USD Billion)
- Figure 25.2 Subcutaneous Autoinjectors Market for Weight Loss, Historical Trends (Since 2018) and Forecasted Estimates (Till 2035) (USD Billion)
- Figure 25.3 Peptide-based Autoinjectors Market for Weight Loss, Historical Trends (Since 2018) and Forecasted Estimates (Till 2035) (USD Billion)
- Figure 25.4 Small Molecule-based Autoinjectors Market for Weight Loss, Historical Trends (Since 2018) and Forecasted Estimates (Till 2035) (USD Billion)
- Figure 26.1 Disposable Autoinjectors Market for Anaphylaxis, Historical Trends (Since 2018) and Forecasted Estimates (Till 2035) (USD Billion)
- Figure 26.2 Subcutaneous / Intramuscular Autoinjectors Market for Anaphylaxis, Historical Trends (Since 2018) and Forecasted Estimates (Till 2035) (USD Billion)
- Figure 26.3 Intramuscular Autoinjectors Market for Anaphylaxis, Historical Trends (Since 2018) and Forecasted Estimates (Till 2035) (USD Billion)
- Figure 26.4 Small Molecule-based Autoinjectors Market for Anaphylaxis, Historical Trends (Since 2018) and Forecasted Estimates (Till 2035) (USD Billion)
- Figure 27.1 Disposable Autoinjectors Market for Migraine, Historical Trends (Since 2018) and Forecasted Estimates (Till 2035) (USD Billion)
- Figure 27.2 Subcutaneous Autoinjectors Market for Migraine, Historical Trends (Since 2018) and Forecasted Estimates (Till 2035) (USD Billion)
- Figure 27.3 Antibody-based Autoinjectors Market for Migraine, Historical Trends (Since 2018) and Forecasted Estimates (Till 2035) (USD Billion)
- Figure 27.4 Protein-based Autoinjectors Market for Migraine, Historical Trends (Since 2018) and Forecasted Estimates (Till 2035)
- Figure 27.5 Small Molecule-based Autoinjectors Market for Migraine, Historical Trends (Since 2018) and Forecasted Estimates (Till 2035) (USD Billion)
- Figure 28.1 Disposable Autoinjectors Market for Other Indications, Historical Trends (Since 2018) and Forecasted Estimates (Till 2035) (USD Billion)
- Figure 28.2 Reusable Autoinjectors Market for Other Indications, Historical Trends (Since 2018) and Forecasted Estimates (Till 2035) (USD Billion)
- Figure 28.3 Subcutaneous Autoinjectors Market for Other Indications, Historical Trends (Since 2018) and Forecasted Estimates (Till 2035) (USD Billion)
- Figure 28.4 Subcutaneous / Intramuscular Autoinjectors Market for Other Indications, Historical Trends (Since 2018) and Forecasted Estimates (Till 2035) (USD Billion)
- Figure 28.5 Subcutaneous / Intravenous Autoinjectors Market for Other Indications, Historical Trends (Since 2018) and Forecasted Estimates (Till 2035) (USD Billion)
- Figure 28.6 Antibody-based Autoinjectors Market for Other Indications, Historical Trends (Since 2018) and Forecasted Estimates (Till 2035) (USD Billion)
- Figure 28.7 Protein-based Autoinjectors Market for Other Indications, Historical Trends (Since 2018) and Forecasted Estimates (Till 2035) (USD Billion)
- Figure 28.8 Small Molecule-based Autoinjectors Market for Other Indications, Historical Trends (Since 2018) and Forecasted Estimates (Till 2035) (USD Billion)
- Figure 28.9 Other Molecule-based Autoinjectors Market for Other Indications, Historical Trends (Since 2018) and Forecasted Estimates (Till 2035) (USD Billion)
- Figure 29.1 Autoinjectors Market: Distribution by Usability
- Figure 29.2 Disposable Autoinjectors Market: Historical Trends (Since 2018) and Forecasted Estimates (Till 2035) (USD Billion)
- Figure 29.3 Reusable Autoinjectors Market: Historical Trends (Since 2018) and Forecasted Estimates (Till 2035) (USD Billion)
- Figure 30.1 Autoinjectors Market: Distribution by Route of Administration
- Figure 30.2 Autoinjectors Market for Subcutaneous Administration: Historical Trends (Since 2018) and Forecasted Estimates (Till 2035) (USD Billion)
- Figure 30.3 Autoinjectors Market for Subcutaneous / Intramuscular Administration: Historical Trends (Since 2018) and Forecasted Estimates (Till 2035) (USD Billion)
- Figure 30.4 Autoinjectors Market for Subcutaneous / Intravenous Administration: Historical Trends (Since 2018) and Forecasted Estimates (Till 2035) (USD Billion)
- Figure 30.5 Autoinjectors Market for Intramuscular Administration: Historical Trends (Since 2018) and Forecasted Estimates (Till 2035) (USD Billion)
- Figure 30.6 Autoinjectors Market for Intravenous Administration: Historical Trends (Since 2018) and Forecasted Estimates (Till 2035) (USD Billion)
- Figure 31.1 Autoinjectors Market: Distribution by Type of Molecule Delivered
- Figure 31.2 Autoinjectors Market for Proteins: Historical Trends (Since 2018) and Forecasted Estimates (Till 2035) (USD Billion)
- Figure 31.3 Autoinjectors Market for Antibodies: Historical Trends (Since 2018) and Forecasted Estimates (Till 2035) (USD Billion)
- Figure 31.4 Autoinjectors Market for Small Molecules: Historical Trends (Since 2018) and Forecasted Estimates (Till 2035) (USD Billion)
- Figure 31.5 Autoinjectors Market for Peptides: Historical Trends (Since 2018) and Forecasted Estimates (Till 2035) (USD Billion)
- Figure 31.5 Autoinjectors Market for Other Molecules: Historical Trends (Since 2018) and Forecasted Estimates (Till 2035) (USD Billion)
- Figure 32.1 Autoinjectors Market: Distribution by Type of Actuation Mechanism
- Figure 32.2 Autoinjectors Market for Manual Actuation: Historical Trends (Since 2018) and Forecasted Estimates (Till 2035) (USD Billion)
- Figure 32.3 Autoinjectors Market for Automatic Actuation: Historical Trends (Since 2018) and Forecasted Estimates (Till 2035) (USD Billion)
- Figure 33.1 Autoinjectors Market: Distribution by Volume of Container
- Figure 33.2 Autoinjectors Market for Containers of Less than 1 mL Volume: Historical Trends (Since 2018) and Forecasted Estimates (Till 2035) (USD Billion)
- Figure 33.3 Autoinjectors Market for Containers of 1-2 mL Volume: Historical Trends (Since 2018) and Forecasted Estimates (Till 2035) (USD Billion)
- Figure 33.4 Autoinjectors Market for Containers of More than 2 mL Volume: Historical Trends (Since 2018) and Forecasted Estimates (Till 2035) (USD Billion)
- Figure 34.1 Autoinjectors Market: Distribution by End-user
- Figure 34.2 Autoinjectors Market for Home Care: Historical Trends (Since 2018) and Forecasted Estimates (Till 2035) (USD Billion)
- Figure 34.3 Autoinjectors Market for Hospitals and Clinics: Historical Trends (Since 2018) and Forecasted Estimates (Till 2035) (USD Billion)
- Figure 34.4 Autoinjectors Market for Ambulatory Surgical Centers: Historical Trends (Since 2018) and Forecasted Estimates (Till 2035) (USD Billion)
- Figure 35.1 Autoinjectors Market: Distribution by Target Indication
- Figure 35.2 Autoinjectors Market for Rheumatoid Arthritis: Historical Trends (Since 2018) and Forecasted Estimates (Till 2035) (USD Billion)
- Figure 35.3 Autoinjectors Market for Multiple Sclerosis: Historical Trends (Since 2018) and Forecasted Estimates (Till 2035) (USD Billion)
- Figure 35.4 Autoinjectors Market for Diabetes: Historical Trends (Since 2018) and Forecasted Estimates (Till 2035) (USD Billion)
- Figure 35.5 Autoinjectors Market for Anaphylaxis: Historical Trends (Since 2018) and Forecasted Estimates (Till 2035) (USD Billion)
- Figure 35.6 Autoinjectors Market for Weight Loss: Historical Trends (Since 2018) and Forecasted Estimates (Till 2035) (USD Billion)
- Figure 35.7 Autoinjectors Market for Migraine: Historical Trends (Since 2018) and Forecasted Estimates (Till 2035) (USD Billion)
- Figure 35.8 Autoinjectors Market for Other Indications: Historical Trends (Since 2018) and Forecasted Estimates (Till 2035) (USD Billion)
- Figure 36.1 Autoinjectors Market: Distribution by Key Geographical Regions
- Figure 36.2 Autoinjectors Market in North America: Historical Trends (Since 2018) and Forecasted Estimates (Till 2035) (USD Billion)
- Figure 36.3 Autoinjectors Market in Europe: Historical Trends (Since 2018) and Forecasted Estimates (Till 2035) (USD Billion)
- Figure 36.4 Autoinjectors Market in Asia-Pacific: Historical Trends (Since 2018) and Forecasted Estimates (Till 2035) (USD Billion)
- Figure 36.5 Autoinjectors Market in Middle East and North Africa: Historical Trends (Since 2018) and Forecasted Estimates (Till 2035) (USD Billion)
- Figure 36.6 Autoinjectors Market in Latin America: Historical Trends (Since 2018) and Forecasted Estimates (Till 2035) (USD Billion)
Figure 37.1 Concluding Remarks: Autoinjectors Market Overview
- Figure 37.2 Concluding Remarks: Partnerships and Collaborations
- Figure 37.3 Concluding Remarks: Patent Analysis
Figure 37.4 Concluding Remarks: Commercialized Autoinjector Combination Product Market Overview
Figure 37.5 Concluding Remarks: Early and Late Stage Autoinjector Combination Product Market Overview
- Figure 37.6 Concluding Remarks: Market
Sizing and Opportunity Analysis
 自动注射器市场:按类型、给药方法、适应症、分销管道和最终用途划分-2026-2032年全球市场预测
 全球自动注射器市场规模、份额、趋势和成长分析报告(2026-2034)
 2026年全球自动注射器市场报告
 自动注射器市场:按产品类型、疾病、通路和地区划分
 自动注射器市场规模、份额和趋势分析报告:按产品、适应症、最终用途、地区和细分市场预测,2026-2033年
 日本自动注射器市场报告(按类型(一次性自动注射器、可重复使用自动注射器)、应用(类风湿性关节炎、过敏性休克、多发性硬化症及其他)、最终用户(家庭护理机构、医院和诊所)以及地区划分,2026-2034 年)
 自动注射器市场机会、成长动力、产业趋势分析及 2025 - 2034 年预测
 自动注射器市场,按类型、按疾病适应症、按最终用户、按国家和地区 - 2025 年至 2032 年的行业分析、市场规模、市场份额和预测自动注射器市场,按产品类型、按适应症、按最终用户、按国家和地区 - 2024-2032 年行业分析、市场规模、市场份额和预测
 自动注射器市场规模、份额、成长分析、按应用、按技术、按给药途径、按治疗领域、按容量、按最终用户、按地区 - 行业预测,2024-2031