


 |
市场调查报告书
商品编码
1737051
微生物发酵CMO市场:表现系统类别,生技药品类别,不同企业规模,用户,各主要地区Microbial Fermentation CMO Market Distribution by Type of Expression System, Type of Biologic, Company Size, End Users and Key Geographical Regions |
||||||
预计2035年,全球微生物发酵CMO市场规模将从目前的36亿美元成长至91亿美元,预测期间的复合年增长率为8.7%。
市场区隔包括以下参数的市场规模与机会分析:
依表达系统类型
- 细菌表现系统
- 酵母表现系统
- 其他的表现系统
生技药品类别
- 重组蛋白品质
- 酵素
- 质体DNA
- 抗体
- 其他的生技药品
不同企业规模
- 小规模
- 中规模
- 大及超大厂
各终端用户
- 製药/生物科技企业
- 学术/研究机关
各主要地区
- 北美
- 欧洲
- 亚太地区
- 其他地区
微生物发酵CMO市场:成长与趋势
近年来,微生物发酵领域经历了復兴,微生物生物製药产业越来越注重透过先进的微生物表现系统生产生物製剂。基于微生物发酵的表达系统在生产各种生物製剂方面的改进和创新,已经解决了一些先前与微生物发酵相关的问题,例如生物製剂的三维折迭不当可能导致蛋白质失活甚至有害。因此,微生物发酵系统使得大规模生产高品质生物製剂变得更加容易。此外,由于领先的微生物发酵公司提供的创新技术和平台的进步,微生物发酵在生物製剂生产中的应用日益广泛。随着时间的推移,微生物发酵领域取得了显着发展,从而可以生产各种生物製剂,主要是蛋白质。
目前,利用细菌、真菌和酵母的传统和先进的微生物表达系统/平台已被广泛用于生产各种生物製剂,尤其是小分子,例如细胞因子、生长因子、质粒DNA、核酸、单域抗体和非糖基化抗体片段。因此,微生物发酵很可能为合约服务提供者提供丰厚的市场成长机会,预计未来几年微生物发酵合约生产製造 (CMO) 市场将快速成长。
微生物发酵合约生产製造 (CMO) 市场:关键洞察
本报告深入探讨了微生物发酵合约生产製造 (CMO) 市场的现状,并识别了行业内的潜在成长机会。报告的主要发现包括:
- 目前,全球有超过 120 家公司提供微生物发酵合约生产製造服务,其中许多公司的总部位于欧洲。
- 目前,微生物发酵合约生产製造 (CMO) 市场格局较为分散,既有新进者,也有老牌企业。
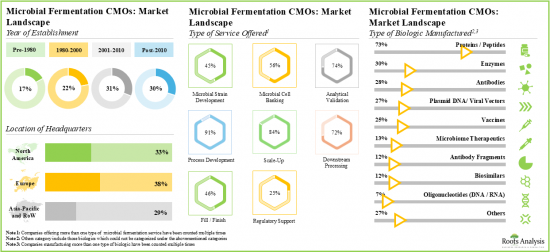
- 由于对生物製剂的需求不断增长,服务提供者和製药创新者正在提升其技术专长,以便利用微生物表达系统高效地生产高品质的产品。
- 合作活动的增加显示了人们对这一领域日益增长的兴趣。事实上,过去两年内与微生物发酵相关的合作数量达到了历史最高水准。
- 业内参与者正在大力拓展其现有的临床和商业规模微生物发酵能力。
- 预计2035年,微生物发酵CMO市场的复合年增长率将达到8.7%。目前,大部分市场占有率由上游细菌表达系统占据。
- 章概要
- 表达系统类型
- 微生物生产流程的各个阶段
- 合约生产概述
- 微生物生产外包的必要性
- 微生物合约生产产业常见的外包活动
- 生产服务外包的优缺点
- 选择合约生产 (CMO) 合作伙伴时需要考虑的重要事项
- 章概要
- 微生物发酵受託製造商:市场形势
- 章概要
- 主要加入企业的简介
- AGC Biologics
- Aldevron
- BioVectra
- EirGenix
- EtinPro
- Eurogentec
- Northway Biotech
- Stelis Biosource
- 其他的企业的简介
- 53Biologics
- AbbVie Contract Manufacturing
- Ajinomoto Bio-Pharma Services
- Aumgene Biosciences
- BioCina
- Creative Biogene
- Eubiologics
- Eurofins
- FUJIFILM Diosynth Biotechnologies
- KBI Biopharma
- Lonza
- Menarini Biotech
- Mycenax Biotech
- WACKER
- WuXi Biologics
- 章概要
- 伙伴关係模式
- 微生物发酵CMO:伙伴关係和合作
- 章概要
- 大型製药公司的微生物生物医药品製造举措一览
- 大型製药公司的竞争基准
- 章概要
- 主要的前提与调查手法
- 全球微生物发酵CMO市场,历史的趋势(2018年以后)及预测(到2035年)
- 主要的市场区隔
微生物发酵CMO市场:主要细分市场
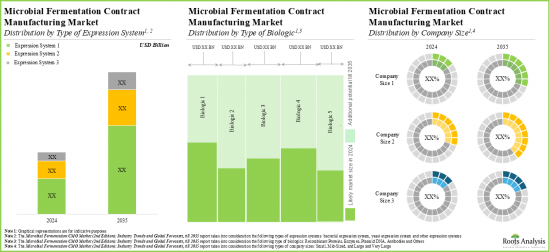
根据表现系统类型,市场可细分为细菌表现系统、酵母表现系统和其他系统。目前,细菌表现系统在全球微生物发酵CMO市场中占据最大占有率,这得益于其培养成本效益高、易于基因操作以及重组蛋白生产速度快。此外,预计酵母表达系统在预测期内将以更快的速度增长。
依生物製剂类型,市场细分为重组蛋白、酵素、质粒DNA、抗体等。目前,重组蛋白在全球微生物发酵CMO市场中占比最高。此外,预测期内,质粒DNA的微生物发酵CMO市场可能以相对较高的复合年增长率成长。这归因于对下一代疗法的需求不断增长。
依公司规模,市场细分为小型、中型、大型及超大型。目前,大型和超大型合约製造商在微生物发酵CMO市场中占有最大占有率。此外,值得注意的是,中型公司中的微生物发酵CMO市场可能以相对较高的复合年增长率成长。
按最终用户,全球市场细分为製药/生物技术公司和学术/研究机构。目前,製药/生技公司占最大市场占有率。事实上,这一趋势在未来可能保持不变。
依主要地区划分,市场分为北美、欧洲、亚太地区及世界其他地区。目前,欧洲在全球微生物发酵CMO市场占据主导地位,并占据最大的收入占有率。此外,预计未来几年亚太市场将以更高的复合年增长率成长。
本报告提供全球微生物发酵CMO市场相关调查,提供市场概要,以及表现系统类别,生技药品类别,不同企业规模,用户,各主要地区的趋势,及加入此市场的主要企业简介等资讯。
目录
第1章 序文
第2章 调查手法
第3章 经济以及其他的计划特有的考虑事项
第4章 摘要整理
第5章 简介
第6章 市场形势:微生物发酵受託製造商
第7章 企业竞争力分析
第8章 企业简介
第9章 伙伴关係和合作
第10章 最近的扩大
第11章 大型製药公司的微生物製造的措施
第12章 魅力度竞争矩阵
第13章 是製造还是购买意思决策架构
第14章 案例研究I:微生物发酵技术平台
第15章 案例研究II:小分子药和大分子药/治疗方法的比较
第16章 市场影响分析:促进因素,阻碍因素,机会,课题
第17章 全球微生物发酵CMO市场
第18章 微生物发酵CMO市场(所使用的表现系统类别)
第19章 微生物发酵CMO市场(生技药品类别)
第20章 微生物发酵CMO市场(不同企业规模)
第21章 微生物发酵CMO市场(各终端用户)
第22章 微生物发酵CMO市场(各主要地区)
第23章 结论
第24章 执行洞察
第25章 附录1:表格形式资料
第26章 附录2:企业·团体一览
MICROBIAL FERMENTATION CMO MARKET: OVERVIEW
As per Roots Analysis, the global microbial fermentation CMO market is estimated to grow from USD 3.6 billion in the current year to USD 9.1 billion by 2035, at a CAGR of 8.7% during the forecast period, till 2035.
The market sizing and opportunity analysis has been segmented across the following parameters:
Type of Expression System
- Bacterial Expression Systems
- Yeast Expression Systems
- Other Expression Systems
Type of Biologic
- Recombinant Proteins
- Enzymes
- Plasmid DNA
- Antibodies
- Other Biologics
Company Size
- Small
- Mid-Sized
- Large and Very Large
End Users
- Pharma / Biotech Companies
- Academic / Research Institutes
Key Geographical Regions
- North America
- Europe
- Asia-Pacific
- Rest of the World
MICROBIAL FERMENTATION CMO MARKET: GROWTH AND TRENDS
In recent years, the field of microbial fermentation has experienced a renaissance, with the microbial biopharmaceutical industry increasingly focusing on the production of biologics through advanced microbial expression systems. The modification and innovation in microbial fermentation-based expression systems for the production of various biologics have sidelined some of the earlier concerns associated with them like improper 3D folding of the biologics that can lead to inactive or even harmful proteins. As a result, microbial fermentation systems have facilitated the contract manufacturing of high-quality biologics in larger quantity. Further, the increasing adoption of microbial fermentation for the production of biologics has been driven by the advancements in innovative technologies and platforms offered by leading microbial fermentation companies. Over time, the microbial fermentation domain has significantly evolved and has led to the production of various biologics, primarily proteins.
Currently, a wide range of traditional and advanced microbial expression systems / platforms, utilizing bacteria, fungi, and yeast, are employed to produce diverse biologics, particularly smaller molecules such as cytokines, growth factors, plasmid DNA, nucleic acids, single-domain antibodies, and non-glycosylated antibody fragments. Consequently, microbial fermentation is likely to present lucrative market growth opportunities for contract service providers and the microbial fermentation CMO market is anticipated to grow faster in the coming years.
MICROBIAL FERMENTATION CMO MARKET: KEY INSIGHTS
The report delves into the current state of the microbial fermentation CMO market and identifies potential growth opportunities within the industry. Some key findings from the report include:
- Presently, more than 120 players are engaged in offering microbial fermentation contract manufacturing services across the globe; most of these players are headquartered in Europe.
- The current market landscape of microbial fermentation CMOs is fragmented, featuring the presence of both new entrants and established players; majority of these players offer process development services.
- Owing to the rise in demand for biologics, service providers and drug innovators are upgrading their technical expertise to efficiently manufacture high-quality products using microbial expression systems.
- The growing interest in this domain is evident from the rise in partnership activity; in fact, the maximum number of collaborations related to microbial fermentation were inked in the last two years.
- Industry players are making extensive efforts to expand their existing capacities and capabilities for both clinical and commercial scale microbial fermentation.
- The microbial fermentation CMO market is likely to grow at a CAGR of 8.7%, till 2035; presently, majority of the market share is occupied by upstream bacterial expression system.
- The microbial fermentation contract manufacturing market is anticipated to be primarily driven by the rising demand for biologics; Europe is expected to capture a larger share (over 40%) of the market by 2035
MICROBIAL FERMENTATION CMO MARKET: KEY SEGMENTS
Bacterial Expression System Segment Occupies the Largest Share of the Microbial Fermentation CMO Market
Based on the type of expression system, the market is segmented into bacterial expression systems, yeast expression systems and other expression systems. At present, the bacterial expression systems segment holds the maximum share of the global microbial fermentation CMO market owing to its cost-effectiveness in culturing, ease of genetic manipulation, and fast production of recombinant proteins. Additionally, the yeast expression systems segment is likely to grow at a faster pace during the forecasted period.
By Type of Biologic, Plasmid DNA is the Fastest Growing Segment of the Global Microbial Fermentation CMO Market
Based on the type of biologic, the market is segmented into recombinant proteins, enzymes, plasmid DNA, antibodies and other biologics. Currently, the recombinant proteins segment captures the highest proportion of the global microbial fermentation CMO market. Further, the microbial fermentation CMO market for plasmid DNA is likely to grow at a relatively higher CAGR during the forecast period. This can be attributed to the increasing demand for the next- generation therapeutics.
Large and Very Large Contract Manufacturers Occupy the Largest Share of the Microbial Fermentation CMO Market by Company Size
Based on the company size, the market is segmented into small, mid-sized, large and very large companies. At present, large and very large contract manufacturers hold the maximum share of the microbial fermentation CMO market. Further, it is worth highlighting that the microbial fermentation CMO market for the mid-sized players segment is likely to grow at a relatively higher CAGR.
Currently, the Pharma / Biotech Companies Segment Holds the Largest Share of the Microbial Fermentation CMO Market
Based on the end users, the global market is segmented into pharma / biotech companies and academic / research institutes. Currently, the pharma / biotech companies segment holds the largest market share. In fact, this trend is likely to remain the same in the coming future.
Europe Accounts for the Largest Share of the Market
Based on key geographical regions, the market is segmented into North America, Europe, Asia-Pacific and Rest of the World. Currently, Europe dominates the global microbial fermentation CMO market and accounts for the largest revenue share. Further, the market in Asia-Pacific is expected to grow at a higher CAGR in the coming years.
Example Players in the Microbial Fermentation CMO Market
- AbbVie
- BOC Sciences
- Eurofins
- FUJIFILM Diosynth Biotechnologies
- GSK
- Lonza
- Sandoz
MICROBIAL FERMENTATION CMO MARKET: RESEARCH COVERAGE
- Market Sizing and Opportunity Analysis: The report features an in-depth analysis of the global microbial fermentation CMO market, focusing on key market segments, including [A] type of expression system, [B] type of biologic, [C] company size, [D] end users and [E] key geographical regions.
- Market Landscape: A comprehensive evaluation of the companies engaged in microbial fermentation CMO market, based on several relevant parameters, such as [A] year of establishment, [B] company size, [C] location of headquarters, [D] types of services offered, [E] affiliated services, [F] AI support, [G] analytical techniques used, [H] therapeutic areas and [I] regulatory certifications / accreditations.
- Company Competitiveness Analysis: A comprehensive competitive analysis of service providers in the microbial fermentation industry, examining factors, such as [A] developer strength and [B] product portfolio strength.
- Company Profiles: In-depth profiles of key service providers engaged in the microbial fermentation market, focusing on [A] overview of the company, [B] financial information (if available), [C] service portfolio, and [D] recent developments and an informed future outlook.
- Partnerships and Collaborations: An insightful analysis of the deals inked by stakeholders in the microbial fermentation market, based on several parameters, such as [A] year of partnership, [B] type of biologic, [D] type of partner, [E] most active players (in terms of the number of partnerships signed) and [F] geographical distribution of partnership activity.
- Recent Expansions: In-depth analysis of the various expansion initiatives undertaken by contract biomanufacturers in this domain, based on several parameters, such as [A] year of expansion, [B] type of expansion, [C] microbial fermentation capacity, [D] type of biologic manufactured, [E] location of expanded facility, [F] type of expansion, [G] most active players and [H] geography.
- Big Pharma Initiatives in Microbial Manufacturing: An insightful analysis of big pharma players initiatives, based on several parameters, such as [A] number of initiatives, [B] year of initiative, and [C] types of initiatives.
- Attractiveness Competition Matrix: A detailed discussion on proprietary 2X2 representation to assess the current market scenario across emerging and established market segments.
- Make Versus Buy Decision Making Framework: An insightful analysis of the various factors that biopharmaceutical therapeutics / drug developers should consider while deciding whether to manufacture their respective products in-house or engage the services of CMOs.
- Case Study 1: A detailed discussion on the microbial fermentation technology / platforms that are available in the market. Additionally, a detailed discussion on emerging microbial fermentation technologies.
- Case Study 2: A detailed discussion on the key characteristics of large and small molecule drugs, along with information on the steps involved in their respective manufacturing processes.
- Market Impact Analysis: A thorough analysis of various factors, such as drivers, restraints, opportunities, and existing challenges that are likely to impact market growth.
KEY QUESTIONS ANSWERED IN THIS REPORT
- How many companies are currently engaged in this market?
- Which are the leading companies in this market?
- What factors are likely to influence the evolution of this market?
- What is the current and future market size?
- What is the CAGR of this market?
- How is the current and future market opportunity likely to be distributed across key market segments?
REASONS TO BUY THIS REPORT
- The report provides a comprehensive market analysis, offering detailed revenue projections of the overall market and its specific sub-segments. This information is valuable to both established market leaders and emerging entrants.
- Stakeholders can leverage the report to gain a deeper understanding of the competitive dynamics within the market. By analyzing the competitive landscape, businesses can make informed decisions to optimize their market positioning and develop effective go-to-market strategies.
- The report offers stakeholders a comprehensive overview of the market, including key drivers, barriers, opportunities, and challenges. This information empowers stakeholders to stay abreast of market trends and make data-driven decisions to capitalize on growth prospects.
ADDITIONAL BENEFITS
- Complimentary PPT Insights Packs
- Complimentary Excel Data Packs for all Analytical Modules in the Report
- 15% Free Content Customization
- Detailed Report Walkthrough Session with Research Team
- Free Updated report if the report is 6-12 months old or older
TABLE OF CONTENTS
1. PREFACE
- 1.1. Introduction
- 1.2. Market Share Insights
- 1.3. Key Market Insights
- 1.4. Report Coverage
- 1.5. Key Questions Answered
- 1.6. Chapter Outlines
2.RESEARCH METHODOLOGY
- 2.1. Chapter Overview
- 2.2. Research Assumptions
- 2.3. Project Methodology
- 2.4. Forecast Methodology
- 2.5. Robust Quality Control
- 2.6. Key Market Segmentations
- 2.7. Key Considerations
- 2.7.1. Demographics
- 2.7.2. Economic Factors
- 2.7.3. Government Regulations
- 2.7.4. Supply Chain
- 2.7.5. COVID Impact
- 2.7.6. Market Access
- 2.7.7. Healthcare Policies
- 2.7.8. Industry Consolidation
3. ECONOMIC AND OTHER PROJECT SPECIFIC CONSIDERATIONS
- 3.1. Chapter Overview
- 3.2. Market Dynamics
- 3.2.1. Time Period
- 3.2.1.1. Historical Trends
- 3.2.1.2. Current and Future Estimates
- 3.2.2. Currency Coverage and Foreign Exchange Rates
- 3.2.2.1. Major Currencies Affecting the Market
- 3.2.2.2. Factors Affecting Currency Fluctuations and Foreign Exchange Rates
- 3.2.2.3. Impact of Foreign Exchange Rate Volatility on the Market
- 3.2.2.4. Strategies for Mitigating Foreign Exchange Risk
- 3.2.3. Trade Policies
- 3.2.3.1. Impact of Trade Barriers on the Market
- 3.2.3.2. Strategies for Mitigating the Risks Associated with Trade Barriers
- 3.2.4. Recession
- 3.2.4.1. Historical Analysis of Past Recessions and Lessons Learnt
- 3.2.4.2. Assessment of Current Economic Conditions and Potential Impact on the Market
- 3.2.5. Inflation
- 3.2.5.1. Measurement and Analysis of Inflationary Pressures in the Economy
- 3.2.5.2. Potential Impact of Inflation on the Market Evolution
- 3.2.1. Time Period
4. EXECUTIVE SUMMARY
- 4.1. Chapter Overview
5. INTRODUCTION
- 5.1. Chapter Overview
- 5.2. Types of Expression Systems
- 5.2.1. Microbial Expression Systems
- 5.2.1.1. Bacterial Expression Systems
- 5.2.1.2. Fungal Expression Systems
- 5.2.1.3. Yeast Expression Systems
- 5.2.1.4. Mammalian versus Microbial Expression Systems
- 5.2.1. Microbial Expression Systems
- 5.3. Stages of the Microbial Manufacturing Process
- 5.3.1. Cell Banking
- 5.3.2. Upstream Bioprocessing
- 5.3.3. Fermentation
- 5.3.4. Downstream Bioprocessing
- 5.4. Overview of Contract Manufacturing
- 5.5. Need for Outsourcing Microbial Manufacturing
- 5.6. Commonly Outsourced Operations in Microbial Contract Manufacturing Industry
- 5.7. Advantages and Disadvantages Associated with Outsourcing Manufacturing Services
- 5.8. Key Considerations while Selecting a CMO Partner
6. MARKET LANDSCAPE: MICROBIAL FERMENTATION CONTRACT MANUFACTURERS
- 6.1. Chapter Overview
- 6.2. Microbial Fermentation Contract Manufacturers: Overall Market Landscape
- 6.2.1. Analysis by Year of Establishment
- 6.2.2. Analysis by Company Size
- 6.2.3. Analysis by Location of Headquarters
- 6.2.4. Analysis by Type of Microbial Fermentation Service Offered
- 6.2.5. Analysis by Type of Microbial Expression System Used
- 6.2.6. Analysis by GMP Compliance
- 6.2.7. Analysis by Scale of Operation
- 6.2.8. Analysis by Type of Biologic Manufactured
- 6.2.9. Analysis by Type of Fermenter
- 6.2.10. Analysis by Location of Microbial Fermentation Facilities
7. COMPANY COMPETITIVENESS ANALYSIS
- 7.1. Chapter Overview
- 7.2. Assumptions and Key Parameters
- 7.3. Methodology
- 7.4. Company Competitiveness Analysis: Microbial Fermentation Contract Manufacturers
- 7.4.1. Players based in North America (Peer Group I)
- 7.4.2. Players based in Europe (Peer Group II)
- 7.4.3. Players based in Asia-Pacific and Rest of the World (Peer Group III)
8. COMPANY PROFILES
- 8.1. Chapter Overview
- 8.2. Detailed Profiles of Leading Players
- 8.2.1. AGC Biologics
- 8.2.1.1. Company Overview
- 8.2.1.2. Microbial Fermentation Service Portfolio
- 8.2.1.3. Microbial Fermentation Facilities
- 8.2.1.4. Recent Developments and Future Outlook
- 8.2.2. Aldevron
- 8.2.2.1. Company Overview
- 8.2.2.2. Microbial Fermentation Service Portfolio
- 8.2.2.3. Microbial Fermentation Facilities
- 8.2.2.4. Recent Developments and Future Outlook
- 8.2.3. BioVectra
- 8.2.3.1. Company Overview
- 8.2.3.2. Microbial Fermentation Service Portfolio
- 8.2.3.3. Microbial Fermentation Facilities
- 8.2.3.4. Recent Developments and Future Outlook
- 8.2.4. EirGenix
- 8.2.4.1. Company Overview
- 8.2.4.2. Financial Information
- 8.2.4.3. Microbial Fermentation Service Portfolio
- 8.2.4.4. Microbial Fermentation Facilities
- 8.2.4.5. Recent Developments and Future Outlook
- 8.2.5. EtinPro
- 8.2.5.1. Company Overview
- 8.2.5.2. Microbial Fermentation Service Portfolio
- 8.2.5.3. Microbial Fermentation Facilities
- 8.2.5.4. Recent Developments and Future Outlook
- 8.2.6. Eurogentec
- 8.2.6.1. Company Overview
- 8.2.6.2. Microbial Fermentation Service Portfolio
- 8.2.6.3. Microbial Fermentation Facilities
- 8.2.6.4. Recent Developments and Future Outlook
- 8.2.7. Northway Biotech
- 8.2.7.1. Company Overview
- 8.2.7.2. Microbial Fermentation Service Portfolio
- 8.2.7.3. Microbial Fermentation Facilities
- 8.2.7.4. Recent Developments and Future Outlook
- 8.2.8. Stelis Biosource
- 8.2.8.1. Company Overview
- 8.2.8.2. Microbial Fermentation Service Portfolio
- 8.2.8.3. Microbial Fermentation Facilities
- 8.2.8.4. Recent Developments and Future Outlook
- 8.2.1. AGC Biologics
- 8.3. Short Profiles of Other Prominent Players
- 8.3.1. 53Biologics
- 8.3.1.1. Company Overview
- 8.3.1.2. Microbial Fermentation Service Portfolio
- 8.3.1.3. Microbial Fermentation Facilities
- 8.3.2. AbbVie Contract Manufacturing
- 8.3.2.1. Company Overview
- 8.3.2.2. Microbial Fermentation Service Portfolio
- 8.3.2.3. Microbial Fermentation Facilities
- 8.3.3. Ajinomoto Bio-Pharma Services
- 8.3.3.1. Company Overview
- 8.3.3.2. Microbial Fermentation Service Portfolio
- 8.3.3.3. Microbial Fermentation Facilities
- 8.3.4. Aumgene Biosciences
- 8.3.4.1. Company Overview
- 8.3.4.2. Microbial Fermentation Service Portfolio
- 8.3.4.3. Microbial Fermentation Facilities
- 8.3.5. BioCina
- 8.3.5.1. Company Overview
- 8.3.5.2. Microbial Fermentation Service Portfolio
- 8.3.5.3. Microbial Fermentation Facilities
- 8.3.6. Creative Biogene
- 8.3.6.1. Company Overview
- 8.3.6.2. Microbial Fermentation Service Portfolio
- 8.3.6.3. Microbial Fermentation Facilities
- 8.3.7. Eubiologics
- 8.3.7.1. Company Overview
- 8.3.7.2. Microbial Fermentation Service Portfolio
- 8.3.7.3. Microbial Fermentation Facilities
- 8.3.8. Eurofins
- 8.3.8.1. Company Overview
- 8.3.8.2. Microbial Fermentation Service Portfolio
- 8.3.8.3. Microbial Fermentation Facilities
- 8.3.9. FUJIFILM Diosynth Biotechnologies
- 8.3.9.1. Company Overview
- 8.3.9.2. Microbial Fermentation Service Portfolio
- 8.3.9.3. Microbial Fermentation Facilities
- 8.3.10. KBI Biopharma
- 8.3.10.1. Company Overview
- 8.3.10.2. Microbial Fermentation Service Portfolio
- 8.3.10.3. Microbial Fermentation Facilities
- 8.3.11. Lonza
- 8.3.11.1. Company Overview
- 8.3.11.2. Microbial Fermentation Service Portfolio
- 8.3.11.3. Microbial Fermentation Facilities
- 8.3.12. Menarini Biotech
- 8.3.12.1. Company Overview
- 8.3.12.2. Microbial Fermentation Service Portfolio
- 8.3.12.3. Microbial Fermentation Facilities
- 8.3.13. Mycenax Biotech
- 8.3.13.1. Company Overview
- 8.3.13.2. Microbial Fermentation Service Portfolio
- 8.3.13.3. Microbial Fermentation Facilities
- 8.3.14. WACKER
- 8.3.14.1. Company Overview
- 8.3.14.2. Microbial Fermentation Service Portfolio
- 8.3.14.3. Microbial Fermentation Facilities
- 8.3.15. WuXi Biologics
- 8.3.15.1. Company Overview
- 8.3.15.2. Microbial Fermentation Service Portfolio
- 8.3.15.3. Microbial Fermentation Facilities
- 8.3.1. 53Biologics
9. PARTNERSHIPS AND COLLABORATIONS
- 9.1. Chapter Overview
- 9.2. Partnership Models
- 9.3. Microbial Fermentation CMO: Partnerships and Collaborations
- 9.3.1. Analysis by Year of Partnerships
- 9.3.2. Analysis by Type of Partnership
- 9.3.3. Analysis by Year and Type of Partnership
- 9.3.4. Analysis by Type of Biologic Manufactured
- 9.3.5. Analysis by Type of Partner
- 9.3.6. Most Active Players: Distribution by Number of Partnerships
- 9.3.7. Analysis by Geography
- 9.3.7.1. Intracontinental and Intercontinental Agreements
- 9.3.7.2. International and Local Deals
10. RECENT EXPANSIONS
- 10.1. Chapter Overview
- 10.2. Microbial Fermentation CMO: Recent Expansions
- 10.2.1. Analysis by Year of Expansion
- 10.2.2. Analysis by Type of Expansion
- 10.2.3. Analysis by Year and Type of Expansion
- 10.2.4. Analysis by Microbial Fermentation Capacity
- 10.2.5. Analysis by Type of Biologic Manufactured
- 10.2.6. Analysis by Location of Expanded Facility
- 10.2.7. Analysis by Type of Expansion Location of Expanded Facility
- 10.2.8. Most Active Players: Distribution by Number of Recent Expansions
- 10.2.9. Analysis by Geography
- 10.2.9.1. Analysis by Continent
- 10.2.9.2. Analysis by Country
11. BIG PHARMA INITITATIVES IN MICROBIAL MANUFACTURING
- 11.1. Chapter Overview
- 11.2. List of Microbial Biopharmaceutical Manufacturing Initiatives of Big Pharma Players
- 11.2.1. Analysis by Number of Initiatives
- 11.2.2. Analysis by Year of Initiative Undertaken
- 11.2.3. Analysis by Company and Year of Initiative Undertaken
- 11.2.4. Analysis by Purpose of Initiative Undertaken
- 11.2.5. Analysis by Company and Purpose of Initiative Undertaken
- 11.2.6. Analysis by Type of Initiative
- 11.2.7. Analysis by Scale of Operation
- 11.2.8. Analysis by Type of Drug Molecule
- 11.2.9. Analysis by Type of Microbial Expression System Used
- 11.2.10. Geographical Analysis by Amount Invested
- 11.3. Competitive Benchmarking of Big Pharmaceutical Players
- 11.3.1. Concluding Remarks
12. ATTRACTIVENESS COMPETITION MATRIX
- 12.1. Chapter Overview
- 12.2. AC Matrix: An Overview
- 12.2.1. Strong Business Segment
- 12.2.2. Average Business Segment
- 12.2.3. Weak Business Segment
- 12.3. AC Matrix: Analytical Methodology
- 12.4. AC Matrix: Contract Manufacturing Scenario in North America
- 12.5. AC Matrix: Contract Manufacturing Scenario in Europe
- 12.6. AC Matrix: Contract Manufacturing Scenario in Asia Pacific and Middle East
13. MAKE VERSUS BUY DECISION MAKING FRAMEWORK
- 13.1. Chapter Overview
- 13.2. Assumptions and Parameter Definitions
- 13.2.1. Scenario 1
- 13.2.2. Scenario 2
- 13.2.3. Scenario 3
- 13.2.4. Scenario 4
- 13.3. Concluding Remarks
14. CASE STUDY I: MICROBIAL FERMENTATION TECHNOLOGY PLATFORMS
- 14.1. Chapter Overview
- 14.2. Technology Platforms Commonly Used for Microbial Fermentation
- 14.3. Upcoming Platforms-General Technologies
15. CASE STUDY II: COMPARISON OF SMALL MOLECULE AND LARGE MOLECULE DRUGS / THERAPIES
- 15.1. Chapter Overview
- 15.2. Small Molecule and Large Molecule Drugs / Therapies
- 15.2.1. Comparison of Key Characteristics
- 15.2.2. Comparison of Microbial Manufacturing Process
- 15.2.2.1. Microbial Contract Manufacturers Providing Services for Small Molecules
- 15.2.3. Comparison of Key Manufacturing-related Challenges
16. MARKET IMPACT ANALYSIS: DRIVERS, RESTRAINTS, OPPORTUNITIES AND CHALLENGES
- 16.1. Chapter Overview
- 16.2. Market Drivers
- 16.3. Market Restraints
- 16.4. Market Opportunities
- 16.5. Market Challenges
- 16.6. Conclusion
17. GLOBAL MICROBIAL FERMENTATION CMO MARKET
- 17.1. Chapter Overview
- 17.2. Key Assumptions and Methodology
- 17.3. Global Microbial Fermentation CMO Market, Historical Trends (Since 2018) and Forecasted Estimates (Till 2035)
- 17.3.1. Scenario Analysis
- 17.3.1.1. Conservative Scenario
- 17.3.1.2. Optimistic Scenario
- 17.3.1. Scenario Analysis
- 17.4. Key Market Segmentations
18. MICROBIAL FERMENTATION CMO MARKET, BY TYPE OF EXPRESSION SYSTEM USED
- 18.1. Chapter Overview
- 18.2. Key Assumptions and Methodology
- 18.3. Microbial Fermentation CMO Market: Distribution by Type of Expression System Used
- 18.3.1. Bacterial Expression Systems Market: Historical Trends (Since 2018) and Forecasted Estimates (Till 2035)
- 18.3.2. Yeast Expression Systems Market: Historical Trends (Since 2018) and Forecasted Estimates (Till 2035)
- 18.3.3. Other Expression Systems Market: Historical Trends (Since 2018) and Forecasted Estimates (Till 2035)
- 18.4. Data Triangulation and Validation
19. MICROBIAL FERMENTATION CMO MARKET, BY TYPE OF BIOLOGIC
- 19.1. Chapter Overview
- 19.2. Key Assumptions and Methodology
- 19.3. Microbial Fermentation CMO Market: Distribution by Type of Biologic
- 19.3.1. Recombinant Proteins Market: Historical Trends (Since 2018) and Forecasted Estimates (Till 2035)
- 19.3.2. Enzymes Market: Historical Trends (Since 2018) and Forecasted Estimates (Till 2035)
- 19.3.3. Plasmid DNA Market: Historical Trends (Since 2018) and Forecasted Estimates (Till 2035)
- 19.3.4. Antibodies Market: Historical Trends (Since 2018) and Forecasted Estimates (Till 2035)
- 19.3.5. Other Biologics Market: Historical Trends (Since 2018) and Forecasted Estimates (Till 2035)
- 19.4. Data Triangulation and Validation
20. MICROBIAL FERMENTATION CMO MARKET, BY COMPANY SIZE
- 20.1. Chapter Overview
- 20.2. Key Assumptions and Methodology
- 20.3. Microbial Fermentation CMO Market: Distribution by Company Size
- 20.3.1. Small Companies: Historical Trends (Since 2018) and Forecasted Estimates (Till 2035)
- 20.3.2. Mid-Sized Companies: Historical Trends (Since 2018) and Forecasted Estimates (Till 2035)
- 20.3.3. Large and Very Large Companies: Historical Trends (Since 2018) and Forecasted Estimates (Till 2035)
- 20.4. Data Triangulation and Validation
21. MICROBIAL FERMENTATION CMO MARKET, BY END-USERS
- 21.1. Chapter Overview
- 21.2. Key Assumptions and Methodology
- 21.3. Microbial Fermentation CMO Market: Distribution by End-User
- 21.3.1. Pharma / Biotech Companies Market: Historical Trends (Since 2018) and Forecasted Estimates (Till 2035)
- 21.3.2. Academic / Research Institutes Market: Historical Trends (Since 2018) and Forecasted Estimates (Till 2035)
- 21.4. Data Triangulation and Validation
22. MICROBIAL FERMENTATION CMO MARKET, BY KEY GEOGRAPHICAL REGIONS
- 22.1. Chapter Overview
- 22.2. Key Assumptions and Methodology
- 22.3. Microbial Fermentation CMO Market: Distribution by Key Geographical Regions
- 22.3.1. North America Market: Historical Trends (Since 2018) and Forecasted Estimates (Till 2035)
- 22.3.1.1. Bacterial Expression Systems Market in North America: Historical Trends (Since 2018) and Forecasted Estimates (Till 2035)
- 22.3.1.2. Yeast Expression Systems Market in North America: Historical Trends (Since 2018) and Forecasted Estimates (Till 2035)
- 22.3.1.3. Other Expression Systems Market in North America: Historical Trends (Since 2018) and Forecasted Estimates (Till 2035)
- 22.3.1.4. Recombinant Proteins Market in North America: Historical Trends (Since 2018) and Forecasted Estimates (Till 2035)
- 22.3.1.5. Enzymes Market in North America: Historical Trends (Since 2018) and Forecasted Estimates (Till 2035)
- 22.3.1.6. Plasmid DNA Market in North America: Historical Trends (Since 2018) and Forecasted Estimates (Till 2035)
- 22.3.1.7. Antibodies Market in North America: Historical Trends (Since 2018) and Forecasted Estimates (Till 2035)
- 22.3.1.8. Other Biologics Market in North America: Historical Trends (Since 2018) and Forecasted Estimates (Till 2035)
- 22.3.1.9. Small Companies Market in North America: Historical Trends (Since 2018) and Forecasted Estimates (Till 2035)
- 22.3.1.10. Mid-Sized Companies Market in North America: Historical Trends (Since 2018) and Forecasted Estimates (Till 2035)
- 22.3.1.11. Large and Very Large Companies Market in North America: Historical Trends (Since 2018) and Forecasted Estimates (Till 2035)
- 22.3.1.12. Pharma / Biotech Companies Market in North America: Historical Trends (Since 2018) and Forecasted Estimates (Till 2035)
- 22.3.1.13. Academic / Research Institutes Market in North America: Historical Trends (Since 2018) and Forecasted Estimates (Till 2035)
- 22.3.2. Europe Market: Historical Trends (Since 2018) and Forecasted Estimates (Till 2035)
- 22.3.2.1. Bacterial Expression Systems Market in Europe: Historical Trends (Since 2018) and Forecasted Estimates (Till 2035)
- 22.3.2.2. Yeast Expression Systems Market in Europe: Historical Trends (Since 2018) and Forecasted Estimates (Till 2035)
- 22.3.2.3. Other Expression Systems Market in Europe: Historical Trends (Since 2018) and Forecasted Estimates (Till 2035)
- 22.3.2.4. Recombinant Proteins Market in Europe: Historical Trends (Since 2018) and Forecasted Estimates (Till 2035)
- 22.3.2.5. Enzymes Market in Europe: Historical Trends (Since 2018) and Forecasted Estimates (Till 2035)
- 22.3.2.6. Plasmid DNA Market in Europe: Historical Trends (Since 2018) and Forecasted Estimates (Till 2035)
- 22.3.2.7. Antibodies Market in Europe: Historical Trends (Since 2018) and Forecasted Estimates (Till 2035)
- 22.3.2.8. Other Biologics Market in Europe: Historical Trends (Since 2018) and Forecasted Estimates (Till 2035)
- 22.3.2.9. Small Companies Market in Europe: Historical Trends (Since 2018) and Forecasted Estimates (Till 2035)
- 22.3.2.10. Mid-Sized Companies Market in Europe: Historical Trends (Since 2018) and Forecasted Estimates (Till 2035)
- 22.3.2.11. Large and Very Large Companies Market in Europe: Historical Trends (Since 2018) and Forecasted Estimates (Till 2035)
- 22.3.2.12. Pharma/ Biotech Companies Market in Europe: Historical Trends (Since 2018) and Forecasted Estimates (Till 2035)
- 22.3.2.13. Academic/ Research Institutes Market in Europe: Historical Trends (Since 2018) and Forecasted Estimates (Till 2035)
- 22.3.3. Asia-Pacific Market: Historical Trends (Since 2018) and Forecasted Estimates (Till 2035)
- 22.3.3.1. Bacterial Expression Systems Market in Asia-Pacific: Historical Trends (Since 2018) and Forecasted Estimates (Till 2035)
- 22.3.3.2. Yeast Expression Systems Market in Asia-Pacific: Historical Trends (Since 2018) and Forecasted Estimates (Till 2035)
- 22.3.3.3. Other Expression Systems Market in Asia-Pacific: Historical Trends (Since 2018) and Forecasted Estimates (Till 2035)
- 22.3.3.4. Recombinant Proteins Market in Asia-Pacific: Historical Trends (Since 2018) and Forecasted Estimates (Till 2035)
- 22.3.3.5. Enzymes Market in Asia-Pacific: Historical Trends (Since 2018) and Forecasted Estimates (Till 2035)
- 22.3.3.6. Plasmid DNA Market in Asia-Pacific: Historical Trends (Since 2018) and Forecasted Estimates (Till 2035)
- 22.3.3.7. Antibodies Market in Asia-Pacific: Historical Trends (Since 2018) and Forecasted Estimates (Till 2035)
- 22.3.3.8. Other Biologics Market in Asia-Pacific: Historical Trends (Since 2018) and Forecasted Estimates (Till 2035)
- 22.3.3.9. Small Companies Market in Asia-Pacific: Historical Trends (Since 2018) and Forecasted Estimates (Till 2035)
- 22.3.3.10. Mid-Sized Companies Market in Asia-Pacific: Historical Trends (Since 2018) and Forecasted Estimates (Till 2035)
- 22.3.3.11. Large and Very Large Companies Market in Asia-Pacific: Historical Trends (Since 2018) and Forecasted Estimates (Till 2035)
- 22.3.3.12. Pharma/ Biotech Companies Market in Asia-Pacific: Historical Trends (Since 2018) and Forecasted Estimates (Till 2035)
- 22.3.3.13. Academic/ Research Institutes Market in Asia-Pacific: Historical Trends (Since 2018) and Forecasted Estimates (Till 2035)
- 22.3.4. Rest of the World Market: Historical Trends (Since 2018) and Forecasted Estimates (Till 2035)
- 22.3.4.1. Bacterial Expression Systems Market in Rest of the World: Historical Trends (Since 2018) and Forecasted Estimates (Till 2035)
- 22.3.4.2. Yeast Expression Systems Market in Rest of the World: Historical Trends (Since 2018) and Forecasted Estimates (Till 2035)
- 22.3.4.3. Other Expression Systems Market in Rest of the World: Historical Trends (Since 2018) and Forecasted Estimates (Till 2035)
- 22.3.4.4. Recombinant Proteins Market in Rest of the World: Historical Trends (Since 2018) and Forecasted Estimates (Till 2035)
- 22.3.4.5. Enzymes Market in Rest of the World: Historical Trends (Since 2018) and Forecasted Estimates (Till 2035)
- 22.3.4.6. Plasmid DNA Market in Rest of the World: Historical Trends (Since 2018) and Forecasted Estimates (Till 2035)
- 22.3.4.7. Antibodies Market in Rest of the World: Historical Trends (Since 2018) and Forecasted Estimates (Till 2035)
- 22.3.4.8. Other Biologics Market in Rest of the World: Historical Trends (Since 2018) and Forecasted Estimates (Till 2035)
- 22.3.4.9. Small Companies Market in Rest of the World: Historical Trends (Since 2018) and Forecasted Estimates (Till 2035)
- 22.3.4.10. Mid-Sized Companies Market in Rest of the World: Historical Trends (Since 2018) and Forecasted Estimates (Till 2035)
- 22.3.4.11. Large and Very Large Companies Market in Rest of the World: Historical Trends (Since 2018) and Forecasted Estimates (Till 2035)
- 22.3.4.12. Pharma/ Biotech Companies Market in Rest of the World: Historical Trends (Since 2018) and Forecasted Estimates (Till 2035)
- 22.3.4.13. Academic/ Research Institutes Market in Rest of the World: Historical Trends (Since 2018) and Forecasted Estimates (Till 2035)
- 22.3.1. North America Market: Historical Trends (Since 2018) and Forecasted Estimates (Till 2035)
- 22.4. Data Triangulation and Validation
23. CONCLUDING REMARKS
- 23.1. Chapter Overview
24. EXECUTIVE INSIGHTS
- 24.1. Chapter Overview
- 24.2. Meteoric Biopharmaceuticals
- 24.2.1. Company Snapshot
- 24.2.2. Interview Transcript
- 24.3. List Biological Laboratories
- 24.3.1. Company Snapshot
- 24.3.2. Interview Transcript
- 24.4. OLON
- 24.4.1. Company Snapshot
- 24.4.2. Interview Transcript
- 24.5. Luina Bio
- 24.5.1. Company Snapshot
- 24.5.2. Interview Transcript
- 24.6. WACKER Biotech
- 24.6.1. Company Snapshot
- 24.6.2. Interview Transcript
25. APPENDIX 1: TABULATED DATA
26. APPENDIX 2: LIST OF COMPANIES AND ORGANIZATIONS
List of Tables
- Table 5.1 Mammalian versus Microbial Expression Systems
- Table 6.1 List of Microbial Fermentation Contract Manufacturers: Information on Year of Establishment, Company Size and Location of Headquarters
- Table 6.2 List of Microbial Fermentation Contract Manufacturers: Information on Microbial Fermentation Service Offered and Microbial Expression System Used
- Table 6.3 List of Microbial Fermentation Contract Manufacturers: Information on GMP Compliance, Scale of Operation, Type of Biologic Manufactured and Type of Fermenter
- Table 6.4 List of Microbial Contract Manufacturers: Information on Location of Microbial Fermentation Facilities
- Table 8.1 Microbial Fermentation Contract Manufacturers: List of Companies Profiled
- Table 8.2 AGC Biologics: Company Overview
- Table 8.3 AGC Biologics: Microbial Fermentation Service Portfolio
- Table 8.4 AGC Biologics: Microbial Fermentation Facilities
- Table 8.5 AGC Biologics: Recent Developments and Future Outlook
- Table 8.6 Aldevron: Company Overview
- Table 8.7 Aldevron: Microbial Fermentation Service Portfolio
- Table 8.8 Aldevron: Microbial Fermentation Facilities
- Table 8.9 Aldevron: Recent Developments and Future Outlook
- Table 8.10 BioVectra: Company Overview
- Table 8.11 BioVectra: Microbial Fermentation Service Portfolio
- Table 8.12 BioVectra: Microbial Fermentation Facilities
- Table 8.13 BioVectra: Recent Developments and Future Outlook
- Table 8.14 EirGenix: Company Overview
- Table 8.15 EirGenix: Microbial Fermentation Service Portfolio
- Table 8.16 EirGenix: Microbial Fermentation Facilities
- Table 8.17 Etinpro: Company Overview
- Table 8.18 Etinpro: Microbial Fermentation Service Portfolio
- Table 8.19 Etinpro: Microbial Fermentation Facilities
- Table 8.20 Eurogentec: Company Overview
- Table 8.21 Eurogentec: Microbial Fermentation Service Portfolio
- Table 8.22 Eurogentec: Microbial Fermentation Facilities
- Table 8.23 Northway Biotech: Company Overview
- Table 8.24 Northway Biotech: Microbial Fermentation Service Portfolio
- Table 8.25 Northway Biotech: Microbial Fermentation Facilities
- Table 8.26 Northway Biotech: Recent Developments and Future Outlook
- Table 8.27 Stelis Biopharma: Company Overview
- Table 8.28 Stelis Biopharma: Microbial Fermentation Service Portfolio
- Table 8.29 Stelis Biopharma: Microbial Fermentation Facilities
- Table 8.30 53Biologics: Company Overview
- Table 8.31 53Biologics: Microbial Fermentation Service Portfolio
- Table 8.32 53Biologics: Microbial Fermentation Facilities
- Table 8.33 Abbvie Contract Manufacturing: Company Overview
- Table 8.34 Abbvie Contract Manufacturing: Microbial Fermentation Service Portfolio
- Table 8.35 Abbvie Contract Manufacturing: Microbial Fermentation Facilities
- Table 8.36 Ajinomoto Bio-Pharma Services: Company Overview
- Table 8.37 Ajinomoto Bio-Pharma Services: Microbial Fermentation Service Portfolio
- Table 8.38 Ajinomoto Bio-Pharma Services: Microbial Fermentation Facilities
- Table 8.39 Aumgene Biosciences: Company Overview
- Table 8.40 Aumgene Biosciences: Microbial Fermentation Service Portfolio
- Table 8.41 Aumgene Biosciences: Microbial Fermentation Facilities
- Table 8.42 BioCina: Company Overview
- Table 8.43 BioCina: Microbial Fermentation Service Portfolio
- Table 8.44 BioCina: Microbial Fermentation Facilities
- Table 8.45 Creative Biogene: Company Overview
- Table 8.46 Creative Biogene: Microbial Fermentation Service Portfolio
- Table 8.47 Creative Biogene: Microbial Fermentation Facilities
- Table 8.48 Eubiologics: Company Overview
- Table 8.49 Eubiologics: Microbial Fermentation Service Portfolio
- Table 8.50 Eubiologics: Microbial Fermentation Facilities
- Table 8.51 Eurofins: Company Overview
- Table 8.52 Eurofins: Microbial Fermentation Service Portfolio
- Table 8.53 Eurofins: Microbial Fermentation Facilities
- Table 8.54 FUJIFILM Diosynth Biotechnologies: Company Overview
- Table 8.55 FUJIFILM Diosynth Biotechnologies: Microbial Fermentation Service Portfolio
- Table 8.56 FUJIFILM Diosynth Biotechnologies: Microbial Fermentation Facilities
- Table 8.57 KBI Biopharma: Company Overview
- Table 8.58 KBI Biopharma: Microbial Fermentation Service Portfolio
- Table 8.59 KBI Biopharma: Microbial Fermentation Facilities
- Table 8.60 Lonza: Company Overview
- Table 8.61 Lonza: Microbial Fermentation Service Portfolio
- Table 8.62 Lonza: Microbial Fermentation Facilities
- Table 8.63 Menarini Biotech: Company Overview
- Table 8.64 Menarini Biotech: Microbial Fermentation Service Portfolio
- Table 8.65 Menarini Biotech: Microbial Fermentation Facilities
- Table 8.66 Mycenax Biotech: Company Overview
- Table 8.67 Mycenax Biotech: Microbial Fermentation Service Portfolio
- Table 8.68 Mycenax Biotech: Microbial Fermentation Facilities
- Table 8.69 WACKER: Company Overview
- Table 8.70 WACKER: Microbial Fermentation Service Portfolio
- Table 8.71 WACKER: Microbial Fermentation Facilities
- Table 8.72 WuXi Biologics: Company Overview
- Table 8.73 WuXi Biologics: Microbial Fermentation Service Portfolio
- Table 8.74 WuXi Biologics: Microbial Fermentation Facilities
- Table 9.1 Microbial Fermentation CMO: List of Partnerships and Collaborations, Since 2020
- Table 10.1 Microbial Fermentation CMO: List of Recent Expansions, Since 2020
- Table 11.1 Big Pharmaceutical Players: List of Initiatives
- Table 14.1 List of Technology / Platforms for Microbial Manufacturing
- Table 15.1 List of Microbial Contract Biomanufacturers
- Table 15.2 Small Molecules and Large Molecules: Comparison of Development Characteristics
- Table 25.1 Microbial Fermentation Contract Manufacturers: Distribution by Year of Establishment
- Table 25.2 Microbial Fermentation Contract Manufacturers: Distribution by Company Size
- Table 25.3 Microbial Fermentation Contract Manufacturers: Distribution by Location of Headquarters
- Table 25.4 Microbial Fermentation Contract Manufacturers: Distribution by Type of Microbial Fermentation Service Offered
- Table 25.5 Microbial Fermentation Contract Manufacturers: Distribution by Type of Microbial Expression System Used
- Table 25.6 Microbial Fermentation Contract Manufacturers: Distribution by GMP Compliance
- Table 25.7 Microbial Fermentation Contract Manufacturers: Distribution by Scale of Operation
- Table 25.8 Microbial Fermentation Contract Manufacturers: Distribution by Type of Biologic Manufactured
- Table 25.9 Microbial Fermentation Contract Manufacturers: Distribution by Type of Fermenter
- Table 25.10 Microbial Fermentation Contract Manufacturers: Distribution by Location of Microbial Fermentation Facilities
- Table 25.11 Partnerships and Collaborations: Cumulative Year-wise Trend, Since 2020
- Table 25.12 Partnerships and Collaborations: Distribution by Type of Partnership
- Table 25.13 Partnerships and Collaborations: Distribution by Type of Biologic
- Table 25.14 Partnerships and Collaborations: Distribution by Type of Partner
- Table 25.15 Most Active Players: Distribution by Number of Partnerships
- Table 25.16 Partnerships and Collaborations: Intracontinental and Intercontinental Deals
- Table 25.17 Partnerships and Collaborations: Local and International Agreements
- Table 25.18 Recent Expansions: Cumulative Year-wise Trend, Since 2020
- Table 25.19 Recent Expansions: Distribution by Type of Expansion
- Table 25.20 Recent Expansions: Distribution by Year and Type of Expansion
- Table 25.21 Recent Expansions: Distribution by Microbial Fermentation Capacity
- Table 25.22 Recent Expansions: Distribution by Type of Biologic
- Table 25.23 Recent Expansions: Distribution by Location of Expanded Facility
- Table 25.24 Recent Expansions: Distribution by Type of Expansion and Location of Expanded Facility
- Table 25.25 Most Active Players: Distribution by Number of Recent Expansions
- Table 25.26 Recent Expansions: Distribution by Continent
- Table 25.27 Recent Expansions: Distribution by Location of Expanded Facility (Country)
- Table 25.28 Big Pharma Players: Distribution by Number of Microbial Biopharmaceutical Manufacturing Focused Initiatives
- Table 25.29 Big Pharma Players: Cumulative Distribution by Year of Initiative
- Table 25.30 Big Pharma Players: Distribution by Company and Year of Initiative
- Table 25.31 Big Pharma Players: Distribution by Purpose of Initiative
- Table 25.32 Big Pharma Players: Distribution by Company and Purpose of Initiative
- Table 25.33 Big Pharma Players: Distribution by Type of Initiative
- Table 25.34 Big Pharma Players: Distribution by Development Scale
- Table 25.35 Big Pharma Players: Distribution by Type of Drug Molecule
- Table 25.36 Big Pharma Players: Distribution by Type of Biologic Manufactured
- Table 25.37 Big Pharma Players: Distribution by Type of Microbial Expression System Used
- Table 25.37 Big Pharma Players: Distribution by Type of Microbial Expression System Used
- Table 25.38 Big Pharma Players: Distribution by Location of Initiative
- Table 25.39 Big Pharma Players: Distribution by Company and Location of Initiative
- Table 25.40 Fermentation Technology / Platform: Distribution by Type of Microbial Expression System Used
- Table 25.41 Fermentation Technology / Platform: Distribution by Purpose
- Table 25.42 Microbial Contract Manufacturing: Distribution by Type of Product
- Table 25.43 Microbial Contract Manufacturing: Distribution by Type of Microbial Expression System Used
- Table 25.44 Global Microbial Fermentation CMO Market: Historical Trends, Since 2018 (USD Billion)
- Table 25.45 Global Microbial Fermentation CMO Market: Forecasted Estimates, Till 2035, Conservative, Base and Optimistic Scenarios (USD Billion)
- Table 25.46 Microbial Fermentation CMO Market: Distribution by Type of Expression System
- Table 25.47 Bacterial Expression Systems Market: Historical Trends, Since 2018 (USD Billion)
- Table 25.48 Bacterial Expression Systems Market: Forecasted Estimates, Till 2035, Conservative, Base and Optimistic Scenarios (USD Billion)
- Table 25.49 Yeast Expression Systems Market: Historical Trends, Since 2018 (USD Billion)
- Table 25.50 Yeast Expression Systems Market: Forecasted Estimates, Till 2035, Conservative, Base and Optimistic Scenarios (USD Billion)
- Table 25.51 Other Expression Systems Market: Historical Trends, Since 2018 (USD Billion)
- Table 25.52 Other Expression Systems Market: Forecasted Estimates Till 2035, Conservative, Base and Optimistic Scenarios (USD Billion)
- Table 25.53 Microbial Fermentation CMO Market: Distribution by Type of Biologic
- Table 25.54 Recombinant Proteins Market: Historical Trends, Since 2018 (USD Billion)
- Table 25.55 Recombinant Proteins Market: Forecasted Estimates, Till 2035, Conservative, Base and Optimistic Scenarios (USD Billion)
- Table 25.56 Enzymes Market: Historical Trends, Since 2018 (USD Billion)
- Table 25.57 Enzymes Market: Forecasted Estimates, Till 2035, Conservative, Base and Optimistic Scenarios (USD Billion)
- Table 25.58 Plasmid DNA Market: Historical Trends, Since 2018 (USD Billion)
- Table 25.59 Plasmid DNA Market: Forecasted Estimates, Till 2035, Conservative, Base and Optimistic Scenarios (USD Billion)
- Table 25.60 Antibodies Market: Historical Trends, Since 2018 (USD Billion)
- Table 25.61 Antibodies Market: Forecasted Estimates, Till 2035, Conservative, Base and Optimistic Scenarios (USD Billion)
- Table 25.62 Others Market: Historical Trends, Since 2018 (USD Billion)
- Table 25.63 Others Market: Forecasted Estimates, Till 2035, Conservative, Base and Optimistic Scenarios (USD Billion)
- Table 25.64 Microbial Fermentation CMO Market: Distribution by Company Size
- Table 25.65 Small Companies Market: Historical Trends, Since 2018 (USD Billion)
- Table 25.66 Small Companies Market: Forecasted Estimates, Till 2035, Conservative, Base and Optimistic Scenarios (USD Billion)
- Table 25.67 Mid-Sized Companies Market: Historical Trends, Since 2018 (USD Billion)
- Table 25.68 Mid-Sized Companies Market: Forecasted Estimates Till 2035, Conservative, Base and Optimistic Scenarios (USD Billion)
- Table 25.69 Large and Very Large Companies Market: Historical Trends, Since 2018 (USD Billion)
- Table 25.70 Large and Very Large Companies Market: Forecasted Estimates, Till 2035, Conservative, Base and Optimistic Scenarios (USD Billion)
- Table 25.71 Microbial Fermentation CMO Market: Distribution by End-User
- Table 25.72 Pharma/ Biotech Companies Market: Historical Trends, Since 2018 (USD Billion)
- Table 25.73 Pharma/ Biotech Companies Market: Forecasted Estimates, Till 2035, Conservative, Base and Optimistic Scenarios (USD Billion)
- Table 25.74 Academic / Research Institutes Market: Historical Trends, Since 2018 (USD Billion)
- Table 25.75 Academic / Research Institutes Market: Forecasted Estimates, Till 2035, Conservative, Base and Optimistic Scenarios (USD Billion)
- Table 25.76 Microbial Fermentation CMO Market: Distribution by Key Geographical Regions
- Table 25.77 North America Market: Historical Trends, Since 2018 (USD Billion)
- Table 25.78 North America Market: Forecasted Estimates, Till 2035, Conservative, Base and Optimistic Scenarios (USD Billion)
- Table 25.79 Bacterial Expression System Market in North America: Historical Trends, Since 2018 (USD Billion)
- Table 25.80 Bacterial Expression Systems Market in North America: Forecasted Estimates, Till 2035, Conservative, Base and Optimistic Scenarios (USD Billion)
- Table 25.81 Yeast Expression Systems Market in North America: Historical Trends, Since 2018 (USD Billion)
- Table 25.82 Yeast Expression Systems Market in North America: Forecasted Estimates, Till 2035, Conservative, Base and Optimistic Scenarios (USD Billion)
- Table 25.83 Other Expression Systems Market in North America: Historical Trends, Since 2018 (USD Billion)
- Table 25.84 Other Expression Systems Market in North America: Forecasted Estimates, Till 2035, Conservative, Base and Optimistic Scenarios (USD Billion)
- Table 25.85 Recombinant Proteins Market in North America: Historical Trends, Since 2018 (USD Billion)
- Table 25.86 Recombinant Proteins Market in North America: Forecasted Estimates, Till 2035, Conservative, Base and Optimistic Scenarios (USD Billion)
- Table 25.87 Enzymes Market in North America: Historical Trends, Since 2018 (USD Billion)
- Table 25.88 Enzymes Market in North America: Forecasted Estimates, Till 2035, Conservative, Base and Optimistic Scenarios (USD Billion)
- Table 25.89 Plasmid DNA Market in North America: Historical Trends, Since 2018 (USD Billion)
- Table 25.90 Plasmid DNA Market in North America: Forecasted Estimates, Till 2035, Conservative, Base and Optimistic Scenarios (USD Billion)
- Table 25.91 Antibodies Market in North America: Historical Trends, Since 2018 (USD Billion)
- Table 25.92 Antibodies Market in North America: Forecasted Estimates, Till 2035, Conservative, Base and Optimistic Scenarios (USD Billion)
- Table 25.93 Other Biologics Market in North America: Historical Trends, Since 2018 (USD Billion)
- Table 25.94 Other Biologics Market in North America: Forecasted Estimates, Till 2035, Conservative, Base and Optimistic Scenarios (USD Billion)
- Table 25.95 Small Companies Market in North America: Historical Trends, Since 2018 (USD Billion)
- Table 25.96 Small Companies Market in North America: Forecasted Estimates, Till 2035, Conservative, Base and Optimistic Scenarios (USD Billion)
- Table 25.97 Mid-Sized Companies Market in North America: Historical Trends, Since 2018 (USD Billion)
- Table 25.98 Mid-Sized Companies Market in North America: Forecasted Estimates, Till 2035, Conservative, Base and Optimistic Scenarios (USD Billion)
- Table 25.99 Large and Very Large Companies Market in North America: Historical Trends, Since 2018 (USD Billion)
- Table 25.100 Large and Very Large Companies Market in North America: Forecasted Estimates, Till 2035, Conservative, Base and Optimistic Scenarios (USD Billion)
- Table 25.101 Pharma / Biotech Companies Market in North America: Historical Trends, Since 2018 (USD Billion)
- Table 25.102 Pharma / Biotech Companies Market in North America: Forecasted Estimates, Till 2035, Conservative, Base and Optimistic Scenarios (USD Billion)
- Table 25.103 Academic/ Research Institutes Market in North America: Historical Trends, Since 2018 (USD Billion)
- Table 25.104 Academic/ Research Institutes Market in North America: Forecasted Estimates, Till 2035, Conservative, Base and Optimistic Scenarios (USD Billion)
- Table 25.105 Europe Market: Historical Trends, Since 2018 (USD Billion)
- Table 25.106 Europe Market: Forecasted Estimates, Till 2035, Conservative, Base and Optimistic Scenarios (USD Billion)
- Table 25.107 Bacterial Expression System Market in Europe: Historical Trends, Since 2018 (USD Billion)
- Table 25.108 Bacterial Expression Systems Market in Europe: Forecasted Estimates, Till 2035, Conservative, Base and Optimistic Scenarios (USD Billion)
- Table 25.109 Yeast Expression Systems Market in Europe: Historical Trends, Since 2018 (USD Billion)
- Table 25.110 Yeast Expression Systems Market in Europe: Forecasted Estimates, Till 2035, Conservative, Base and Optimistic Scenarios (USD Billion)
- Table 25.111 Other Expression Systems Market in Europe: Historical Trends, Since 2018 (USD Billion)
- Table 25.112 Other Expression Systems Market in Europe: Forecasted Estimates, Till 2035, Conservative, Base and Optimistic Scenarios (USD Billion)
- Table 25.113 Recombinant Proteins Market in Europe: Historical Trends, Since 2018 (USD Billion)
- Table 25.114 Recombinant Proteins Market in Europe: Forecasted Estimates, Till 2035, Conservative, Base and Optimistic Scenarios (USD Billion)
- Table 25.115 Enzymes Market in Europe: Historical Trends, Since 2018 (USD Billion)
- Table 25.116 Enzymes Market in Europe: Forecasted Estimates, Till 2035, Conservative, Base and Optimistic Scenarios (USD Billion)
- Table 25.117 Plasmid DNA Market in Europe: Historical Trends, Since 2018 (USD Billion)
- Table 25.118 Plasmid DNA Market in Europe: Forecasted Estimates, Till 2035, Conservative, Base and Optimistic Scenarios (USD Billion)
- Table 25.119 Antibodies Market in Europe: Historical Trends, Since 2018 (USD Billion)
- Table 25.120 Antibodies Market in Europe: Forecasted Estimates, Till 2035, Conservative, Base and Optimistic Scenarios (USD Billion)
- Table 25.121 Other Biologics Market in Europe: Historical Trends, Since 2018 (USD Billion)
- Table 25.122 Other Biologics Market in Europe: Forecasted Estimates, Till 2035, Conservative, Base and Optimistic Scenarios (USD Billion)
- Table 25.123 Small Companies Market in Europe: Historical Trends, Since 2018 (USD Billion)
- Table 25.124 Small Companies Market in Europe: Forecasted Estimates, Till 2035, Conservative, Base and Optimistic Scenarios (USD Billion)
- Table 25.125 Mid-Sized Companies Market in Europe: Historical Trends, Since 2018 (USD Billion)
- Table 25.126 Mid-Sized Companies Market in Europe: Forecasted Estimates, Till 2035, Conservative, Base and Optimistic Scenarios (USD Billion)
- Table 25.127 Large and Very Large Companies Market in Europe: Historical Trends, Since 2018 (USD Billion)
- Table 25.128 Large and Very Large Companies Market in Europe: Forecasted Estimates, Till 2035, Conservative, Base and Optimistic Scenarios (USD Billion)
- Table 25.129 Pharma / Biotech Companies Market in Europe: Historical Trends, Since 2018 (USD Billion)
- Table 25.130 Pharma / Biotech Companies Market in Europe: Forecasted Estimates, Till 2035, Conservative, Base and Optimistic Scenarios (USD Billion)
- Table 25.131 Academic/ Research Institutes Market in Europe: Historical Trends, Since 2018 (USD Billion)
- Table 25.132 Academic/ Research Institutes Market in Europe: Forecasted Estimates, Till 2035, Conservative, Base and Optimistic Scenarios (USD Billion)
- Table 25.133 Asia-Pacific Market: Historical Trends, Since 2018 (USD Billion)
- Table 25.134 Asia-Pacific Market: Forecasted Estimates, Till 2035, Conservative, Base and Optimistic Scenarios (USD Billion)
- Table 25.135 Bacterial Expression System Market in Asia-Pacific: Historical Trends, Since 2018 (USD Billion)
- Table 25.136 Bacterial Expression Systems Market in Asia-Pacific: Forecasted Estimates, Till 2035, Conservative, Base and Optimistic Scenarios (USD Billion)
- Table 25.137 Yeast Expression Systems Market in Asia-Pacific: Historical Trends, Since 2018 (USD Billion)
- Table 25.138 Yeast Expression Systems Market in Asia-Pacific: Forecasted Estimates, Till 2035, Conservative, Base and Optimistic Scenarios (USD Billion)
- Table 25.139 Other Expression Systems Market in Asia-Pacific: Historical Trends, Since 2018 (USD Billion)
- Table 25.140 Other Expression Systems Market in Asia-Pacific: Forecasted Estimates, Till 2035, Conservative, Base and Optimistic Scenarios (USD Billion)
- Table 25.141 Recombinant Proteins Market in Asia-Pacific: Historical Trends, Since 2018 (USD Billion)
- Table 25.142 Recombinant Proteins Market in Asia-Pacific: Forecasted Estimates, Till 2035, Conservative, Base and Optimistic Scenarios (USD Billion)
- Table 25.143 Enzymes Market in Asia-Pacific: Historical Trends, Since 2018 (USD Billion)
- Table 25.144 Enzymes Market in Asia-Pacific: Forecasted Estimates, Till 2035, Conservative, Base and Optimistic Scenarios (USD Billion)
- Table 25.145 Plasmid DNA Market in Asia-Pacific: Historical Trends, Since 2018 (USD Billion)
- Table 25.146 Plasmid DNA Market in Asia-Pacific: Forecasted Estimates, Till 2035, Conservative, Base and Optimistic Scenarios (USD Billion)
- Table 25.147 Antibodies Market in Asia-Pacific: Historical Trends, Since 2018 (USD Billion)
- Table 25.148 Antibodies Market in Asia-Pacific: Forecasted Estimates, Till 2035, Conservative, Base and Optimistic Scenarios (USD Billion)
- Table 25.149 Other Biologics Market in Asia-Pacific: Historical Trends, Since 2018 (USD Billion)
- Table 25.150 Other Biologics Market in Asia-Pacific: Forecasted Estimates, Till 2035, Conservative, Base and Optimistic Scenarios (USD Billion)
- Table 25.151 Small Companies Market in Asia-Pacific: Historical Trends, Since 2018 (USD Billion)
- Table 25.152 Small Companies Market in Asia-Pacific: Forecasted Estimates, Till 2035, Conservative, Base and Optimistic Scenarios (USD Billion)
- Table 25.153 Mid-Sized Companies Market in Asia-Pacific: Historical Trends, Since 2018 (USD Billion)
- Table 25.154 Mid-Sized Companies Market in Asia-Pacific: Forecasted Estimates, Till 2035, Conservative, Base and Optimistic Scenarios (USD Billion)
- Table 25.155 Large and Very Large Companies Market in Asia-Pacific: Historical Trends, Since 2018 (USD Billion)
- Table 25.156 Large and Very Large Companies Market in Asia-Pacific: Forecasted Estimates, Till 2035, Conservative, Base and Optimistic Scenarios (USD Billion)
- Table 25.157 Pharma / Biotech Companies Market in Asia-Pacific: Historical Trends, Since 2018 (USD Billion)
- Table 25.158 Pharma / Biotech Companies Market in Asia-Pacific: Forecasted Estimates, Till 2035, Conservative, Base and Optimistic Scenarios (USD Billion)
- Table 25.159 Academic/ Research Institutes Market in Asia-Pacific: Historical Trends, Since 2018 (USD Billion)
- Table 25.160 Academic/ Research Institutes Market in Asia-Pacific: Forecasted Estimates, Till 2035, Conservative, Base and Optimistic Scenarios (USD Billion)
- Table 25.161 Rest of the World Market: Historical Trends, Since 2018 (USD Billion)
- Table 25.162 Rest of the World Market: Forecasted Estimates, Till 2035, Conservative, Base and Optimistic Scenarios (USD Billion)
- Table 25.163 Bacterial Expression System Market in Rest of the World: Historical Trends, Since 2018 (USD Billion)
- Table 25.164 Bacterial Expression Systems Market in Rest of the World: Forecasted Estimates, Till 2035, Conservative, Base and Optimistic Scenarios (USD Billion)
- Table 25.165 Yeast Expression Systems Market in Rest of the World: Historical Trends, Since 2018 (USD Billion)
- Table 25.166 Yeast Expression Systems Market in Rest of the World: Forecasted Estimates, Till 2035, Conservative, Base and Optimistic Scenarios (USD Billion)
- Table 25.167 Other Expression Systems Market in Rest of the World: Historical Trends, Since 2018 (USD Billion)
- Table 25.168 Other Expression Systems Market in Rest of the World: Forecasted Estimates, Till 2035, Conservative, Base and Optimistic Scenarios (USD Billion)
- Table 25.169 Recombinant Proteins Market in Rest of the World: Historical Trends, Since 2018 (USD Billion)
- Table 25.170 Recombinant Proteins Market in Rest of the World: Forecasted Estimates, Till 2035, Conservative, Base and Optimistic Scenarios (USD Billion)
- Table 25.171 Enzymes Market in Rest of the World: Historical Trends, Since 2018 (USD Billion)
- Table 25.172 Enzymes Market in Rest of the World: Forecasted Estimates, Till 2035, Conservative, Base and Optimistic Scenarios (USD Billion)
- Table 25.173 Plasmid DNA Market in Rest of the World: Historical Trends, Since 2018 (USD Billion)
- Table 25.174 Plasmid DNA Market in Rest of the World: Forecasted Estimates, Till 2035, Conservative, Base and Optimistic Scenarios (USD Billion)
- Table 25.175 Antibodies Market in Rest of the World: Historical Trends, Since 2018 (USD Billion)
- Table 25.176 Antibodies Market in Rest of the World: Forecasted Estimates, Till 2035, Conservative, Base and Optimistic Scenarios (USD Billion)
- Table 25.177 Other Biologics Market in Rest of the World: Historical Trends, Since 2018 (USD Billion)
- Table 25.178 Other Biologics Market in Rest of the World: Forecasted Estimates, Till 2035, Conservative, Base and Optimistic Scenarios (USD Billion)
- Table 25.179 Small Companies Market in Rest of the World: Historical Trends, Since 2018 (USD Billion)
- Table 25.180 Small Companies Market in Rest of the World: Forecasted Estimates, Till 2035, Conservative, Base and Optimistic Scenarios (USD Billion)
- Table 25.181 Mid-Sized Companies Market in Rest of the World: Historical Trends, Since 2018 (USD Billion)
- Table 25.182 Mid-Sized Companies Market in Rest of the World: Forecasted Estimates, Till 2035, Conservative, Base and Optimistic Scenarios (USD Billion)
- Table 25.183 Large and Very Large Companies Market in Rest of the World: Historical Trends, Since 2018 (USD Billion)
- Table 25.184 Large and Very Large Companies Market in Rest of the World: Forecasted Estimates, Till 2035, Conservative, Base and Optimistic Scenarios (USD Billion)
- Table 25.185 Pharma / Biotech Companies Market in Rest of the World: Historical Trends, Since 2018 (USD Billion)
- Table 25.186 Pharma / Biotech Companies Market in Rest of the World: Forecasted Estimates, Till 2035, Conservative, Base and Optimistic Scenarios (USD Billion)
- Table 25.187 Academic/ Research Institutes Market in Rest of the World: Historical Trends, Since 2018 (USD Billion)
- Table 25.188 Academic/ Research Institutes Market in Rest of the World: Forecasted Estimates, Till 2035, Conservative, Base and Optimistic Scenarios (USD Billion)
List of Figures
- Figure 5.1 Types of Expression Systems
- Figure 5.2 Stages of Microbial Manufacturing Process
- Figure 5.3 Overview of Cell Bank Systems
- Figure 5.4 Types of Third-Party Service Providers
- Figure 5.5 Commonly Outsourced Microbial Contract Biomanufacturing Operations
- Figure 5.6 Advantages and Disadvantages Associated with Outsourcing Manufacturing Services
- Figure 6.1 Microbial Fermentation Contract Manufacturers: Distribution by Year of Establishment
- Figure 6.2 Microbial Fermentation Contract Manufacturers: Distribution by Company Size
- Figure 6.3 Microbial Fermentation Contract Manufacturers: Distribution by Location of Headquarters
- Figure 6.4 Microbial Fermentation Contract Manufacturers: Distribution by Type of Microbial Fermentation Service Offered
- Figure 6.5 Microbial Fermentation Contract Manufacturers: Distribution by Type of Microbial Expression System Used
- Figure 6.6 Microbial Fermentation Contract Manufacturers: Distribution by GMP Compliance
- Figure 6.7 Microbial Fermentation Contract Manufacturers: Distribution by Scale of Operation
- Figure 6.8 Microbial Fermentation Contract Manufacturers: Distribution by Type of Biologic Manufactured
- Figure 6.9 Microbial Fermentation Contract Manufacturers: Distribution by Type of Fermenter
- Figure 6.10 Microbial Fermentation Contract Manufacturers: Distribution by Location of Microbial Fermentation Facilities
- Figure 7.1 Company Competitiveness Analysis: Players based in North America (Peer Group I)
- Figure 7.2 Company Competitiveness Analysis: Players based in Europe (Peer Group II)
- Figure 7.3 Company Competitiveness Analysis: Players based in Asia-Pacific and Rest of the World (Peer Group III)
- Figure 8.1 EirGenix: Annual Revenues, Since FY 2019 (TWD Million)
- Figure 9.1 Partnerships and Collaborations: Cumulative Year-wise Trend, Since 2020
- Figure 9.2 Partnerships and Collaborations: Distribution by Type of Partnership
- Figure 9.3 Partnerships and Collaborations: Distribution by Year and Type of Partnership
- Figure 9.4 Partnerships and Collaborations: Distribution by Type of Biologic Manufactured
- Figure 9.5 Partnerships and Collaborations: Distribution by Type of Partner
- Figure 9.6 Most Active Players: Distribution by Number of Partnerships
- Figure 9.7 Partnerships and Collaborations: Intracontinental and Intercontinental Agreements
- Figure 9.8 Partnerships and Collaborations: International and Local Deals
- Figure 10.1 Recent Expansions: Cumulative Year-wise Trend, Since 2020
- Figure 10.2 Recent Expansions: Distribution by Type of Expansion
- Figure 10.3 Recent Expansions: Distribution by Year and Type of Expansion
- Figure 10.4 Recent Expansions: Distribution by Microbial Fermentation Capacity
- Figure 10.5 Recent Expansions: Distribution by Type of Biologic Manufactured
- Figure 10.6 Recent Expansions: Distribution by Location of Expanded Facility
- Figure 10.7 Recent Expansions: Distribution by Type of Expansion and Location of Expanded Facility
- Figure 10.8 Most Active Players: Distribution by Number of Recent Expansions
- Figure 10.9 Recent Expansions: Distribution by Continent
- Figure 10.10 Recent Expansions: Distribution by Location of Expanded Facility (Country)
- Figure 11.1 Big Pharma Players: Distribution by Number of Microbial Biopharmaceutical Manufacturing Focused Initiatives
- Figure 11.2 Big Pharma Players: Cumulative Distribution by Year of Initiative
- Figure 11.3 Big Pharma Players: Distribution by Company and Year of Initiative
- Figure 11.4 Big Pharma Players: Distribution by Purpose of Initiative
- Figure 11.5 Big Pharma Players: Distribution by Company and Purpose of Initiative
- Figure 11.6 Big Pharma Players: Distribution by Type of Initiative
- Figure 11.7 Big Pharma Players: Distribution by Scale of Operation
- Figure 11.8 Big Pharma Players: Distribution by Type of Drug Molecule
- Figure 11.9 Big Pharma Players: Distribution by Type of Biologic Manufactured
- Figure 11.10 Big Pharma Players: Distribution by Type of Microbial Expression System Used
- Figure 11.11 Big Pharma Players: Distribution by Location of Initiative
- Figure 11.12 Big Pharma Players: Distribution by Company and Location of Initiative
- Figure 11.13 Harvey Ball Analysis: Big Pharma Investment Summary
- Figure 12.1 Attractiveness Competition Matrix: Pictorial Representation
- Figure 12.2 Attractiveness Competition Matrix: Positioning of Different Biologics in North America
- Figure 12.3 Attractiveness Competition Matrix: Positioning of Different Biologics in Europe
- Figure 12.4 Attractiveness Competition Matrix: Positioning of Different Biologics in Asia Pacific and Middle East
- Figure 13.1 Make versus Buy Decision Making Framework
- Figure 13.2 Make versus Buy Decision Making: Possible Scenario Descriptions
- Figure 14.1 Fermentation Technology / Platform: Distribution by Type of Microbial Expression System Used
- Figure 14.2 Fermentation Technology / Platform: Distribution by Purpose
- Figure 15.1 Small Molecules versus Large Molecules: Comparison of Key Characteristics
- Figure 15.2 Small Molecules versus Large Molecule: Comparison of Manufacturing Process
- Figure 15.3 Microbial Contract Manufacturing: Distribution by Type of Product
- Figure 15.4 Microbial Contract Manufacturing: Distribution by Type of Microbial Expression System Used
- Figure 17.1 Global Microbial Fermentation CMO Market, Historical Trends (Since 2018) and Forecasted Estimates (Till 2035) (USD Billion)
- Figure 17.2 Global Microbial Fermentation CMO Market, Forecasted Estimates (Till 2035): Conservative Scenario (USD Billion)
- Figure 17.3 Global Microbial Fermentation CMO Market, Forecasted Estimates (Till 2035): Optimistic Scenario (USD Billion)
- Figure 18.1 Microbial Fermentation CMO Market: Distribution by Type of Expression System
- Figure 18.2 Bacterial Expression Systems Market, Historical Trends (Since 2018) and Forecasted Estimates (Till 2035) (USD Billion)
- Figure 18.3 Yeast Expression Systems Market, Historical Trends (Since 2018) and Forecasted Estimates (Till 2035) (USD Billion)
- Figure 18.4 Other Expression Systems Market, Historical Trends (Since 2018) and Forecasted Estimates (Till 2035) (USD Billion)
- Figure 19.1 Microbial Fermentation CMO Market: Distribution by Type of Biologic
- Figure 19.2 Recombinant Proteins Market, Historical Trends (Since 2018) and Forecasted Estimates (Till 2035) (USD Billion)
- Figure 19.3 Enzymes Market, Historical Trends (Since 2018) and Forecasted Estimates (Till 2035) (USD Billion)
- Figure 19.4 Plasmid DNA Market, Historical Trends (Since 2018) and Forecasted Estimates (Till 2035) (USD Billion)
- Figure 19.5 Antibodies Market, Historical Trends (Since 2018) and Forecasted Estimates (Till 2035) (USD Billion)
- Figure 19.6 Other Biologics Market, Historical Trends (Since 2018) and Forecasted Estimates (Till 2035) (USD Billion)
- Figure 20.1 Microbial Fermentation CMO Market: Distribution by Company Size, 2018, 2024 and 2035
- Figure 20.2 Small Companies Market, Historical Trends (Since 2018) and Forecasted Estimates (Till 2035) (USD Billion)
- Figure 20.3 Mid-Sized Companies Market, Historical Trends (Since 2018) and Forecasted Estimates (Till 2035) (USD Billion)
- Figure 20.4 Large and Very Large Companies Market, Historical Trends (Since 2018) and Forecasted Estimates (Till 2035) (USD Billion)
- Figure 21.1 Microbial Fermentation CMO Market: Distribution by End-User
- Figure 21.2 Pharma/ Biotech Companies Market, Historical Trends (Since 2018) and Forecasted Estimates (Till 2035) (USD Billion)
- Figure 21.3 Academic/ Research Institutes Market, Historical Trends (Since 2018) and Forecasted Estimates (Till 2035) (USD Billion)
- Figure 22.1 Microbial Fermentation CMO Market: Distribution by Key Geographical Regions
- Figure 22.2 North America Market, Historical Trends (Since 2018) and Forecasted Estimates (Till 2035) (USD Billion)
- Figure 22.3 Bacterial Expression Systems Market in North America, Historical Trends (Since 2018) and Forecasted Estimates (Till 2035) (USD Billion)
- Figure 22.4 Yeast Expression Systems Market in North America, Historical Trends (Since 2018) and Forecasted Estimates (Till 2035) (USD Billion)
- Figure 22.5 Other Expression Systems Market in North America, Historical Trends (Since 2018) and Forecasted Estimates (Till 2035) (USD Billion)
- Figure 22.6 Recombinant Proteins Market in North America, Historical Trends (Since 2018) and Forecasted Estimates (Till 2035) (USD Billion)
- Figure 22.7 Enzymes Market in North America, Historical Trends (Since 2018) and Forecasted Estimates (Till 2035) (USD Billion)
- Figure 22.8 Plasmid DNA Market in North America, Historical Trends (Since 2018) and Forecasted Estimates (Till 2035) (USD Billion)
- Figure 22.9 Antibodies Market in North America, Historical Trends (Since 2018) and Forecasted Estimates (Till 2035) (USD Billion)
- Figure 22.10 Other Biologics Market in North America, Historical Trends (Since 2018) and Forecasted Estimates (Till 2035) (USD Billion)
- Figure 22.11 Small Companies Market in North America, Historical Trends (Since 2018) and Forecasted Estimates (Till 2035) (USD Billion)
- Figure 22.12 Mid-Sized Companies Market in North America, Historical Trends (Since 2018) and Forecasted Estimates (Till 2035) (USD Billion)
- Figure 22.13 Large and Very Large Companies Market in North America, Historical Trends (Since 2018) and Forecasted Estimates (Till 2035) (USD Billion)
- Figure 22.14 Pharma/ Biotech Companies Market in North America, Historical Trends (Since 2018) and Forecasted Estimates (Till 2035) (USD Billion)
- Figure 22.15 Academic / Research Institutes Market in North America, Historical Trends (Since 2018) and Forecasted Estimates (Till 2035) (USD Billion)
- Figure 22.16 Europe Market, Historical Trends (Since 2018) and Forecasted Estimates (Till 2035) (USD Billion)
- Figure 22.17 Bacterial Expression Systems Market in Europe, Historical Trends (Since 2018) and Forecasted Estimates (Till 2035) (USD Billion)
- Figure 22.18 Yeast Expression Systems Market in Europe, Historical Trends (Since 2018) and Forecasted Estimates (Till 2035) (USD Billion)
- Figure 22.19 Other Expression Systems Market in Europe, Historical Trends (Since 2018) and Forecasted Estimates (Till 2035) (USD Billion)
- Figure 22.20 Recombinant Proteins Market in Europe, Historical Trends (Since 2018) and Forecasted Estimates (Till 2035) (USD Billion)
- Figure 22.21 Enzymes Market in Europe, Historical Trends (Since 2018) and Forecasted Estimates (Till 2035) (USD Billion)
- Figure 22.22 Plasmid DNA Market in Europe, Historical Trends (Since 2018) and Forecasted Estimates (Till 2035) (USD Billion)
- Figure 22.23 Antibodies Market in Europe, Historical Trends (Since 2018) and Forecasted Estimates (Till 2035) (USD Billion)
- Figure 22.24 Other Biologics Market in Europe, Historical Trends (Since 2018) and Forecasted Estimates (Till 2035) (USD Billion)
- Figure 22.25 Small Companies Market in Europe, Historical Trends (Since 2018) and Forecasted Estimates (Till 2035) (USD Billion)
- Figure 22.26 Mid-Sized Companies Market in Europe, Historical Trends (Since 2018) and Forecasted Estimates (Till 2035) (USD Billion)
- Figure 22.27 Large and Very Large Companies Market in Europe, Historical Trends (Since 2018) and Forecasted Estimates (Till 2035) (USD Billion)
- Figure 22.28 Pharma / Biotech Companies Market in Europe, Historical Trends (Since 2018) and Forecasted Estimates (Till 2035) (USD Billion)
- Figure 22.29 Academic / Research Institutes Market in Europe, Historical Trends (Since 2018) and Forecasted Estimates (Till 2035) (USD Billion)
- Figure 22.30 Asia-Pacific Market, Historical Trends (Since 2018) and Forecasted Estimates (Till 2035) (USD Billion)
- Figure 22.31 Bacterial Expression Systems Market in Asia-Pacific, Historical Trends (Since 2018) and Forecasted Estimates (Till 2035) (USD Billion)
- Figure 22.32 Yeast Expression Systems Market in Asia-Pacific, Historical Trends (Since 2018) and Forecasted Estimates (Till 2035) (USD Billion)
- Figure 22.33 Other Expression Systems Market in Asia-Pacific, Historical Trends (Since 2018) and Forecasted Estimates (Till 2035) (USD Billion)
- Figure 22.34 Recombinant Proteins Market in Asia-Pacific, Historical Trends (Since 2018) and Forecasted Estimates (Till 2035) (USD Billion)
- Figure 22.35 Enzymes Market in Asia-Pacific, Historical Trends (Since 2018) and Forecasted Estimates (Till 2035) (USD Billion)
- Figure 22.36 Plasmid DNA Market in Asia-Pacific, Historical Trends (Since 2018) and Forecasted Estimates (Till 2035) (USD Billion)
- Figure 22.37 Antibodies Market in Asia-Pacific, Historical Trends (Since 2018) and Forecasted Estimates (Till 2035) (USD Billion)
- Figure 22.38 Other Biologics Market in Asia-Pacific, Historical Trends (Since 2018) and Forecasted Estimates (Till 2035) (USD Billion)
- Figure 22.39 Small Companies Market in Asia-Pacific, Historical Trends (Since 2018) and Forecasted Estimates (Till 2035) (USD Billion)
- Figure 22.40 Mid-Sized Companies Market in Asia-Pacific, Historical Trends (Since 2018) and Forecasted Estimates (Till 2035) (USD Billion)
- Figure 22.41 Large and Very Large Companies Market in Asia-Pacific, Historical Trends (Since 2018) and Forecasted Estimates (Till 2035) (USD Billion)
- Figure 22.42 Pharma / Biotech Companies Market in Asia-Pacific, Historical Trends (Since 2018) and Forecasted Estimates (Till 2035) (USD Billion)
- Figure 22.43 Academic / Research Institutes Market in Asia-Pacific, Historical Trends (Since 2018) and Forecasted Estimates (Till 2035) (USD Billion)
- Figure 22.44 Rest of the World Market, Historical Trends (Since 2018) and Forecasted Estimates (Till 2035) (USD Billion)
- Figure 22.45 Bacterial Expression System Market in Rest of the World, Historical Trends (Since 2018) and Forecasted Estimates (Till 2035) (USD Billion)
- Figure 22.46 Yeast Expression System Market in Rest of the World, Historical Trends (Since 2018) and Forecasted Estimates (Till 2035) (USD Billion)
- Figure 22.47 Other Expression System Market in Rest of the World, Historical Trends (Since 2018) and Forecasted Estimates (Till 2035) (USD Billion)
- Figure 22.48 Recombinant Proteins Market in Rest of the World, Historical Trends (Since 2018) and Forecasted Estimates (Till 2035) (USD Billion)
- Figure 22.49 Enzymes Market in Rest of the World, Historical Trends (Since 2018) and Forecasted Estimates (Till 2035) (USD Billion)
- Figure 22.50 Plasmid DNA Market in Rest of the World, Historical Trends (Since 2018) and Forecasted Estimates (Till 2035) (USD Billion)
- Figure 22.51 Antibodies Market in Rest of the World, Historical Trends (Since 2018) and Forecasted Estimates (Till 2035) (USD Billion)
- Figure 22.52 Other Biologics Market in Rest of the World, Historical Trends (Since 2018) and Forecasted Estimates (Till 2035) (USD Billion)
- Figure 22.53 Small Companies Market in Rest of the World, Historical Trends (Since 2018) and Forecasted Estimates (Till 2035) (USD Billion)
- Figure 22.54 Mid-Sized Companies Market in Rest of the World, Historical Trends (Since 2018) and Forecasted Estimates (Till 2035) (USD Billion)
- Figure 22.55 Large and Very Large Companies Market in Rest of the World, Historical Trends (Since 2018) and Forecasted Estimates (Till 2035) (USD Billion)
- Figure 22.56 Pharma/ Biotech Companies Market in Rest of the World, Historical Trends (Since 2018) and Forecasted Estimates (Till 2035) (USD Billion)
- Figure 22.57 Academic/ Research Institutes Market in Rest of the World, Historical Trends (Since 2018) and Forecasted Estimates (Till 2035) (USD Billion)
- Figure 23.1 Concluding Remarks: Market Landscape of Microbial Fermentation Contract Manufacturers
- Figure 23.2 Concluding Remarks: Partnerships and Collaborations
- Figure 23.3 Concluding Remarks: Recent Expansions
- Figure 23.4 Concluding Remarks: Market Sizing and Opportunity Analysis
 微生物清洁剂市场:2026-2032年全球市场预测(依原料、产品形式、应用、最终用户及销售管道划分)
 微生物发酵CMO市场分析及预测(至2035年):类型、产品、服务、技术、组件、应用、製程、最终用户、阶段微生物修復剂市场(按产品类型、配方、应用和分销管道)—2025-2030 年全球预测
 全球微生物发酵技术市场规模(按产品类型、应用、地区、范围和预测)
 全球可程式微生物学服务市场:市场规模、市场占有率、趋势、产业分析(按服务类型、微生物学类型、技术、应用和地区)、未来预测(2025-2034 年)
 农业有益微生物市场,按类型、作物类型、配方、国家和地区 - 2024-2032 年行业分析、市场规模、市场份额和预测