


 |
市场调查报告书
商品编码
1762525
医疗保健市场的数位孪生:行业趋势和全球预测 - 依治疗领域、数位孪生类型、应用领域、最终用户和关键地区Digital Twins in Healthcare Market: Industry Trends and Global Forecasts - Distribution by Therapeutic Area, Type of Digital Twin, Areas of Application, End Users and Key Geographical Regions |
||||||
医疗保健市场的数位孪生:概览
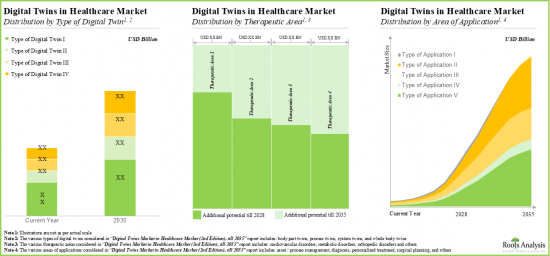
预计到2035年,全球医疗保健数位孪生市场规模将从目前的25亿美元成长至334亿美元,预测期内的年复合成长率为29.6%。
市场区隔包括以下参数的市场规模和机会分析:
治疗领域
- 心血管疾病
- 代谢性疾病
- 骨科疾病
- 其他
数位孪生类型
- 过程孪生
- 系统孪生
- 全身孪生
- 身体部位孪生
应用领域
- 资产/流程管理
- 个人化治疗
- 手术规划
- 诊断
- 其他
最终使用者
- 製药公司
- 医疗器材製造商
- 医疗保健提供者
- 患者
- 其他
主要地区
- 北美
- 欧洲
- 亚洲
- 拉丁美洲
- 中东和北非
- 其他地区
医疗保健领域的数位孪生市场:成长与趋势
数位孪生是指现实世界物件、流程和服务的数位复製品。这些虚拟系统利用人工智慧(AI)和资料分析技术,基于物联网(IoT)设备和感测器收集的即时资料进行模拟,精确重现原始系统的工作流程。值得注意的是,数位孪生可以使用各种资料来源创建,包括感测器、模型和影像。目前,数位孪生(实体物件和环境的虚拟复製品)已应用于各行各业,医疗保健领域也不例外。
数位孪生在医疗保健领域的应用有可能彻底改变患者护理,改善远距护理,创建个人化治疗方案,并降低成本。事实上,在医疗保健领域,这些技术可以完整地呈现患者的病史、症状、当前治疗方案,甚至血压和心率等生物特征资料。根据最近的行业洞察报告,66%的医疗保健高管预计未来三年将增加对数位孪生技术的投资。利用数位孪生技术,医疗保健提供者可以存取即时患者资料,并深入了解患者的生理、心理和情感需求,提供更有效、更个人化的照护。因此,许多数位孪生公司正致力于开发满足医疗保健产业需求的解决方案。
医疗保健领域的数位孪生市场:关键洞察
本报告深入探讨了医疗保健领域数位孪生市场的现状,并揭示了该行业的潜在成长机会。主要调查结果包括:
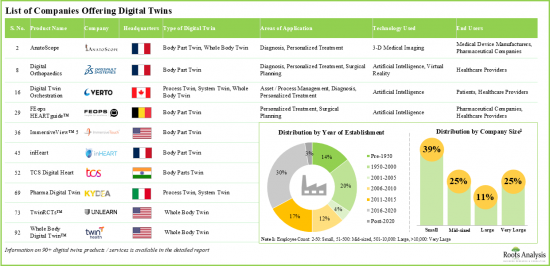
- 目前,已有超过 90 种数位孪生技术已投入商业化或开发中,用于各种医疗保健相关应用,包括诊断、健康监测和手术规划。
- 业内企业提供的数位孪生技术中,超过 42%为流程孪生,其中大多数主要用于资产/流程管理、个人化治疗和手术规划。
- 为了在医疗保健数位孪生领域获得竞争优势,各公司不断升级现有产品并扩展产品组合。
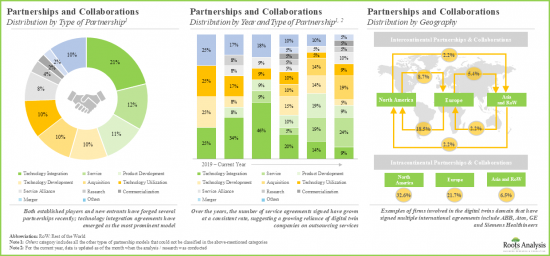
- 值得注意的是,过去三年,该行业的合作活动以超过20%的速度成长,其中超过 45%的交易是在过去两年内签署的。
- 许多私人和公共投资者投入大量资金来支持持续的创新。
- 数位孪生市场的新创公司逐步采用人工智慧和区块链等先进的创新技术,以使自己在竞争中脱颖而出。
- 受数位孪生技术在医疗保健和製药行业日益普及的推动,预计到2035年,全球医疗保健数位孪生市场将以29.6%的年复合成长率成长。
- 整体市场机会很可能在各个最终用户之间均衡分配。从地区来看,预计北美将占据大部分市场占有率。
医疗保健市场中的数位孪生:关键细分市场
根据治疗领域,市场细分为心血管疾病、代谢性疾病、骨科疾病和其他疾病。目前,心血管疾病领域在全球数位孪生医疗保健市场中占有最大占有率。预计未来这一趋势将保持不变。
根据数位孪生类型,市场细分为流程孪生、系统孪生、全身孪生和身体部位孪生。目前,流程孪生领域在全球数位孪生医疗保健市场中占有最高占有率。这主要是因为数位孪生流程有助于对医疗保健工作流程进行详细的模拟和最佳化,提高效率、节省成本并改善患者预后。此外,预计身体部位孪生领域在未来几年将呈现最高的成长率。
市场区隔以应用领域,分为资产/流程管理、个人化治疗、手术计画、诊断等。目前,资产/流程管理领域在全球医疗保健数位孪生市场中占有最大占有率。然而,由于个人化治疗领域的应用日益普及,预计未来几年其年复合成长率将更高。
根据最终用户,市场细分为製药公司、医疗器材製造商、医疗保健提供者、患者和其他最终用户。目前,製药公司在全球医疗保健数位孪生市场中占据最大占有率。此外,预计患者细分市场在预测期内将以更高的速度成长。
根据主要地区,市场细分为北美、欧洲、亚洲、拉丁美洲、中东和非洲以及拉丁美洲其他地区。目前,北美在全球数位孪生医疗保健市场中占据主导地位,占据最大的收入占有率,而亚洲市场在未来几年的年复合成长率可能更高。
医疗健康领域数位孪生市场参与者
- BigBear.ai
- Certara
- Dassault Systemes
- DEO
- Mesh Bio
- NavvTrack
- OnScale
- Phesi
- PrediSurge
- SingHealth
- Twin Health
- Unlearn
- Verto
- VictoryXR
- Virtonomy
目录
第1章 简介
医疗健康领域数位孪生:市场概况
第2章 研究方法
第3章 经济及其他专案特定注意事项
第4章 执行摘要
第5章 导论
- 章节概述
- 医疗保健领域数位孪生概述
- 医疗保健中使用的数位孪生类型
- 数位孪生在医疗保健中的应用
- 数位孪生实施中的挑战
- 结论
第6章 市场格局
- 章节概述
- 医疗保健领域的数位孪生:市场格局
- 医疗保健领域的数位孪生:开发者格局
第7章 关键见解
- 章节概述
- 依应用领域及发展现况分析
- 依所用技术类型和数位孪生类型分析
- 依最终使用者类型和数位孪生类型
- 依总部位置和应用领域分析
- 依公司规模及总部位置分析
第8章 竞争力分析
- 章节概述
- 假设和关键参数
- 研究方法
- 医疗保健领域的数位孪生:竞争力分析
第9章 公司详细简介
- 章节概述
- BigBear.ai
- Certara
- Dassault Systemes
- NavvTrack
- Unlearn.ai
第10章 公司简介列表
- 章节概述
- 总部位于北美的公司美国
- OnScale
- Phesi
- Twin Health
- Verto
- VictoryXR
- 欧洲公司
- DEO
- PrediSurge
- Virtonomy
- 亚洲公司
- Mesh Bio
- SingHealth
第11章 合作伙伴关係与合作
- 章节概述
- 医疗保健中的数位孪生:合作伙伴关係与合作
第12章 融资与投资分析
- 第概述
- 融资类型
- 医疗保健领域的数位孪生:融资和投资清单
- 结论
第13章 BERKUS 新创公司评价分析
- 章节概述
- 关键假设与研究方法
- BERKUS 新创公司新创企业评估:参与者整体评估
- 医疗保健领域的数位孪生:Berkus 新创企业评估参数基准测试
- 医疗保健领域的数位孪生:参与者基准测试
第14章 市场影响分析:驱动因素、限制因素、机会与挑战
第15章 全球医疗保健领域的数位孪生市场
第16章 医疗保健领域的数位孪生:依治疗领域
第17章 医疗保健领域的数位孪生:依数位孪生类型
第18章 医疗保健领域的数位孪生:依应用领域
第19章 医疗保健领域的数位孪生:依最终用户
第20章 医疗保健领域的数位孪生:依区域
第21章 结论
第22章 高层洞察
第23章 附录1:表格资料
第24章 附录2:公司与组织清单
DIGITAL TWINS IN HEALTHCARE MARKET: OVERVIEW
As per Roots Analysis, the global digital twins in healthcare market is estimated to grow from USD 2.5 billion in the current year to USD 33.4 billion by 2035, at a CAGR of 29.6% during the forecast period, till 2035.
The market sizing and opportunity analysis has been segmented across the following parameters:
Therapeutic Area
- Cardiovascular Disorders
- Metabolic Disorders
- Orthopedic Disorders
- Other Disorders
Type of Digital Twin
- Process Twins
- System Twins
- Whole Body Twins
- Body Part Twins
Area of Application
- Asset / Process Management
- Personalized Treatment
- Surgical Planning
- Diagnosis
- Other Applications
End Users
- Pharmaceutical Companies
- Medical Device Manufacturers
- Healthcare Providers
- Patients
- Other End Users
Key Geographical Regions
- North America
- Europe
- Asia
- Latin America
- Middle East and North Africa
- Rest of the World
DIGITAL TWINS IN HEALTHCARE MARKET: GROWTH AND TRENDS
Digital twins refer to a digital replica of a real-world object, process, or service. These virtual systems use artificial intelligence (AI) and data analytics to run simulations based on the real-time data gathered using internet of things (IoT) devices and sensors, to accurately replicate the workflow of an original system. Notably, digital twins can be created using a wide range of data sources, such as sensors, models, and images. At present, digital twins, or virtual replicas of physical objects and environments, are being used in many different industries, and healthcare is no exception.
The application of digital twins in healthcare has the potential to revolutionize patient care, improve remote care, create personalized treatments and reduce costs. In fact, in healthcare, these technologies can provide the full representation of a patient's medical history, symptoms, current treatment, and even biometric data, such as blood pressure and heart rate. According to recent industry insights, 66% of healthcare executives anticipate increased investment in digital twin technologies over the next three years. By leveraging digital twins, healthcare providers can access real-time patient data, gaining deeper insight into their physical, mental, and emotional needs to deliver more effective and tailored care. Consequently, a number of digital twin companies are focusing on developing solutions that meet the needs of the healthcare industry.
DIGITAL TWINS IN HEALTHCARE MARKET: KEY INSIGHTS
The report delves into the current state of the digital twins in healthcare market and identifies potential growth opportunities within industry. Some key findings from the report include:
- Currently, over 90 digital twins are either commercially available in the market or are under development for various healthcare related applications including diagnosis, health monitoring and surgical planning.
- Over 42% of the digital twins offered by industry players are process twins; majority of the twins are primarily intended for asset / process management, personalized treatment and surgical planning.
- In order to gain a competitive edge in digital twins in healthcare industry, companies are continuously upgrading their existing offerings to expand their portfolio.
- The partnership activity in this industry has grown at a rate of over 20% in the past three years; it is worth noting that over 45% of the deals have been signed in the last two years.
- To support the ongoing innovations, several private and public investors have made substantial capital investments; notably, most of the funding rounds took place in the past few years.
- Start-ups in the digital twin market are gradually adopting advanced and innovative technologies, such as artificial intelligence and blockchain, in order to differentiate themselves from their competitors.
- Driven by increasing adoption of digital twin technologies in healthcare and pharmaceutical industries, we anticipate the global digital twins market in healthcare domain to grow at an annualized rate of 29.6%, till 2035.
- The overall market opportunity is likely to be well distributed among various end users; in terms of geographical regions, North America is expected to capture the majority of the market share.
DIGITAL TWINS IN HEALTHCARE MARKET: KEY SEGMENTS
Cardiovascular Disorders Segment holds the Largest Share of the Digital Twins in Healthcare Market
Based on the therapeutic area, the market is segmented into cardiovascular disorders, metabolic disorders, orthopedic disorders, and other disorders. At present, the cardiovascular disorders segment holds the maximum share of the global digital twins in healthcare market. This trend is likely to remain the same in the coming years.
By Type of Digital Twin, Body Part Twins is the Fastest Growing Segment of the Global Digital Twins in Healthcare Market
Based on the type of digital twin, the market is segmented into process twins, system twins, whole body twins and body part twins. Currently, the process twins segment captures the highest proportion of the global digital twins in healthcare market. The primary reason for this is that the process of digital twins facilitates detailed simulations and optimizations of healthcare workflows, resulting in greater efficiency, cost reductions, and better patient outcomes, which fuels their broad adoption. Further, the body part twins segment is anticipated to show the highest growth rate in the coming future.
Asset / Process Management Segment Occupy the Largest Share of the Global Digital Twins in Healthcare Market by Area of Application
Based on the area of application, the market is segmented into asset / process management, personalized treatment, surgical planning, diagnosis and other applications. At present, the asset / process management segment holds the maximum share of the global digital twins in healthcare market. However, the market for personalized treatment segment is expected to grow at a higher CAGR in the coming future owing to its increasing adoption.
Pharmaceutical Companies Segment Account for the Largest Share of the Global Digital Twins in Healthcare Market
Based on the end users, the market is segmented into pharmaceutical companies, medical device manufacturers, healthcare providers, patients, and other end users. Currently, pharmaceutical companies segment holds the maximum share of the global digital twins in healthcare market. Further, the patient's segment is anticipated to grow at a higher growth rate during the forecasted period.
North America Accounts for the Largest Share of the Market
Based on key geographical regions, the market is segmented into North America, Europe, Asia, Latin America, Middle East and North Africa, and Rest of the World. Currently, North America dominates the global digital twins in healthcare market and accounts for the largest revenue share. Further, the market Asia is likely to grow at a higher CAGR in the coming future.
Example Players in the Digital Twins in Healthcare Market
- BigBear.ai
- Certara
- Dassault Systemes
- DEO
- Mesh Bio
- NavvTrack
- OnScale
- Phesi
- PrediSurge
- SingHealth
- Twin Health
- Unlearn
- Verto
- VictoryXR
- Virtonomy
DIGITAL TWINS IN HEALTHCARE MARKET: RESEARCH COVERAGE
- Market Sizing and Opportunity Analysis: The report features an in-depth analysis of the global digital twins in healthcare market, focusing on key market segments, including [A] therapeutic area, [B] type of digital twin, [C] area of application, [D] end users and [E] key geographical regions.
- Market Landscape: A comprehensive evaluation of players engaged in the development of digital twins, based on several relevant parameters, such as [A] year of establishment, [B] company size, and [C] location of headquarters. Additionally, a comprehensive evaluation of digital twins in the healthcare market, based on several relevant parameters, such as [D] status of development, [E] therapeutic area, [F] areas of application, [G] type of technology used, [H] type of digital twin and [I] end users.
- Key Insights: In-depth market analysis, highlighting the contemporary market trends, using five schematic representations, focusing on [A] areas of application and status of development, [B] type of technology used and type of digital twin, [C] type of end user and type of digital twin, [D] area of application and location of headquarters, and [E] company size and location of headquarters.
- Company Competitiveness Analysis: A comprehensive competitive analysis of players involved in the production / development of digital twins in the healthcare industry, examining factors, such as [A] years of experience, [B] portfolio strength, [C] partnership strength and [D] funding strength.
- Company Profiles: In-depth profiles of key players that are currently involved in the digital twins in healthcare market, focusing on [A] overview of the company, [B] financial information (if available) and [C] recent developments and an informed future outlook.
- Partnerships and Collaborations: An insightful analysis of the deals inked by stakeholders in this domain, based on several parameters, such as [A] year of partnership, [B] type of partnership, [C] most active players (in terms of the number of partnerships signed) and [D] geographical distribution of partnership activity.
- Funding and Investment Analysis: An in-depth analysis of the fundings received by players in digital twin domain, based on relevant parameters, such as [A] number of funding instances, [B] amount invested, [C] type of funding, [D] most active players, [E] most active investors and [F] geography.
- Berkus Start-up Valuation Analysis: A detailed analysis to evaluate start-ups engaged in digital twin domain, by assigning monetary values to various competition differentiators possessed by a player, focusing on the Berkus start-up valuation parameters, such as [A] sound idea, [B] prototype, [C] management experience and [D] strategic relationships undertaken by market players.
- Market Impact Analysis: A thorough analysis of various factors, such as drivers, restraints, opportunities, and existing challenges that are likely to impact market growth.
KEY QUESTIONS ANSWERED IN THIS REPORT
- How many companies are currently engaged in this market?
- Which are the leading companies in this market?
- What factors are likely to influence the evolution of this market?
- What is the current and future market size?
- What is the CAGR of this market?
- How is the current and future market opportunity likely to be distributed across key market segments?
REASONS TO BUY THIS REPORT
- The report provides a comprehensive market analysis, offering detailed revenue projections of the overall market and its specific sub-segments. This information is valuable to both established market leaders and emerging entrants.
- Stakeholders can leverage the report to gain a deeper understanding of the competitive dynamics within the market. By analyzing the competitive landscape, businesses can make informed decisions to optimize their market positioning and develop effective go-to-market strategies.
- The report offers stakeholders a comprehensive overview of the market, including key drivers, barriers, opportunities, and challenges. This information empowers stakeholders to stay abreast of market trends and make data-driven decisions to capitalize on growth prospects.
ADDITIONAL BENEFITS
- Complimentary PPT Insights Packs
- Complimentary Excel Data Packs for all Analytical Modules in the Report
- 15% Free Content Customization
- Detailed Report Walkthrough Session with Research Team
- Free Updated report if the report is 6-12 months old or older
TABLE OF CONTENTS
1. PREFACE
1.1. Digital Twins in Healthcare Market: Market Overview
- 1.2. Market Share Insights
- 1.3. Market Segmentation Overview
- 1.4. Key Market Insights
- 1.5. Report Coverage
- 1.6. Key Questions Answered
- 1.7. Chapter Outlines
2. RESEARCH METHODOLOGY
- 2.1. Chapter Overview
- 2.2. Research Assumptions
- 2.3. Project Methodology
- 2.4. Forecast Methodology
- 2.5. Robust Quality Control
- 2.6. Key Market Segmentations
- 2.7. Key Considerations
- 2.7.1. Demographics
- 2.7.2. Economic Factors
- 2.7.3. Government Regulations
- 2.7.4. Supply Chain
- 2.7.5. COVID Impact / Related Factors
- 2.7.6. Market Access
- 2.7.7. Healthcare Policies
- 2.7.8. Industry Consolidation
3. ECONOMIC AND OTHER PROJECT SPECIFIC CONSIDERATIONS
- 3.1. Chapter Overview
- 3.2. Market Dynamics
- 3.2.1. Time Period
- 3.2.1.1. Historical Trends
- 3.2.1.2. Current and Forecasted Estimates
- 3.2.2. Currency Coverage
- 3.2.2.1. Overview of Major Currencies Affecting the Market
- 3.2.2.2. Impact of Currency Fluctuations on the Industry
- 3.2.3. Foreign Exchange Impact
- 3.2.3.1. Evaluation of Foreign Exchange Rates and their Impact on Market
- 3.2.3.2. Strategies for Mitigating Foreign Exchange Risk
- 3.2.4. Recession
- 3.2.4.1. Historical Trends Analysis of Past Recessions and Lessons Learnt
- 3.2.4.2. Assessment of Current Economic Conditions and Potential Impact on the Market
- 3.2.5. Inflation
- 3.2.5.1. Measurement and Analysis of Inflationary Pressures in the Economy
- 3.2.5.2. Potential Impact of Inflation on the Market Evolution
- 3.2.1. Time Period
4. EXECUTIVE SUMMARY
5. INTRODUCTION
- 5.1. Chapter Overview
- 5.2. Overview of Digital Twins in Healthcare
- 5.3. Types of Digital Twins Used in Healthcare
- 5.3.1. System Twin
- 5.3.2. Process Twin
- 5.3.3. Human Digital Twin
- 5.4. Applications of Digital Twins in the Healthcare Domain
- 5.4.1. Asset / Process Management
- 5.4.2. Clinical Trial Evaluation
- 5.4.3. Personalized Medicine
- 5.4.4. Surgical Planning
- 5.5. Challenges Associated with the Adoption of Digital Twins
- 5.6. Concluding Remarks
6. MARKET LANDSCAPE
- 6.1. Chapter Overview
- 6.2. Digital Twins in Healthcare: Overall Market Landscape
- 6.2.1. Analysis by Development Status
- 6.2.2. Analysis by Therapeutic Area
- 6.2.3. Analysis by Area of Application
- 6.2.4. Analysis by Type of Technology Used
- 6.2.5. Analysis by End Users
- 6.2.6. Analysis by Type of Digital Twin
- 6.3. Digital Twins in Healthcare: Developer Landscape
- 6.3.1. Analysis by Year of Establishment
- 6.3.2. Analysis by Company Size
- 6.3.3. Analysis by Location of Headquarters
7. KEY INSIGHTS
- 7.1. Chapter Overview
- 7.2. Analysis by Area of Application and Development Status
- 7.3. Analysis by Type of Technology Used and Type of Digital Twin
- 7.4. Analysis by Type of End User and Type of Digital Twin
- 7.5. Analysis by Location of Headquarters and Area of Application
- 7.6. Analysis by Company Size and Location of Headquarters
8. COMPANY COMPETITIVENESS ANALYSIS
- 8.1. Chapter Overview
- 8.2. Assumptions and Key Parameters
- 8.3. Methodology
- 8.4. Digital Twins in Healthcare: Company Competitiveness Analysis
- 8.4.1. Company Competitiveness Analysis: Benchmarking of Portfolio Strength
- 8.4.2. Company Competitiveness Analysis: Benchmarking of Partnership Activity
- 8.4.3. Company Competitiveness Analysis: Benchmarking of Funding Activity
- 8.4.4. Company Competitiveness Analysis: Players Based in North America
- 8.4.5. Company Competitiveness Analysis: Players Based in Europe
- 8.4.6. Company Competitiveness Analysis: Players Based in Asia and Rest of the World
9. DETAILED COMPANY PROFILES
- 9.1. Chapter Overview
- 9.2. BigBear.ai
- 9.2.1. Company Overview
- 9.2.2. Financial Information
- 9.2.3. Recent Developments and Future Outlook
- 9.3. Certara
- 9.3.1. Company Overview
- 9.3.2. Financial Information
- 9.3.3. Recent Developments and Future Outlook
- 9.4. Dassault Systemes
- 9.4.1. Company Overview
- 9.4.2. Financial Information
- 9.4.3. Recent Developments and Future Outlook
- 9.5. NavvTrack
- 9.5.1. Company Overview
- 9.5.2. Recent Developments and Future Outlook
- 9.6. Unlearn.ai
- 9.6.1. Company Overview
- 9.6.2. Recent Developments and Future Outlook
10. TABULATED COMPANY PROFILES
- 10.1. Chapter Overview
- 10.2. Players Based in North America
- 10.2.1. OnScale
- 10.2.2. Phesi
- 10.2.3. Twin Health
- 10.2.4. Verto
- 10.2.5. VictoryXR
- 10.3. Players Based in Europe
- 10.3.1. DEO
- 10.3.2. PrediSurge
- 10.3.3. Virtonomy
- 10.4. Players Based in Asia
- 10.4.1. Mesh Bio
- 10.4.2. SingHealth
11. PARTNERSHIPS AND COLLABORATIONS
- 11.1. Chapter Overview
- 11.2. Digital Twins in Healthcare: Partnerships and Collaborations
- 11.2.1. Partnership Models
- 11.2.2. List of Partnerships and Collaborations
- 11.2.3. Analysis by Year of Partnership
- 11.2.4. Analysis by Type of Partnership
- 11.2.5. Analysis by Year and Type of Partnership
- 11.2.6. Analysis by Type of Partnership and Company Size
- 11.2.7. Most Active Players: Analysis by Number of Partnerships
- 11.2.8. Local and International Agreements
- 11.2.9. Intercontinental and Intracontinental Agreements
12. FUNDING AND INVESTMENTS ANALYSIS
- 12.1. Chapter Overview
- 12.2. Types of Funding
- 12.3. Digital Twins in Healthcare: List of Funding and Investments
- 12.3.1. Analysis by Number of Funding Instances
- 12.3.2. Analysis by Amount Invested
- 12.3.3. Analysis by Type of Funding
- 12.3.4. Analysis by Geography
- 12.3.5. Most Active Players: Analysis by Number of Funding Instances
- 12.3.6. Most Active Players: Analysis by Amount of Funding
- 12.3.7. Most Active Investors: Analysis by Number of Funding Instances
- 12.4. Concluding Remarks
13. BERKUS START-UP VALUATION ANALYSIS
- 13.1. Chapter Overview
- 13.2. Key Assumptions and Methodology
- 13.3. Berkus Start-Up Valuation: Total Valuation of Players
- 13.4. Digital Twins in Healthcare: Benchmarking of Berkus Start-Up Valuation Parameters
- 13.4.1. AI Body: Benchmarking of Berkus Start-Up Valuation Parameters
- 13.4.2. AnatoScope: Benchmarking of Berkus Start-Up Valuation Parameters
- 13.4.3. Antleron: Benchmarking of Berkus Start-Up Valuation Parameters
- 13.4.4. EmbodyBio: Benchmarking of Berkus Start-Up Valuation Parameters
- 13.4.5. Klinik Sankt Moritz: Benchmarking of Berkus Start-Up Valuation Parameters
- 13.4.6. KYDEA: Benchmarking of Berkus Start-Up Valuation Parameters
- 13.4.7. MAI: Benchmarking of Berkus Start-Up Valuation Parameters
- 13.4.8. Mindback AI: Benchmarking of Berkus Start-Up Valuation Parameters
- 13.4.9. Neo PLM: Benchmarking of Berkus Start-Up Valuation Parameters
- 13.4.10. Twinsight: Benchmarking of Berkus Start-Up Valuation Parameters
- 13.4.11. Yokogawa Insilico Biotechnology: Benchmarking of Berkus Start-Up Valuation Parameters
- 13.5. Digital Twins in Healthcare: Benchmarking of Players
- 13.5.1. Sound Idea: Benchmarking of Players
- 13.5.2. Prototype: Benchmarking of Players
- 13.5.3. Management Experience: Benchmarking of Players
- 13.5.4. Strategic Relationships: Benchmarking of Players
- 13.5.5. Total Valuation: Benchmarking of Players
14. MARKET IMPACT ANALYSIS: DRIVERS, RESTRAINTS, OPPORTUNITIES AND CHALLENGES
- 14.1. Chapter Overview
- 14.2. Market Drivers
- 14.3. Market Restraints
- 14.4. Market Opportunities
- 14.5. Market Challenges
- 14.6. Conclusion
15. GLOBAL DIGITAL TWIN IN HEALTHCARE MARKET
- 15.1. Chapter Overview
- 15.2. Assumptions and Methodology
- 15.3. Global Digital Twin in Healthcare Market, Historical Trends (Since 2018) and Forecasted Estimates (Till 2035)
- 15.3.1. Scenario Analysis
- 15.4. Key Market Segmentations
16. DIGITAL TWIN IN HEALTHCARE MARKET, BY THERAPEUTIC AREA
- 16.1. Chapter Overview
- 16.2. Key Assumptions and Methodology
- 16.3. Cardiovascular Disorders: Historical Trends (Since 2018) and Forecasted Estimates (Till 2035)
- 16.4. Metabolic Disorders: Historical Trends (Since 2018) and Forecasted Estimates (Till 2035)
- 16.5. Orthopedic Disorders: Historical Trends (Since 2018) and Forecasted Estimates (Till 2035)
- 16.6. Other Disorders: Historical Trends (Since 2018) and Forecasted Estimates (Till 2035)
- 16.7. Data Triangulation and Validation
17. DIGITAL TWIN IN HEALTHCARE MARKET, BY TYPE OF DIGITAL TWINS
- 17.1. Chapter Overview
- 17.2. Key Assumptions and Methodology
- 17.3. Process Twins: Historical Trends (Since 2018) and Forecasted Estimates (Till 2035)
- 17.4. System Twins: Historical Trends (Since 2018) and Forecasted Estimates (Till 2035)
- 17.5. Whole Body Twins: Historical Trends (Since 2018) and Forecasted Estimates (Till 2035)
- 17.6. Body Part Twins: Historical Trends (Since 2018) and Forecasted Estimates (Till 2035)
- 17.7. Data Triangulation and Validation
18. DIGITAL TWIN IN HEALTHCARE MARKET, BY AREA OF APPLICATION
- 18.1. Chapter Overview
- 18.2. Key Assumptions and Methodology
- 18.3. Asset / Process Management: Historical Trends (Since 2018) and Forecasted Estimates (Till 2035)
- 18.4. Personalized Treatment: Historical Trends (Since 2018) and Forecasted Estimates (Till 2035)
- 18.5. Surgical Planning: Historical Trends (Since 2018) and Forecasted Estimates (Till 2035)
- 18.6. Diagnosis: Historical Trends (Since 2018) and Forecasted Estimates (Till 2035)
- 18.7. Other Applications: Historical Trends (Since 2018) and Forecasted Estimates (Till 2035)
- 18.8. Data Triangulation and Validation
19. DIGITAL TWIN IN HEALTHCARE MARKET, BY END USERS
- 19.1. Chapter Overview
- 19.2. Key Assumptions and Methodology
- 19.3. Pharmaceutical Companies: Historical Trends (Since 2018) and Forecasted Estimates (Till 2035)
- 19.4. Medical Device Manufacturers: Historical Trends (Since 2018) and Forecasted Estimates (Till 2035)
- 19.5. Healthcare Providers: Historical Trends (Since 2018) and Forecasted Estimates (Till 2035)
- 19.6. Patients: Historical Trends (Since 2018) and Forecasted Estimates (Till 2035)
- 19.7. Other End Users: Historical Trends (Since 2018) and Forecasted Estimates (Till 2035)
- 19.8. Data Triangulation and Validation
20. DIGITAL TWIN IN HEALTHCARE MARKET, BY GEOGRAPHY
- 20.1. Chapter Overview
- 20.2. Key Assumptions and Methodology
- 20.3. North America: Historical Trends (Since 2018) and Forecasted Estimates (Till 2035)
- 20.3.1. US: Historical Trends (Since 2018) and Forecasted Estimates (Till 2035)
- 20.3.2. Canada: Historical Trends (Since 2018) and Forecasted Estimates (Till 2035)
- 20.4. Europe: Historical Trends (Since 2018) and Forecasted Estimates (Till 2035)
- 20.4.1. France: Historical Trends (Since 2018) and Forecasted Estimates (Till 2035)
- 20.4.2. Germany: Historical Trends (Since 2018) and Forecasted Estimates (Till 2035)
- 20.4.3. Italy: Historical Trends (Since 2018) and Forecasted Estimates (Till 2035)
- 20.4.4. Spain: Historical Trends (Since 2018) and Forecasted Estimates (Till 2035)
- 20.4.5. UK: Historical Trends (Since 2018) and Forecasted Estimates (Till 2035)
- 20.4.6. Rest of Europe: Historical Trends (Since 2018) and Forecasted Estimates (Till 2035)
- 20.5. Asia: Historical Trends (Since 2018) and Forecasted Estimates (Till 2035)
- 20.5.1. China: Historical Trends (Since 2018) and Forecasted Estimates (Till 2035)
- 20.5.2. India: Historical Trends (Since 2018) and Forecasted Estimates (Till 2035)
- 20.5.3. Japan: Historical Trends (Since 2018) and Forecasted Estimates (Till 2035)
- 20.5.4. Singapore: Historical Trends (Since 2018) and Forecasted Estimates (Till 2035)
- 20.5.5. South Korea: Historical Trends (Since 2018) and Forecasted Estimates (Till 2035)
- 20.5.6. Rest of Asia: Historical Trends (Since 2018) and Forecasted Estimates (Till 2035)
- 20.6. Latin America: Historical Trends (Since 2018) and Forecasted Estimates (Till 2035)
- 20.6.1. Brazil: Historical Trends (Since 2018) and Forecasted Estimates (Till 2035)
- 20.7. Middle East and North Africa: Historical Trends (Since 2018) and Forecasted Estimates (Till 2035)
- 20.7.1. UAE: Historical Trends (Since 2018) and Forecasted Estimates (Till 2035)
- 20.8. Rest of the World: Historical Trends (Since 2018) and Forecasted Estimates (Till 2035)
- 20.8.1. Australia: Historical Trends (Since 2018) and Forecasted Estimates (Till 2035)
- 20.8.2. New Zealand: Historical Trends (Since 2018) and Forecasted Estimates (Till 2035)
- 20.9. Data Triangulation and Validation
21. CONCLUSION
22. EXECUTIVE INSIGHTS
- 22.1. Chapter Overview
- 22.2. Company A
- 22.2.1. Company Snapshot
- 22.2.2. Interview Transcript, Business Consultant
- 22.3. Company B
- 22.3.1. Company Snapshot
- 22.3.2. Interview Transcript, Co-Founder and Chief Scientific Officer
- 22.4. Company C
- 22.4.1. Company Snapshot
- 22.4.2. Interview Transcript, Business Development Executive
- 22.5. Company D
- 22.5.1. Company Snapshot
- 22.5.2. Interview Transcript, Managing Director and Chief Executive Officer
23. APPENDIX I: TABULATED DATA
24. APPENDIX II: LIST OF COMPANIES AND ORGANIZATIONS
List of Tables
- Table 6.1 Digital Twins in Healthcare: Information on Development Status
- Table 6.2 Digital Twins in Healthcare: Information on Therapeutic Area
- Table 6.3 Digital Twins in Healthcare: Information on Areas of Application
- Table 6.4 Digital Twins in Healthcare: Information on Type of Technology Used
- Table 6.5 Digital Twins in Healthcare: Information on End Users
- Table 6.6 Digital Twins in Healthcare: Information on Type of Digital Twin
- Table 6.7 Digital Twins Developers: Information on Year of Establishment, Company Size, Location of Headquarters, Region of Headquarters and Number of Products
- Table 9.1 List of Companies Profiled
- Table 9.2 BigBear.ai: Company Overview
- Table 9.3 BigBear.ai: Recent Developments and Future Outlook
- Table 9.4 Certara: Company Overview
- Table 9.5 Certara: Recent Developments and Future Outlook
- Table 9.6 Dassault Systemes: Company Overview
- Table 9.7 Dassault Systemes: Recent Developments and Future Outlook
- Table 9.8 NavvTrack: Company Overview
- Table 9.9 NavvTrack: Recent Developments and Future Outlook
- Table 9.10 Unlearn.ai: Company Overview
- Table 9.11 Unlearn.ai: Recent Developments and Future Outlook
- Table 10.1 List of Companies Profiled
- Table 10.2 OnScale: Company Overview
- Table 10.3 Phesi: Company Overview
- Table 10.4 Twin Health: Company Overview
- Table 10.5 Verto: Company Overview
- Table 10.6 VictoryXR: Recent Developments and Future Outlook
- Table 10.7 DEO: Company Overview
- Table 10.8 PrediSurge: Company Overview
- Table 10.9 Virtonomy: Company Overview
- Table 10.10 Mesh Bio: Company Overview
- Table 10.11 SingHealth: Company Overview
- Table 11.1 Digital Twins in Healthcare: List of Partnerships and Collaborations, Since 2018
- Table 11.2 Partnerships and Collaborations: Information on Type of Agreement (Country-wise and Continent-wise), Since 2018
- Table 12.1 Funding and Investments: Information on Year of Investment, Type of Funding, Amount and Investor, Since 2018
- Table 12.2 Funding and Investment Analysis: Regional Distribution by Total Amount Invested, Since 2018
- Table 13.1 Berkus Start-Up Valuation: Total Valuation of Players
- Table 22.1 Dassault Systemes: Company Snapshot
- Table 22.2 TwInsight: Company Snapshot
- Table 22.3 Unlearn.AI: Company Snapshot
- Table 22.4 Yokogawa Insilico Biotechnology: Company Snapshot
- Table 23.1 Digital Twins: Distribution by Development Status
- Table 23.2 Digital Twins: Distribution by Therapeutic Area
- Table 23.3 Digital Twins: Distribution by Areas of Application
- Table 23.4 Digital Twins: Distribution by Type of Technology Used
- Table 23.5 Digital Twins: Distribution by End Users
- Table 23.6 Digital Twins in Healthcare: Distribution by Type of Digital Twin
- Table 23.7 Digital Twin Developers: Distribution by Year of Establishment
- Table 23.8 Digital Twin Developers: Distribution by Company Size
- Table 23.9 Digital Twin Developers: Distribution by Location of Headquarters
- Table 23.10 BigBear.ai: Annual Revenues, Since 2021 (USD Million)
- Table 23.11 Certara: Annual Revenues, Since 2020 (USD Million)
- Table 23.12 Dassault Systemes: Annual Revenues, Since 2019 (EUR Billion)
- Table 23.13 Partnerships and Collaborations: Cumulative Year-wise Trend, Since 2018
- Table 23.14 Partnerships and Collaborations: Distribution by Type of Partnership
- Table 23.15 Partnerships and Collaborations: Distribution by Year and Type of Partnership
- Table 23.16 Partnerships and Collaborations: Distribution by Type of Partnership and Company Size
- Table 23.17 Most Active Players: Distribution by Number of Partnerships
- Table 23.18 Partnerships and Collaborations: Local and International Agreements
- Table 23.19 Partnerships and Collaborations: Intercontinental and Intracontinental Agreements
- Table 23.20 Funding and Investment Analysis: Cumulative Year-wise Trend, Since 2018
- Table 23.21 Funding and Investment Analysis: Cumulative Amount Invested (USD Million), Since 2018
- Table 23.22 Funding and Investment Analysis: Distribution of Instances by Type of Funding, Since 2018
- Table 23.23 Funding and Investment Analysis: Year-Wise Distribution by Type of Funding, Since 2018
- Table 23.24 Funding and Investment Analysis: Distribution of Total Amount Invested (USD Million) by Type of Funding, Since 2018
- Table 23.25 Funding and Investment Analysis: Distribution by Geography
- Table 23.26 Most Active Players: Distribution by Number of Funding Instances, Since 2018
- Table 23.27 Most Active Players: Distribution by Amount Raised (USD Million), Since 2018
- Table 23.28 Global Digital Twins in Healthcare Market, Historical Trends, Since 2018 (USD Billion)
- Table 23.29 Global Digital Twins in Healthcare Market, Forecasted Estimates, Till 2035, Conservative, Base and Optimistic Scenario (USD Billion)
- Table 23.30 Global Digital Twins in Healthcare Market: Distribution by Therapeutic Area
- Table 23.31 Digital Twins in Healthcare Market for Cardiovascular Disorders, Historical Trends, Since 2018 (USD Billion)
- Table 23.32 Digital Twins in Healthcare Market for Cardiovascular Disorders, Conservative, Base and Optimistic Scenarios, Till 2035 (USD Billion)
- Table 23.33 Digital Twins in Healthcare Market for Metabolic Disorders, Historical Trends, Since 2018 (USD Billion)
- Table 23.34 Digital Twins in Healthcare Market for Metabolic Disorders, Conservative, Base and Optimistic Scenarios, Till 2035 (USD Billion)
- Table 23.35 Digital Twins in Healthcare Market for Orthopedic Disorders, Historical Trends, Since 2018 (USD Billion)
- Table 23.36 Digital Twins in Healthcare Market for Orthopedic Disorders, Conservative, Base and Optimistic Scenarios, Till 2035 (USD Billion)
- Table 23.37 Digital Twins in Healthcare Market for Other Disorders, Historical Trends, Since 2018 (USD Billion)
- Table 23.38 Digital Twins in Healthcare Market for Other Disorders, Conservative, Base and Optimistic Scenarios, Till 2035 (USD Billion)
- Table 23.39 Global Digital Twins in Healthcare Market: Distribution by Type of Digital Twin
- Table 23.40 Digital Twins in Healthcare Market for Process Twins, Historical Trends, Since 2018 (USD Billion)
- Table 23.41 Digital Twins in Healthcare Market for Process Twins, Conservative, Base and Optimistic Scenarios, Till 2035 (USD Billion)
- Table 23.42 Digital Twins in Healthcare Market for System Twins, Historical Trends, Since 2018 (USD Billion)
- Table 23.43 Digital Twins in Healthcare Market for System Twins, Conservative, Base and Optimistic Scenarios, Till 2035 (USD Billion)
- Table 23.44 Digital Twins in Healthcare Market for Whole Body Twins, Historical Trends, Since 2018 (USD Billion)
- Table 23.45 Digital Twins in Healthcare Market for Whole Body Twins, Conservative, Base and Optimistic Scenarios, Till 2035 (USD Billion)
- Table 23.46 Digital Twins in Healthcare Market for Body Part Twins, Historical Trends, Since 2018 (USD Billion)
- Table 23.47 Digital Twins in Healthcare Market for Body Part Twins, Conservative, Base and Optimistic Scenarios, Till 2035 (USD Billion)
- Table 23.48 Global Digital Twins in Healthcare Market: Distribution by Area of Application
- Table 23.49 Digital Twins in Healthcare Market for Asset / Process Management, Historical Trends, Since 2018 (USD Billion)
- Table 23.50 Digital Twins in Healthcare Market for Asset / Process Management, Conservative, Base and Optimistic Scenarios, Till 2035 (USD Billion)
- Table 23.51 Digital Twins in Healthcare Market for Personalized Treatment, Historical Trends, Since 2018 (USD Billion)
- Table 23.52 Digital Twins in Healthcare Market for Personalized Treatment, Conservative, Base and Optimistic Scenarios, Till 2035 (USD Billion)
- Table 23.53 Digital Twins in Healthcare Market for Surgical Planning, Historical Trends, Since 2018 (USD Billion)
- Table 23.54 Digital Twins in Healthcare Market for Surgical Planning, Conservative, Base and Optimistic Scenarios, Till 2035 (USD Billion)
- Table 23.55 Digital Twins in Healthcare Market for Diagnosis, Historical Trends, Since 2018 (USD Billion)
- Table 23.56 Digital Twins in Healthcare Market for Diagnosis, Conservative, Base and Optimistic Scenarios, Till 2035 (USD Billion)
- Table 23.57 Digital Twins in Healthcare Market for Other Application Areas, Historical Trends, Since 2018 (USD Billion)
- Table 23.58 Digital Twins in Healthcare Market for Other Application Areas, Conservative, Base and Optimistic Scenarios, Till 2035 (USD Billion)
- Table 23.59 Global Digital Twins in Healthcare Market: Distribution by End Users
- Table 23.60 Digital Twins in Healthcare Market for Pharmaceutical Companies, Historical Trends, Since 2018 (USD Billion)
- Table 23.61 Digital Twins in Healthcare Market for Pharmaceutical Companies, Conservative, Base and Optimistic Scenarios, Till 2035 (USD Billion)
- Table 23.62 Digital Twins in Healthcare Market for Medical Device Manufacturers, Historical Trends, Since 2018 (USD Billion)
- Table 23.63 Digital Twins in Healthcare Market for Medical Device Manufacturers, Conservative, Base and Optimistic Scenarios, Till 2035 (USD Billion)
- Table 23.64 Digital Twins in Healthcare Market for Healthcare Providers, Historical Trends, Since 2018 (USD Billion)
- Table 23.65 Digital Twins in Healthcare Market for Healthcare Providers, Conservative, Base and Optimistic Scenarios, Till 2035 (USD Billion)
- Table 23.66 Digital Twins in Healthcare Market for Patients, Historical Trends, Since 2018 (USD Billion)
- Table 23.67 Digital Twins in Healthcare Market for Patients, Conservative, Base and Optimistic Scenarios, Till 2035 (USD Billion)
- Table 23.68 Digital Twins in Healthcare Market for Other End Users, Historical Trends, Since 2018 (USD Billion)
- Table 23.69 Digital Twins in Healthcare Market for Other End Users, Conservative, Base and Optimistic Scenarios, Till 2035 (USD Billion)
- Table 23.70 Global Digital Twins in Healthcare Market: Distribution by Key Geographies
- Table 23.71 Digital Twins in Healthcare Market in North America, Historical Trends, Since 2018 (USD Billion)
- Table 23.72 Digital Twins in Healthcare Market in North America, Conservative, Base and Optimistic Scenarios, Till 2035 (USD Billion)
- Table 23.73 Digital Twins in Healthcare Market in the US, Historical Trends, Since 2018 (USD Billion)
- Table 23.74 Digital Twins in Healthcare Market in the US, Conservative, Base and Optimistic Scenarios, Till 2035 (USD Billion)
- Table 23.75 Digital Twins in Healthcare Market in Canada, Historical Trends, Since 2018 (USD Billion)
- Table 23.76 Digital Twins in Healthcare Market in Canada, Conservative, Base and Optimistic Scenarios, Till 2035 (USD Billion)
- Table 23.77 Digital Twins in Healthcare Market in Europe, Historical Trends, Since 2018 (USD Billion)
- Table 23.78 Digital Twins in Healthcare Market in Europe, Conservative, Base and Optimistic Scenarios, Till 2035 (USD Billion)
- Table 23.79 Digital Twins in Healthcare Market in France, Historical Trends, Since 2018 (USD Billion)
- Table 23.80 Digital Twins in Healthcare Market in France, Conservative, Base and Optimistic Scenarios, Till 2035 (USD Billion)
- Table 23.81 Digital Twins in Healthcare Market in Germany, Historical Trends, Since 2018 (USD Billion)
- Table 23.82 Digital Twins in Healthcare Market in Germany, Conservative, Base and Optimistic Scenarios, Till 2035 (USD Billion)
- Table 23.83 Digital Twins in Healthcare Market in Italy, Historical Trends, Since 2018 (USD Billion)
- Table 23.84 Digital Twins in Healthcare Market in Italy, Conservative, Base and Optimistic Scenarios, Till 2035 (USD Billion)
- Table 23.85 Digital Twins in Healthcare Market in Spain, Historical Trends, Since 2018 (USD Billion)
- Table 23.86 Digital Twins in Healthcare Market in Spain, Conservative, Base and Optimistic Scenarios, Till 2035 (USD Billion)
- Table 23.87 Digital Twins in Healthcare Market in the UK, Historical Trends, Since 2018 (USD Billion)
- Table 23.88 Digital Twins in Healthcare Market in the UK, Conservative, Base and Optimistic Scenarios, Till 2035 (USD Billion)
- Table 23.89 Digital Twins in Healthcare Market in Rest of the Europe, Historical Trends, Since 2018 (USD Billion)
- Table 23.90 Digital Twins in Healthcare Market in Rest of the Europe, Conservative, Base and Optimistic Scenarios, Till 2035 (USD Billion)
- Table 23.91 Digital Twins in Healthcare Market in Asia, Historical Trends, Since 2018 (USD Billion)
- Table 23.92 Digital Twins in Healthcare Market in Asia, Conservative, Base and Optimistic Scenarios, Till 2035 (USD Billion)
- Table 23.93 Digital Twins in Healthcare Market in China, Historical Trends, Since 2018 (USD Billion)
- Table 23.94 Digital Twins in Healthcare Market in China, Conservative, Base and Optimistic Scenarios, Till 2035 (USD Billion)
- Table 23.95 Digital Twins in Healthcare Market in India, Historical Trends, Since 2018 (USD Billion)
- Table 23.96 Digital Twins in Healthcare Market in India, Conservative, Base and Optimistic Scenarios, Till 2035 (USD Billion)
- Table 23.97 Digital Twins in Healthcare Market in Japan, Historical Trends, Since 2018 (USD Billion)
- Table 23.98 Digital Twins in Healthcare Market in Japan, Conservative, Base and Optimistic Scenarios, Till 2035 (USD Billion)
- Table 23.99 Digital Twins in Healthcare Market in Singapore, Historical Trends, Since 2018 (USD Billion)
- Table 23.100 Digital Twins in Healthcare Market in Singapore, Conservative, Base and Optimistic Scenarios, Till 2035 (USD Billion)
- Table 23.101 Digital Twins in Healthcare Market in South Korea, Historical Trends, Since 2018 (USD Billion)
- Table 23.102 Digital Twins in Healthcare Market in South Korea, Conservative, Base and Optimistic Scenarios, Till 2035 (USD Billion)
- Table 23.103 Digital Twins in Healthcare Market in Rest of the Asia, Historical Trends, Since 2018 (USD Billion)
- Table 23.104 Digital Twins in Healthcare Market in Rest of the Asia, Conservative, Base and Optimistic Scenarios, Till 2035 (USD Billion)
- Table 23.105 Digital Twins in Healthcare Market in Latin America, Historical Trends, Since 2018 (USD Billion)
- Table 23.106 Digital Twins in Healthcare Market in Latin America, Conservative, Base and Optimistic Scenarios, Till 2035 (USD Billion)
- Table 23.107 Digital Twins in Healthcare Market in Brazil, Historical Trends, Since 2018 (USD Billion)
- Table 23.108 Digital Twins in Healthcare Market in Brazil, Conservative, Base and Optimistic Scenarios, Till 2035 (USD Billion)
- Table 23.109 Digital Twins in Healthcare Market in Middle East and North Africa, Historical Trends, Since 2018 (USD Billion)
- Table 23.110 Digital Twins in Healthcare Market in Middle East and North Africa, Conservative, Base and Optimistic Scenarios, Till 2035 (USD Billion)
- Table 23.111 Digital Twins in Healthcare Market in UAE, Historical Trends, Since 2018 (USD Billion)
- Table 23.112 Digital Twins in Healthcare Market in UAE, Conservative, Base and Optimistic Scenarios, Till 2035 (USD Billion)
- Table 23.113 Digital Twins in Healthcare Market in Rest of the World, Historical Trends, Since 2018 (USD Billion)
- Table 23.114 Digital Twins in Healthcare Market in Rest of the World, Conservative, Base and Optimistic Scenarios, Till 2035 (USD Billion)
- Table 23.115 Digital Twins in Healthcare Market in Australia, Historical Trends, Since 2018 (USD Billion)
- Table 23.116 Digital Twins in Healthcare Market in Australia, Conservative, Base and Optimistic Scenarios, Till 2035 (USD Billion)
- Table 23.117 Digital Twins in Healthcare Market in New Zealand, Historical Trends, Since 2018 (USD Billion)
- Table 23.118 Digital Twins in Healthcare Market in New Zealand, Conservative, Base and Optimistic Scenarios, Till 2035 (USD Billion)
List of Figures
- Figure 2.1 Research Methodology: Research Assumptions
- Figure 2.2 Research Methodology: Project Methodology
- Figure 2.3 Research Methodology: Forecast Methodology
- Figure 2.4 Research Methodology: Robust Quality Control
- Figure 2.5 Research Methodology: Key Market Segmentations
- Figure 4.1 Executive Summary: Market Landscape
- Figure 4.2 Executive Summary: Partnerships and Collaborations
- Figure 4.3 Executive Summary: Funding and Investment Analysis
- Figure 4.4 Executive Summary: Market Forecast and Opportunity Analysis (I / II)
- Figure 4.5 Executive Summary: Market Forecast and Opportunity Analysis (II / II)
- Figure 5.1 Types of Digital Twins Used in Healthcare
- Figure 5.2 Applications of Digital Twins in the Healthcare Domain
- Figure 6.1 Digital Twins: Distribution by Development Status
- Figure 6.2 Digital Twins: Distribution by Therapeutic Area
- Figure 6.3 Digital Twins: Distribution by Areas of Application
- Figure 6.4 Digital Twins: Distribution by Type of Technology Used
- Figure 6.5 Digital Twins: Distribution by End Users
- Figure 6.6 Digital Twins: Distribution by Type of Digital Twin
- Figure 6.7 Digital Twin Developers: Distribution by Year of Establishment
- Figure 6.8 Digital Twin Developers: Distribution by Company Size
- Figure 6.9 Digital Twin Developers: Distribution by Location of Headquarters
- Figure 7.1 Key Insights: Distribution by Area of Application and Development Status
- Figure 7.2 Key Insights: Distribution by Type of Technology Used and Type of Digital Twin
- Figure 7.3 Key Insights: Distribution by Type of End User and Type of Digital Twin
- Figure 7.4 Key Insights: Distribution by Location of Headquarters and Area of Application
- Figure 7.5 Key Insights: Distribution by Company Size and Location of Headquarters
- Figure 8.1 Company Competitiveness Analysis: Benchmarking of Portfolio Strength
- Figure 8.2 Company Competitiveness Analysis: Benchmarking of Partnership Activity
- Figure 8.3 Company Competitiveness Analysis: Benchmarking of Funding Activity
- Figure 8.4 Company Competitiveness Analysis: Dot-plot Analysis of Players Based in North America
- Figure 8.5 Company Competitiveness Analysis: 3-D Bubble Chart Analysis of Players Based in North America
- Figure 8.6 Company Competitiveness Analysis: Dot-plot Analysis of Players Based in Europe
- Figure 8.7 Company Competitiveness Analysis: 3-D Bubble Chart Analysis of Players Based in Europe
- Figure 8.8 Company Competitiveness Analysis: 3-D Bubble Chart Analysis of Players Based in Asia and Rest of the World
- Figure 9.1 BigBear.ai: Annual Revenues, Since 2021 (USD Million)
- Figure 9.2 Certara: Annual Revenues, Since 2020 (USD Million)
- Figure 9.3 Dassault Systemes: Annual Revenues, Since 2019 (EUR Billion)
- Figure 11.1 Partnerships and Collaborations: Cumulative Year-wise Trend, Since 2018
- Figure 11.2 Partnerships and Collaborations: Distribution by Type of Partnership
- Figure 11.3 Partnerships and Collaborations: Distribution by Year and Type of Partnership
- Figure 11.4 Partnerships and Collaborations: Distribution by Type of Partnership and Company Size
- Figure 11.5 Most Active Players: Distribution by Number of Partnerships
- Figure 11.6 Partnerships and Collaborations: Local and International Agreements
- Figure 11.7 Partnerships and Collaborations: Intercontinental and Intracontinental Agreements
- Figure 12.1 Funding and Investment Analysis: Cumulative Year-wise Trend, Since 2018
- Figure 12.2 Funding and Investment Analysis: Cumulative Amount Invested (USD Million), Since 2018
- Figure 12.3 Funding and Investment Analysis: Distribution of Instances by Type of Funding, Since 2018
- Figure 12.4 Funding and Investment Analysis: Year-Wise Distribution by Type of Funding, Since 2018
- Figure 12.5 Funding and Investment Analysis: Distribution of Total Amount Invested (USD Million) by Type of Funding, Since 2018
- Figure 12.6 Funding and Investment Analysis: Distribution by Geography
- Figure 12.7 Most Active Players: Distribution by Number of Funding Instances, Since 2018
- Figure 12.8 Most Active Players: Distribution by Amount Raised (USD Million), Since 2018
- Figure 12.9 Funding and Investment Summary, Since 2018 (USD Million)
- Figure 13.1 Berkus Start-Up Valuation: Total Valuation of Players (USD Million)
- Figure 13.2 AI Body: Benchmarking of Berkus Start-Up Valuation Parameters
- Figure 13.3 AnatoScope: Benchmarking of Berkus Start-Up Valuation Parameters
- Figure 13.4 Antleron: Benchmarking of Berkus Start-Up Valuation Parameters
- Figure 13.5 EmbodyBio: Benchmarking of Berkus Start-Up Valuation Parameters
- Figure 13.6 Klinik Sankt Moritz: Benchmarking of Berkus Start-Up Valuation Parameters
- Figure 13.7 MAI: Benchmarking of Berkus Start-Up Valuation Parameters
- Figure 13.8 Mindbank AI: Benchmarking of Berkus Start-Up Valuation Parameters
- Figure 13.9 Neo PLM: Benchmarking of Berkus Start-Up Valuation Parameters
- Figure 13.10 TwInsight: Benchmarking of Berkus Start-Up Valuation Parameters
- Figure 13.11 Sound Idea: Benchmarking of Players
- Figure 13.12 Prototype: Benchmarking of Players
- Figure 13.13 Management Experience: Benchmarking of Players
- Figure 13.14 Strategic Relationships: Benchmarking of Players
- Figure 13.15 Total Valuation: Benchmarking of Players
- Figure 14.1 Digital Twins in Healthcare: Market Drivers
- Figure 14.2 Digital Twins in Healthcare: Market Restraints
- Figure 14.3 Digital Twins in Healthcare: Market Opportunities
- Figure 14.4 Digital Twins in Healthcare: Market Challenges
- Figure 15.1 Global Digital Twins in Healthcare Market, Historical Trends (Since 2018) and Forecasted Estimates (Till 2035) (USD Billion)
- Figure 15.2 Global Digital Twins in Healthcare Market, Forecasted Estimates (Till 2035): Conservative Scenario (USD Billion)
- Figure 15.3 Global Digital Twins in Healthcare Market, Forecasted Estimates (Till 2035): Optimistic Scenario (USD Billion)
- Figure 16.1 Digital Twins in Healthcare Market: Distribution by Therapeutic Area
- Figure 16.2 Digital Twins in Healthcare Market for Cardiovascular Disorders, Historical Trends (Since 2018) and Forecasted Estimates (Till 2035) (USD Billion)
- Figure 16.3 Digital Twins in Healthcare Market for Metabolic Disorders, Historical Trends (Since 2018) and Forecasted Estimates (Till 2035) (USD Billion)
- Figure 16.4 Digital Twins in Healthcare Market for Orthopedic Disorders, Historical Trends (Since 2018) and Forecasted Estimates (Till 2035) (USD Billion)
- Figure 16.5 Digital Twins in Healthcare Market for Other Disorders, Historical Trends (Since 2018) and Forecasted Estimates (Till 2035) (USD Billion)
- Figure 17.1 Digital Twins in Healthcare Market: Distribution by Type of Digital Twin
- Figure 17.2 Digital Twins in Healthcare Market for Process Twins, Historical Trends (Since 2018) and Forecasted Estimates (Till 2035) (USD Billion)
- Figure 17.3 Digital Twins in Healthcare Market for System Twins, Historical Trends (Since 2018) and Forecasted Estimates (Till 2035) (USD Billion)
- Figure 17.4 Digital Twins in Healthcare Market for Whole Body Twins, Historical Trends (Since 2018) and Forecasted Estimates (Till 2035) (USD Billion)
- Figure 17.5 Digital Twins in Healthcare Market for Body Part Twins, Historical Trends (Since 2018) and Forecasted Estimates (Till 2035) (USD Billion)
- Figure 18.1 Digital Twins in Healthcare Market: Distribution by Area of Application
- Figure 18.2 Digital Twins in Healthcare Market for Asset / Process Management, Historical Trends (Since 2018) and Forecasted Estimates (Till 2035) (USD Billion)
- Figure 18.3 Digital Twins in Healthcare Market for Personalized Treatment, Historical Trends (Since 2018) and Forecasted Estimates (Till 2035) (USD Billion)
- Figure 18.4 Digital Twins in Healthcare Market for Surgical Planning, Historical Trends (Since 2018) and Forecasted Estimates (Till 2035) (USD Billion)
- Figure 18.5 Digital Twins in Healthcare Market for Diagnosis, Historical Trends (Since 2018) and Forecasted Estimates (Till 2035) (USD Billion)
- Figure 18.6 Digital Twins in Healthcare Market for Other Application Areas, Historical Trends (Since 2018) and Forecasted Estimates (Till 2035) (USD Billion)
- Figure 19.1 Digital Twins in Healthcare Market: Distribution by End Users
- Figure 19.2 Digital Twins in Healthcare Market for Pharmaceutical Companies, Historical Trends (Since 2018) and Forecasted Estimates (Till 2035) (USD Billion)
- Figure 19.3 Digital Twins in Healthcare Market for Medical Device Manufacturers, Historical Trends (Since 2018) and Forecasted Estimates (Till 2035) (USD Billion)
- Figure 19.4 Digital Twins in Healthcare Market for Healthcare Providers, Historical Trends (Since 2018) and Forecasted Estimates (Till 2035) (USD Billion)
- Figure 19.5 Digital Twins in Healthcare Market for Patients, Historical Trends (Since 2018) and Forecasted Estimates (Till 2035) (USD Billion)
- Figure 19.6 Digital Twins in Healthcare Market for Other End Users, Historical Trends (Since 2018) and Forecasted Estimates (Till 2035) (USD Billion)
- Figure 20.1 Digital Twins in Healthcare Market: Distribution by Key Geographies
- Figure 20.2 Digital Twins in Healthcare Market in North America, Historical Trends (Since 2018) and Forecasted Estimates (Till 2035) (USD Billion)
- Figure 20.3 Digital Twins in Healthcare Market in the US, Historical Trends (Since 2018) and Forecasted Estimates (Till 2035) (USD Billion)
- Figure 20.4 Digital Twins in Healthcare Market in Canada, Historical Trends (Since 2018) and Forecasted Estimates (Till 2035) (USD Billion)
- Figure 20.5 Digital Twins in Healthcare Market in Europe, Historical Trends (Since 2018) and Forecasted Estimates (Till 2035) (USD Billion)
- Figure 20.6 Digital Twins in Healthcare Market in France, Historical Trends (Since 2018) and Forecasted Estimates (Till 2035) (USD Billion)
- Figure 20.7 Digital Twins in Healthcare Market in Germany, Historical Trends (Since 2018) and Forecasted Estimates (Till 2035) (USD Billion)
- Figure 20.8 Digital Twins in Healthcare Market in Italy, Historical Trends (Since 2018) and Forecasted Estimates (Till 2035) (USD Billion)
- Figure 20.9 Digital Twins in Healthcare Market in Spain, Historical Trends (Since 2018) and Forecasted Estimates (Till 2035) (USD Billion)
- Figure 20.10 Digital Twins in Healthcare Market in the UK, Historical Trends (Since 2018) and Forecasted Estimates (Till 2035) (USD Billion)
- Figure 20.11 Digital Twins in Healthcare Market in Rest of the Europe, Historical Trends (Since 2018) and Forecasted Estimates (Till 2035) (USD Billion)
- Figure 20.12 Digital Twins in Healthcare Market in Asia, Historical Trends (Since 2018) and Forecasted Estimates (Till 2035) (USD Billion)
- Figure 20.13 Digital Twins in Healthcare Market in China, Historical Trends (Since 2018) and Forecasted Estimates (Till 2035) (USD Billion)
- Figure 20.14 Digital Twins in Healthcare Market in India, Historical Trends (Since 2018) and Forecasted Estimates (Till 2035) (USD Billion)
- Figure 20.15 Digital Twins in Healthcare Market in Japan, Historical Trends (Since 2018) and Forecasted Estimates (Till 2035) (USD Billion)
- Figure 20.16 Digital Twins in Healthcare Market in Singapore, Historical Trends (Since 2018) and Forecasted Estimates (Till 2035) (USD Billion)
- Figure 20.17 Digital Twins in Healthcare Market in South Korea, Historical Trends (Since 2018) and Forecasted Estimates (Till 2035) (USD Billion)
- Figure 20.18 Digital Twins in Healthcare Market in Rest of the Asia, Historical Trends (Since 2018) and Forecasted Estimates (Till 2035) (USD Billion)
- Figure 20.19 Digital Twins in Healthcare Market in Latin America, Historical Trends (Since 2018) and Forecasted Estimates (Till 2035) (USD Billion)
- Figure 20.20 Digital Twins in Healthcare Market in Brazil, Historical Trends (Since 2018) and Forecasted Estimates (Till 2035) (USD Billion)
- Figure 20.21 Digital Twins in Healthcare Market in Middle East and North Africa, Historical Trends (Since 2018) and Forecasted Estimates (Till 2035) (USD Billion)
- Figure 20.22 Digital Twins in Healthcare Market in UAE, Historical Trends (Since 2018) and Forecasted Estimates (Till 2035) (USD Billion)
- Figure 20.23 Digital Twins in Healthcare Market in Rest of the World, Historical Trends (Since 2018) and Forecasted Estimates (Till 2035) (USD Billion)
- Figure 20.24 Digital Twins in Healthcare Market in Australia, Historical Trends (Since 2018) and Forecasted Estimates (Till 2035) (USD Billion)
- Figure 20.25 Digital Twins in Healthcare Market in New Zealand, Historical Trends (Since 2018) and Forecasted Estimates (Till 2035) (USD Billion)
- Figure 21.1 Conclusion: Market Landscape
- Figure 21.2 Conclusion: Partnerships and Collaborations
- Figure 21.3 Conclusion: Funding and Investments
- Figure 21.4 Conclusion: Berkus Start-up Valuation Analysis
- Figure 21.5 Conclusion: Market Forecast (I / II)
- Figure 21.6 Conclusion: Market Forecast (II / II)
 医疗保健领域的数位双胞胎市场:按产品、组件、技术、部署模式、应用、疾病领域和最终用户划分-2026-2032年全球市场预测
 2026年全球数位双胞胎心肺体外迴圈市场报告
 医疗产业数位双胞胎市场分析及预测(至2035年),依类型、产品类型、服务、技术、组件、应用、设备、部署类型、最终用户及解决方案划分数位高程模型市场分析及预测(至2035年):依类型、产品类型、服务、技术、组件、应用、最终用户、部署类型及功能划分
 医疗保健数位双胞胎市场 - 全球产业规模、份额、趋势、机会及预测(按类型、最终用途、应用、地区和竞争格局划分,2021-2031年)医疗保健领域数位孪生市场-全球产业规模、份额、趋势、机会和预测,按组件、应用、最终用户、地区和竞争格局划分,2021-2031年预测2025年医疗保健数位双胞胎全球市场报告
 2032 年脑建模数位双胞胎市场预测:按组件、应用、最终用户和地区进行的全球分析
 全球医疗保健数位双胞胎市场
 医疗保健市场的数位双胞胎(按组件、类型、应用、最终用户和地区划分)- 预测至 2030 年