


 |
市场调查报告书
商品编码
1762538
即用型医药包装市场:产业趋势及全球预测 - 依容器类型、封盖类型、製造材料及主要地区划分Ready to Use Pharmaceutical Packaging Market : Industry Trends and Global Forecasts - Distribution by Type of Container, Type of Closure, Material of Fabrication and Key Geographical Regions |
||||||
即用型医药包装市场:概览
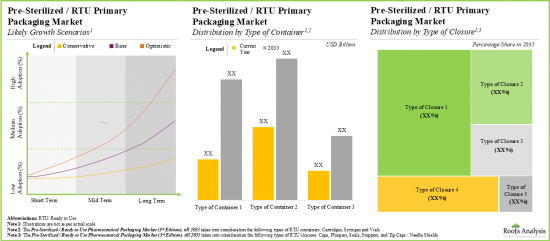
预计2035年,全球即用型医药包装市场规模将从目前的95亿美元成长至251亿美元,预测期间内年复合成长率为9.2%。
市场区隔包括以下参数的市场规模与机会分析:
容器类型
- 无菌药筒
- 无菌注射器
- 无菌小瓶
封盖类型
- 瓶盖
- 柱塞
- 密封件
- 瓶塞
- 尖端盖/针套
製造材料
- 铝
- 玻璃
- 塑胶
- 橡胶
主要地区
- 北美
- 欧洲
- 亚洲
- 拉丁美洲
- 中东和北非
- 世界其他地区
药品包装市场的成长与趋势
多年来,美国食品药物管理局(FDA)已确认,平均每年约有 50 种药品获得 FDA 批准。此外,研究表明,全球每年消耗超过 10万吨药品。不断成长的药品供应线无意中导致了对初级和二级药品包装解决方案的需求相应增加。然而,传统的初级包装面临若干挑战,包括生产计画延迟和严格的法规。这导致业内人士将重点转向无菌/RTU(即用型)初级包装解决方案。
RTU 药品初级包装已成为传统初级包装的一种有前景的替代方案,为简化药品填充和封口操作增添了显着的价值。这些包装组件省去了整个灌装和封口製造过程中的多个步骤(主要是清洁、灭菌和容器准备),有助于提高营运效率,符合现有的监管标准。此外,RTU 包装系统经过预处理,可去除热原(人体摄入后会引起发烧的物质),并确保药物成分符合药典标准。由于医用聚合物的其他一些优势,RTU 容器封盖系统在製药业逐渐普及。
即用型药品包装市场:关键洞察
本报告分析了即用型药品包装市场的现状,并探讨了潜在的成长机会。主要调查结果包括:
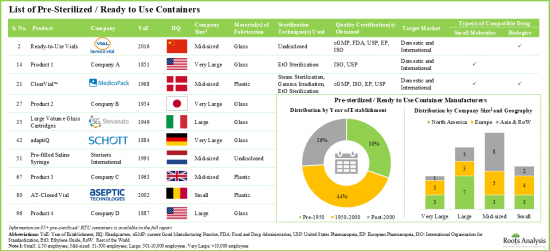
- 目前,近50家製造商销售或开发超过95种类型的无菌/即用型容器,其中相当一部分是在2000年之前问世的。
- 近45%的即用容器以小瓶形式提供,其中大多数产品采用环氧乙烷(EtO)灭菌。
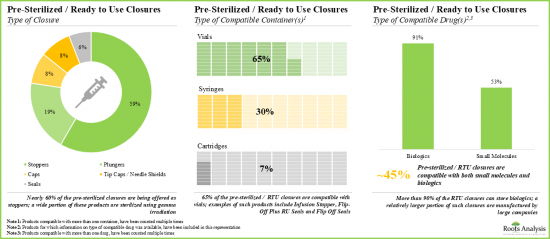
- 全球各地的不同公司生产约85种无菌/即用型瓶盖,其中约60%的总部位于亚洲。
- 各种即用型瓶盖可与小瓶、注射器和卡式瓶等各种类型的容器相容,为生物製剂和小分子製剂提供最佳的包装解决方案。
- 为了获得竞争优势,从事即用型容器和封盖製造的公司目前正致力于在各自的产品中融入先进功能。
- 约有40家公司声称提供具有不同自由度的机器人,以提高各种製药操作的生产力和灵活性。
- 从合作活动中可以明显看出,利害关係人对即用型容器和封盖领域的兴趣日益浓厚。
- 基于知识资本,提出了一个独特的框架,使利害关係人能够评估进入无菌/即用型初级包装产业的可行性。
- 预计未来几年,小瓶将占无菌/即用型容器需求的近55%。
- 预计即用型初级包装市场未来几年将以 9.2%的年复合成长率成长,主要得益于无菌/RTU 容器带来的收入。
- RTU 药品包装的预测机会可能分布在不同类型的初级包装系统、製造材料和主要地理区域。
- 由于对能够满足复杂药品要求的先进包装材料和技术的需求不断成长,该行业存在多种成长机会。
即用型药品包装市场:主要细分市场
依容器类型,市场细分为无菌卡式瓶、无菌注射器和无菌小瓶。目前,无菌注射器市场在全球即用型医药包装市场。此外,无菌小瓶细分市场的即用型医药包装预计在预测期内将展现最高的市场成长潜力。
依封盖类型,市场细分为瓶盖、柱塞、密封件、瓶塞和针头盖/针头护罩。目前,柱塞区隔在全球即用型医药包装市场中占有最大占有率。然而,预计瓶盖区隔在预测期内的年复合成长率将更高。
依製造材料细分,市场细分为铝、玻璃、塑胶和橡胶。目前,塑胶区隔在全球即用型医药包装市场中所占比例最高,其次是玻璃区隔,预计在预测期内玻璃区隔将以更高的年复合成长率成长。
依主要地区划分,市场细分为北美、欧洲、亚洲、拉丁美洲、中东和非洲以及世界其他地区。目前,亚洲在全球即用型医药包装市场占据主导地位,占据最大的收入占有率。此外,亚洲市场未来年复合成长率可能更高。
医药包装市场参与者
- APG Pharma
- Aptar
- Daikyo Seiko
- Datwyler
- DWK Life Sciences
- Ningbo Zhengli Pharmaceutical Packaging
- SCHOTT
- Stevanto
- West Pharmaceutical Services
目录
第1章 简介
第2章 研究方法
第3章 经济及其他专案特定考量
- 章节概述
- 市场动态
第4章 执行摘要
- 章节概述
第5章 导论
- 章节概述
- 药品包装与填充
- 即用型内包装
- 结论
第6章 无菌/即用型容器:市场格局
- 章节概述
- 无菌/即用型容器:市场格局
- 无菌/即用型容器:製造商格局
第7章 无菌/即用型封盖:市场格局
- 章节概述
- 无菌/即用型封盖:市场格局
- 无菌/即用型封盖:製造商格局
第8章 关键洞察
- 章节概述
- 无菌/即用型容器:关键洞察
- 无菌/即用型封盖:关键洞察
第9章 产品竞争力分析:无菌/即用型容器
- 章节概述
- 无菌/即用型容器:产品竞争力分析
第10章 产品竞争力分析:无菌/即用型瓶盖
- 章节概述
- 无菌/即用型瓶盖:产品竞争力分析
第11章 公司简介
- 章节概述
- APG Pharma Packaging
- Aptar
- Daikyo Seiko
- Datwyler
- DWK Life Sciences
- Ningbo Zhengli Pharmaceutical Packaging
- SCHOTT
- Stevanato
- West Pharmaceutical Services
第12章 合作伙伴关係与合作
- 章节概述
- 合作伙伴关係模式
- 无菌/即用型药品包装:伙伴关係与合作
第13章 市场进入决策架构
- 章节概述
- 关键假设与研究方法
- 影响市场进入决策的关键参数
- 结论
第14章 需求分析
- 章节概述
- 范围与研究方法
- 全球无菌/即用型药品包装需求:依容器类型
- 全球无菌/即用型药品包装需求:依封口类型
- 全球无菌/即用型药品包装需求:依製造材料
- 全球无菌/即用型药品包装需求:依主要地区
第15章 市场影响分析:驱动因素、限制因素、机会与挑战
第16章 全球无菌/即用型医药包装市场
- 章节概述
- 假设与研究方法
- 全球无菌/即用型医药包装市场的历史趋势(2018年至今)及预测(至2035年)
- 主要市场细分
- 动态资料分析shboard
第17章 无菌/即用型药品包装市场:依容器类型
- 章节概述
- 关键假设与研究方法
- 无菌/即用型药品包装市场:依容器型式
- 资料三角测量与验证
第18章 无菌/即用型药品包装市场:依封盖类型
- 章节概述
- 关键假设与研究方法
- 无菌/即用型药品包装市场:依封盖类型
- 资料三角测量与验证
第19章 无菌/即用型药品包装市场:依製造材料
- 章节概述
- 关键假设与研究方法
- 无菌/即用型药品包装市场:依製造材料
- 资料三角测量与验证
第20章 无菌/即用型药品包装市场:依主要地区
- 章节概述
- 关键假设与研究方法
- 北美
- 欧洲
- 亚洲
- 拉丁美洲
- 中东和北非
- 世界其他地区
- 资料三角测量与验证
第21章 药品包装的新兴趋势
- 章节概述
- 新兴趋势
- 结论
第22章 案例研究:药品包装中的机器人技术
- 第概述
- 製药业的机器人技术
- 为製药业提供机器人的公司
- 为药品包装提供设备整合机器人系统的公司
- 结论
第23章 结论
第24章 高层洞察
第25章 附录1:表格资料
第26章 附录2:公司与组织清单
READY TO USE PHARMACEUTICAL PACKAGING MARKET: OVERVIEW
As per Roots Analysis, the global ready-to-use pharmaceutical packaging market is estimated to grow from USD 9.5 billion in the current year to USD 25.1 billion by 2035, at a CAGR of 9.2% during the forecast period, till 2035.
The market sizing and opportunity analysis has been segmented across the following parameters:
Type of Container
- Sterile Cartridges
- Sterile Syringes
- Sterile Vials
Type of Closure
- Caps
- Plungers
- Seals
- Stoppers
- Tip Caps / Needle Shields
Material of Fabrication
- Aluminum
- Glass
- Plastic
- Rubber
Key Geographical Regions
- North America
- Europe
- Asia
- Latin America
- Middle East and North Africa
- Rest of the World
READY TO USE PHARMACEUTICAL PACKAGING MARKET: GROWTH AND TRENDS
Over the years, it has been identified that on an average, around 50 drugs are approved by the US Food and Drug Administration (US FDA) annually. Further, studies indicate that more than 100,000 tons of pharmaceutical products are consumed globally per year. The growing pipeline of pharmaceutical drug products has inadvertently led to an increase in the demand for their associated primary and secondary pharmaceutical packaging solutions. However, traditional primary packing is fraught with several challenges, including delayed production timelines and stringent regulations. This has prompted the industry stakeholders to shift their focus towards pre-sterilized / ready to use (RTU) primary packaging solutions.
The ready to use of pharmaceutical primary packaging has emerged as a promising alternative to conventional primary packaging, adding significant value to streamline pharmaceutical fill / finish operations. These packaging components eliminate multiple steps in the overall fill finished manufacturing (mainly washing, sterilizing and preparing containers), thereby, helping improve operational efficiencies in compliance with existing regulatory standards. Further, RTU packaging systems are pre-treated in order to remove pyrogens (substances that can induce fever when introduced into the body) to ensure that the drug components meet pharmacopeial standards. Owing to several other benefits offered by medical polymers, RTU container-closure systems have gradually gained popularity in the pharmaceutical industry.
READY TO USE PHARMACEUTICAL PACKAGING MARKET: KEY INSIGHTS
The report delves into the current state of the ready-to-use pharmaceutical packaging market and identifies potential growth opportunities within industry. Some key findings from the report include:
- Presently, over 95 pre-sterilized / ready-to-use containers are available or being developed by close to 50 manufacturers; a relatively larger proportion of these players were established before 2000.
- Nearly 45% of the ready-to-use containers are being offered as vials; majority of these products are sterilized using ethylene oxide (EtO).
- Around 85 pre-sterilized / RTU closures are being manufactured by players across the globe; ~60% of these firms are headquartered in Asia.
- A wide range of RTU closures are compatible with different types of containers, including vials, syringes and cartridges, providing optimal packaging solutions for biologics and small molecules.
- In pursuit of gaining a competitive edge, companies engaged in the manufacturing of RTU containers and closures are presently focusing on the integration of advanced features into their respective product offerings.
- Around 40 companies claim to offer robotic machinery, with different degrees of freedom, to enhance the productivity and flexibility of various pharmaceutical operations.
- The rising interest of stakeholders in the RTU containers and closures domain is also evident from the partnership activity; in fact, the maximum number of collaborations were inked in the last two years.
- Based on our intellectual capital, we have proposed a proprietary framework enabling stakeholders to evaluate the viability of entering the pre-sterilized / RTU primary packaging industry.
- Vials are expected to account for close to 55% of the demand for pre-sterilized / ready to use containers in the foreseen future.
- The RTU primary packaging market is anticipated to grow at a CAGR of 9.2% over the next few years, primarily driven by the revenues generated from pre-sterilized / ready to use containers.
- The projected opportunity of RTU pharmaceutical packaging is likely to be distributed across different types of primary packaging systems, materials of fabrication and key geographical regions.
- Several growth opportunities exist in the industry owing to the increasing demand for advanced packaging materials and technologies that can accommodate the requirements of complex drug products.
READY TO USE PHARMACEUTICAL PACKAGING MARKET: KEY SEGMENTS
Sterile Syringes Segment holds the Largest Share of the Ready to Use Pharmaceutical Packaging Market
Based on the type of container, the market is segmented into sterile cartridges, sterile syringes and sterile vials. At present, the sterile syringes segment holds the maximum share of the global ready-to-use pharmaceutical packaging market. Further, the ready-to-use pharmaceutical packaging market for the sterile vials segment is expected to show the highest market growth potential during the forecast period.
By Type of Closure, Caps Segment is Expected to Grow at a Faster Pace During the Forecast Period
Based on the type of closure, the market is segmented into caps, plungers, seals, stoppers and tip caps / needle shields. At present, the plungers segment holds the maximum share of the global ready-to-use pharmaceutical packaging market. However, the market for caps segment is expected to grow at a higher CAGR during the forecast period.
By Material of Fabrication, Plastic Segment Accounts for the Largest Share of the Global Ready to Use Pharmaceutical Packaging Market
Based on the material of fabrication, the market is segmented into aluminum, glass, plastic and rubber. Currently, the plastic segment captures the highest proportion of the global ready-to-use pharmaceutical packaging market. This is followed by the glass segment which is expected to grow at a higher CAGR during the forecast period.
Asia Accounts for the Largest Share of the Market
Based on key geographical regions, the market is segmented into North America, Europe, Asia, Latin America, Middle East and North Africa, and Rest of the World. Currently, Asia dominates the global ready-to-use pharmaceutical packaging market and accounts for the largest revenue share. Further, the market in Asia is likely to grow at a higher CAGR in the coming future.
Example Players in the Ready to Use Pharmaceutical Packaging Market
- APG Pharma
- Aptar
- Daikyo Seiko
- Datwyler
- DWK Life Sciences
- Ningbo Zhengli Pharmaceutical Packaging
- SCHOTT
- Stevanto
- West Pharmaceutical Services
READY TO USE PHARMACEUTICAL PACKAGING MARKET: RESEARCH COVERAGE
- Market Sizing and Opportunity Analysis: The report features an in-depth analysis of the global ready-to-use pharmaceutical packaging market, focusing on key market segments, including [A] type of container, [B] type of closure, [C] material of fabrication and [D] key geographical regions.
- Pre-Sterilized / Ready to Use Containers Market Landscape: A comprehensive evaluation of the pre-sterilized / ready to use containers, based on several relevant parameters, such as [A] type of container, [B] material(s) of fabrication, [C] container color, [D] type of compatible drug(s), [E] scale of operation, [F] packaging format(s), [G] sterilization technique(s) used, [H] quality certification(s) obtained, [I] target market, [J] availability of additional coating and RTU kits. Additionally, a comprehensive evaluation of pre-sterilized / ready to use container manufacturers, based on parameters, such as [A] year of establishment, [B] company size (in terms of number of employees) and [C] location of headquarters.
- Pre-Sterilized / Ready to Use Closures Market Landscape: A comprehensive evaluation of the pre-sterilized / ready to use closures, based on several relevant parameters, such as [A] type of closure, [B] material(s) of fabrication, [C] type of compatible container(s), [D] type of compatible drug(s), [E] sterilization technique(s) used, [F] available finish format(s), [G] quality certification(s) obtained, [H] target market and [I] availability of additional coating. Additionally, a comprehensive evaluation of pre-sterilized / ready to use closure manufacturers, based on parameters, such as [A] year of establishment, [B] company size (in terms of number of employees) and [C] location of headquarters.
- Key Insights: In-depth analysis of market trends in the pre-sterilized / ready to use containers and closures domain, based on relevant parameters, such as [A] type of container and scale of operation, [B] type of container and packaging format(s), [C] type of container and material(s) of fabrication, [D] type of container and container color, [E] type of container and sterilization technique(s) used, [F] type of container and type of compatible drug(s), [G] material(s) of fabrication and sterilization technique(s) used, [H] type of closure and material(s) of fabrication, [I] type of closure and sterilization technique(s) used, [J] type of closure and available finish format(s), and [K] type of closure and type of compatible drug(s).
- Product Competitiveness Analysis for Pre-Sterilized / Ready to Use Containers: A comprehensive competitive analysis of various types of pre-sterilized / ready to use containers, examining factors, such as [A] company strength and [B] product competitiveness.
- Product Competitiveness Analysis for Pre-Sterilized / Ready to Use Closures: A comprehensive competitive analysis of various types of pre-sterilized / ready to use closures, examining factors, such as [A] company strength and [B] product competitiveness.
- Company Profiles: In-depth profiles of key players that are engaged in offering pre-sterilized / ready-to-use containers and closures, focusing on [A] overview of the company, [B] financial information (if available), [C] product portfolio and [D] recent developments and an informed future outlook.
- Partnerships and Collaborations: An insightful analysis of the deals inked by stakeholders in the ready-to-use pharmaceutical packaging market, based on several parameters, such as [A] year of partnership, [B] type of partnership. [C] type of partner, [D] focus area, [E] type of packaging system, [F] type of packaging material, [G] most active players and [H] geography.
- Market Entry Decision Making Framework: A comprehensive framework to identify the unmet needs and assist players in entering the pre-sterilized / RTU primary packaging domain, focusing on various factors, such as [A] product reach, [B] market activity, [C] product differentiation, [D] competitiveness and [E] manufacturing complexity.
- Demand Analysis: A detailed assessment of the current and future demand for pre-sterilized / ready to use containers and closures, based on various relevant parameters, such as [A] type of primary packaging system and [B] material of fabrication used.
- Market Impact Analysis: A thorough analysis of various factors, such as drivers, restraints, opportunities, and existing challenges that are likely to impact market growth.
- Case Study: A detailed discussion on the use of robotic machinery in pharmaceutical manufacturing and fill / finish operations, featuring the various advantages of employing automation / automated technologies in such processes.
KEY QUESTIONS ANSWERED IN THIS REPORT
- How many companies are currently engaged in this market?
- Which are the leading companies in this market?
- What factors are likely to influence the evolution of this market?
- What is the current and future market size?
- What is the CAGR of this market?
- How is the current and future market opportunity likely to be distributed across key market segments?
REASONS TO BUY THIS REPORT
- The report provides a comprehensive market analysis, offering detailed revenue projections of the overall market and its specific sub-segments. This information is valuable to both established market leaders and emerging entrants.
- Stakeholders can leverage the report to gain a deeper understanding of the competitive dynamics within the market. By analyzing the competitive landscape, businesses can make informed decisions to optimize their market positioning and develop effective go-to-market strategies.
- The report offers stakeholders a comprehensive overview of the market, including key drivers, barriers, opportunities, and challenges. This information empowers stakeholders to stay abreast of market trends and make data-driven decisions to capitalize on growth prospects.
ADDITIONAL BENEFITS
- Complimentary PPT Insights Packs
- Complimentary Excel Data Packs for all Analytical Modules in the Report
- 15% Free Content Customization
- Detailed Report Walkthrough Session with Research Team
- Free Updated report if the report is 6-12 months old or older
TABLE OF CONTENTS
1. PREFACE
- 1.1. Introduction
- 1.2. Key Market Insights
- 1.3. Project Objectives
- 1.4. Scope of the Report
- 1.5. Inclusions and Exclusions
- 1.6. Key Questions Answered
- 1.7. Chapter Outlines
2. RESEARCH METHODOLOGY
- 2.1. Chapter Overview
- 2.2. Research Assumptions
- 2.3. Project Methodology
- 2.4. Forecast Methodology
- 2.5. Robust Quality Control
- 2.7. Key Considerations
- 2.7.1. Demographics
- 2.7.2. Economic Factors
- 2.7.3. Government Regulations
- 2.7.4. Supply Chain
- 2.7.5. COVID Impact / Related Factors
- 2.7.6. Market Access
- 2.7.7. Healthcare Policies
- 2.7.8. Industry Consolidation
- 2.7.9. Key Market Segmentations
3. ECONOMIC AND OTHER PROJECT SPECIFIC CONSIDERATIONS
- 3.1. Chapter Overview
- 3.2. Market Dynamics
- 3.2.1. Time Period
- 3.2.1.1. Historical Trends
- 3.2.1.2. Current and Future Estimates
- 3.2.2. Currency Coverage
- 3.2.2.1. Overview of Major Currencies Affecting the Market
- 3.2.2.2. Impact of Currency Fluctuations on the Industry
- 3.2.3. Foreign Exchange Impact
- 3.2.3.1. Evaluation of Foreign Exchange Rates and Their Impact on Market
- 3.2.3.2. Strategies for Mitigating Foreign Exchange Risk
- 3.2.4. Recession
- 3.2.4.1. Historical Analysis of Past Recessions and Lessons Learnt
- 3.2.4.2. Assessment of Current Economic Conditions and Potential Impact on the Market
- 3.2.5. Inflation
- 3.2.5.1. Measurement and Analysis of Inflationary Pressures in the Economy
- 3.2.5.2. Potential Impact of Inflation on the Market Evolution
- 3.2.1. Time Period
4. EXECUTIVE SUMMARY
- 4.1. Chapter Overview
5. INTRODUCTION
- 5.1. Chapter Overview
- 5.2. Pharmaceutical Packaging and Filling
- 5.2.1. Need for Pharmaceutical Packaging
- 5.2.2. Types of Pharmaceutical Packaging
- 5.2.3. Limitations of Traditional Primary Packaging
- 5.2.4. Innovation in Pharmaceutical Packaging
- 5.3. Ready to Use Primary Packaging
- 5.3.1. Sterilization Techniques used in Primary Packaging
- 5.3.2. Advantages of Ready to Use Primary Packaging
- 5.3.3. Cost Saving Opportunities in Ready to Use Primary Packaging
- 5.3.4. Current Demand for Ready to Use Primary Packaging
- 5.4. Concluding Remarks
6. PRE-STERILIZED / READY TO USE CONTAINERS: MARKET LANDSCAPE
- 6.1. Chapter Overview
- 6.2. Pre-Sterilized / Ready to Use Containers: Overall Market Landscape
- 6.2.1. Analysis by Type of Container
- 6.2.2. Analysis by Material(s) of Fabrication
- 6.2.3. Analysis by Container Color
- 6.2.4. Analysis by Type of Compatible Drug(s)
- 6.2.5. Analysis by Scale of Operation
- 6.2.6. Analysis by Packaging Format(s)
- 6.2.7. Analysis by Sterilization Technique(s) Used
- 6.2.8. Analysis by Quality Certification(s) Obtained
- 6.2.9. Analysis by Target Market
- 6.2.10. Analysis by Availability of Additional Coating
- 6.2.11. Analysis by Availability of RTU Kits
- 6.3. Pre-Sterilized / Ready to Use Containers: Manufacturer Landscape
- 6.3.1. Analysis by Year of Establishment
- 6.3.2. Analysis by Company Size
- 6.3.3. Analysis by Location of Headquarters
- 6.3.4. Leading Manufacturers: Analysis by Number of Products
7. PRE-STERILIZED / READY TO USE CLOSURES: MARKET LANDSCAPE
- 7.1. Chapter Overview
- 7.2. Pre-Sterilized / Ready to Use Closures: Overall Market Landscape
- 7.2.1. Analysis by Type of Closure
- 7.2.2. Analysis by Material(s) of Fabrication
- 7.2.3. Analysis by Type of Compatible Container(s)
- 7.2.4. Analysis by Type of Compatible Drug(s)
- 7.2.5. Analysis by Sterilization Technique(s) Used
- 7.2.6. Analysis by Available Finish Format(s)
- 7.2.7. Analysis by Quality Certification(s) Obtained
- 7.2.8. Analysis by Target Market
- 7.2.9. Analysis by Availability of Additional Coating
- 7.3. Pre-Sterilized / Ready to Use Closures: Manufacturer Landscape
- 7.3.1. Analysis by Year of Establishment
- 7.3.2. Analysis by Company Size
- 7.3.3. Analysis by Location of Headquarters
- 7.3.4. Leading Manufacturers: Analysis by Number of Products
8. KEY INSIGHTS
- 8.1. Chapter Overview
- 8.2. Pre-Sterilized / Ready to Use Containers: Key Insights
- 8.2.1. Analysis by Type of Container and Scale of Operation
- 8.2.2. Analysis by Type of Container and Packaging Format(s)
- 8.2.3. Analysis by Type of Container and Material(s) of Fabrication
- 8.2.4. Analysis by Type of Container and Container Color
- 8.2.5. Analysis by Type of Container and Sterilization Technique(s) Used
- 8.2.6. Analysis by Type of Container and Type of Compatible Drug(s)
- 8.2.7. Analysis by Material(s) of Fabrication and Sterilization Technique(s) Used
- 8.3. Pre-Sterilized / Ready to Use Closures: Key Insights
- 8.3.1. Analysis by Type of Closure and Material(s) of Fabrication
- 8.3.2. Analysis by Type of Closure and Sterilization Technique(s) Used
- 8.3.3. Analysis by Type of Closure and Available Finish Format(s)
- 8.3.4. Analysis by Type of Closure and Type of Compatible Drug(s)
9. PRODUCT COMPETITIVENESS ANALYSIS: PRE-STERILIZED / READY TO USE CONTAINERS
- 9.1. Chapter Overview
- 9.2. Pre-Sterilized / Ready to Use Containers: Product Competitiveness Analysis
- 9.2.1. Assumptions and Key Parameters
- 9.2.2. Methodology
- 9.2.3. Product Competitiveness Analysis: Vials
- 9.2.4. Product Competitiveness Analysis: Syringes
- 9.2.5. Product Competitiveness Analysis: Bags
- 9.2.6. Product Competitiveness Analysis: Cartridges
10. PRODUCT COMPETITIVENESS ANALYSIS: PRE-STERILIZED / READY TO USE CLOSURES
- 10.1. Chapter Overview
- 10.2. Pre-Sterilized / Ready to Use Closures: Product Competitiveness Analysis
- 10.2.1. Assumptions and Key Parameters
- 10.2.2. Methodology
- 10.2.3. Product Competitiveness Analysis: Stoppers
- 10.2.4. Product Competitiveness Analysis: Plungers
- 10.2.5. Product Competitiveness Analysis: Caps
- 10.2.6. Product Competitiveness Analysis: Tip Caps / Needle Shields
- 10.2.7. Product Competitiveness Analysis: Seals
11. COMPANY PROFILES
- 11.1. Chapter Overview
- 11.2. APG Pharma Packaging
- 11.2.1. Company Overview
- 11.2.2. Product Portfolio
- 11.2.2.1. Ready to Use Closures
- 11.2.3. Recent Developments and Future Outlook
- 11.3. Aptar
- 11.3.1. Company Overview
- 11.3.2. Financial Information
- 11.3.3. Product Portfolio
- 11.3.3.1. Ready to Use Closures
- 11.3.4. Recent Developments and Future Outlook
- 11.4. Daikyo Seiko
- 11.4.1. Company Overview
- 11.4.2. Product Portfolio
- 11.4.2.1. Ready to Use Containers
- 11.4.2.2. Ready to Use Closures
- 11.4.3. Recent Developments and Future Outlook
- 11.5. Datwyler
- 11.5.1. Company Overview
- 11.5.2. Financial Information
- 11.5.3. Product Portfolio
- 11.5.3.1. Ready to Use Closures
- 11.5.4. Recent Developments and Future Outlook
- 11.6. DWK Life Sciences
- 11.6.1. Company Overview
- 11.6.2. Product Portfolio
- 11.6.2.1. Ready to Use Containers
- 11.6.2.2. Ready to Use Closures
- 11.6.3. Recent Developments and Future Outlook
- 11.7. Ningbo Zhengli Pharmaceutical Packaging
- 11.7.1. Company Overview
- 11.7.2. Product Portfolio
- 11.7.2.1. Ready to Use Containers
- 11.7.3. Recent Developments and Future Outlook
- 11.8. SCHOTT
- 11.8.1. Company Overview
- 11.8.2. Financial Information
- 11.8.3. Product Portfolio
- 11.8.3.1. Ready to Use Containers
- 11.8.3.2. Ready to Use Closures
- 11.8.4. Recent Developments and Future Outlook
- 11.9. Stevanato
- 11.9.1. Company Overview
- 11.9.2. Product Portfolio
- 11.9.2.1. Ready to Use Containers
- 11.9.2.2. Ready to Use Closures
- 11.9.3. Recent Developments and Future Outlook
- 11.10. West Pharmaceutical Services
- 11.10.1. Company Overview
- 11.10.2. Financial Information
- 11.10.3. Product Portfolio
- 11.10.3.1. Ready to Use Containers
- 11.10.3.2. Ready to Use Closures
- 11.10.4. Recent Developments and Future Outlook
12. PARTNERSHIPS AND COLLABORATIONS
- 12.1. Chapter Overview
- 12.2. Partnership Models
- 12.3. Pre-Sterilized / Ready to Use Pharmaceutical Packaging: Partnerships and Collaborations
- 12.3.1. Analysis by Year of Partnership
- 12.3.2. Analysis by Type of Partnership
- 12.3.3. Analysis by Year and Type of Partnership
- 12.3.4. Analysis by Type of Partner
- 12.3.5. Analysis by Year of Partnership and Type of Partner
- 12.3.6. Analysis by Type of Partnership and Type of Partner
- 12.3.7. Analysis by Purpose of Partnership
- 12.3.8. Analysis by Type of Packaging System
- 12.3.9. Analysis by Type of Packaging Material
- 12.3.10. Most Active Players: Analysis by Number of Partnerships
- 12.3.11. Analysis by Geography
- 12.3.11.1. Intercontinental and Intracontinental Deals
13. MARKET ENTRY DECISION MAKING FRAMEWORK
- 13.1. Chapter Overview
- 13.2. Key Assumptions and Methodology
- 13.3. Key Parameters Impacting Market Entry Decision Making
- 13.3.1. Product Reach
- 13.3.2. Product Differentiation
- 13.3.3. Market Activity
- 13.3.4. Product Competitiveness
- 13.3.5. Manufacturing Complexity
- 13.4. Concluding Remarks
14. DEMAND ANALYSIS
- 14.1. Chapter Overview
- 14.2. Scope and Methodology
- 14.3. Global Demand for Pre-Sterilized / Ready to Use Pharmaceutical Packaging: Distribution by Type of Container
- 14.3.1. Pre-Sterilized / Ready to Use Vials, Historical Trends (Since 2018) and Forecasted Estimates (Till 2035)
- 14.3.2. Pre-Sterilized / Ready to Use Syringes, Historical Trends (Since 2018) and Forecasted Estimates (Till 2035)
- 14.3.3. Pre-Sterilized / Ready to Use Cartridges, Historical Trends (Since 2018) and Forecasted Estimates (Till 2035)
- 14.4. Global Demand for Pre-Sterilized / Ready to Use Pharmaceutical Packaging: Distribution by Type of Closure
- 14.4.1. Pre-Sterilized / Ready to Use Caps, Historical Trends (Since 2018) and Forecasted Estimates (Till 2035)
- 14.4.2. Pre-Sterilized / Ready to Use Plungers, Historical Trends (Since 2018) and Forecasted Estimates (Till 2035)
- 14.4.3. Pre-Sterilized / Ready to Use Seals, Historical Trends (Since 2018) and Forecasted Estimates (Till 2035)
- 14.4.4. Pre-Sterilized / Ready to Use Stoppers, Historical Trends (Since 2018) and Forecasted Estimates (Till 2035)
- 14.4.5. Pre-Sterilized / Ready to Use Tip Caps / Needle Shields, Historical Trends (Since 2018) and Forecasted Estimates (Till 2035)
- 14.5. Global Demand for Pre-Sterilized / Ready to Use Pharmaceutical Packaging: Distribution by Material of Fabrication
- 14.5.1. Pre-Sterilized / Ready to Use Aluminum Containers and Closures, Historical Trends (Since 2018) and Forecasted Estimates (Till 2035)
- 14.5.2. Pre-Sterilized / Ready to Use Glass Containers and Closures, Historical Trends (Since 2018) and Forecasted Estimates (Till 2035)
- 14.5.3. Pre-Sterilized / Ready to Use Plastic Containers and Closures, Historical Trends (Since 2018) and Forecasted Estimates (Till 2035)
- 14.5.4. Pre-Sterilized / Ready to Use Rubber Containers and Closures, Historical Trends (Since 2018) and Forecasted Estimates (Till 2035)
- 14.6. Global Demand for Pre-Sterilized / Ready to Use Pharmaceutical Packaging: Distribution by Key Geographical Region
- 14.6.1. Pre-Sterilized / Ready to Use Pharmaceutical Packaging in North America, Historical Trends (Since 2018) and Forecasted Estimates (Till 2035)
- 14.6.2. Pre-Sterilized / Ready to Use Pharmaceutical Packaging in Europe, Historical Trends (Since 2018) and Forecasted Estimates (Till 2035)
- 14.6.3. Pre-Sterilized / Ready to Use Pharmaceutical Packaging in Asia, Historical Trends (Since 2018) and Forecasted Estimates (Till 2035)
- 14.6.4. Pre-Sterilized / Ready to Use Pharmaceutical Packaging in Latin America, Historical Trends (Since 2018) and Forecasted Estimates (Till 2035)
- 14.6.5. Pre-Sterilized / Ready to Use Pharmaceutical Packaging in Middle East and North Africa, Historical Trends (Since 2018) and Forecasted Estimates (Till 2035)
- 14.6.6. Pre-Sterilized / Ready to Use Pharmaceutical Packaging in Rest of the World, Historical Trends (Since 2018) and Forecasted Estimates (Till 2035)
15. MARKET IMPACT ANALYSIS: DRIVERS, RESTRAINTS, OPPORTUNITIES AND CHALLENGES
- 15.1. Chapter Overview
- 15.2. Market Drivers
- 15.3. Market Restraints
- 15.4. Market Opportunities
- 15.5. Market Challenges
- 15.6. Conclusion
16. GLOBAL PRE-STERILIZED / READY TO USE PHARMACEUTICAL PACKAGING MARKET
- 16.1. Chapter Overview
- 16.2. Assumptions and Methodology
- 16.3. Global Pre-Sterilized / Ready to Use Pharmaceutical Packaging Market, Historical Trends (Since 2018) and Forecasted Estimates (Till 2035)
- 16.3.1. Scenario Analysis
- 16.3.1.1. Conservative Scenario
- 16.3.1.2. Optimistic Scenario
- 16.3.1. Scenario Analysis
- 16.4. Key Market Segmentations
- 16.5. Dynamic Dashboard
17. PRE-STERILIZED / READY TO USE PHARMACEUTICAL PACKAGING MARKET, BY TYPE OF CONTAINER
- 17.1. Chapter Overview
- 17.2. Key Assumptions and Methodology
- 17.3. Pre-Sterilized / Ready to use Pharmaceutical Packaging Market: Distribution by Type of Container
- 17.3.1. Vials: Historical Trends (Since 2018) and Forecasted Estimates (Till 2035)
- 17.3.2. Syringes: Historical Trends (Since 2018) and Forecasted Estimates (Till 2035)
- 17.3.3. Cartridges: Historical Trends (Since 2018) and Forecasted Estimates (Till 2035)
- 17.4. Data Triangulation and Validation
18. PRE-STERILIZED / READY TO USE PHARMACEUTICAL PACKAGING MARKET, BY TYPE OF CLOSURE
- 18.1. Chapter Overview
- 18.2. Key Assumptions and Methodology
- 18.3. Pre-Sterilized / Ready to Use Pharmaceutical Packaging Market: Distribution by Type of Closure
- 18.3.1. Caps: Historical Trends (Since 2018) and Forecasted Estimates (Till 2035)
- 18.3.2. Plungers: Historical Trends (Since 2018) and Forecasted Estimates (Till 2035)
- 18.3.3. Seals: Historical Trends (Since 2018) and Forecasted Estimates (Till 2035)
- 18.3.4. Stoppers: Historical Trends (Since 2018) and Forecasted Estimates (Till 2035)
- 18.3.5. Tip Caps / Needle Shields: Historical Trends (Since 2018) and Forecasted Estimates (Till 2035)
- 18.4. Data Triangulation and Validation
19. PRE-STERILIZED / READY TO USE PHARMACEUTICAL PACKAGING MARKET, BY MATERIAL OF FABRICATION
- 19.1. Chapter Overview
- 19.2. Key Assumptions and Methodology
- 19.3. Aluminum Containers and Closures: Historical Trends (Since 2018) and Forecasted Estimates (Till 2035)
- 19.4. Glass Containers and Closures: Historical Trends (Since 2018) and Forecasted Estimates (Till 2035)
- 19.5. Plastic Containers and Closures: Historical Trends (Since 2018) and Forecasted Estimates (Till 2035)
- 19.6. Rubber Containers and Closures: Historical Trends (Since 2018) and Forecasted Estimates (Till 2035)
- 19.7. Data Triangulation and Validation
20. PRE-STERILIZED / READY TO USE PHARMACEUTICAL PACKAGING MARKET, BY KEY GEOGRAPHICAL REGION
- 20.1. Chapter Overview
- 20.2. Key Assumptions and Methodology
- 20.3. North America: Historical Trends (Since 2018) and Forecasted Estimates (Till 2035)
- 20.3.1. Pre-Sterilized / Ready to Use Pharmaceutical Packaging Market for Containers
- 20.3.2. Pre-Sterilized / Ready to Use Pharmaceutical Packaging Market for Closures
- 20.4. Europe: Historical Trends (Since 2018) and Forecasted Estimates (Till 2035)
- 20.4.1. Pre-Sterilized / Ready to Use Pharmaceutical Packaging Market for Containers
- 20.4.2. Pre-Sterilized / Ready to Use Pharmaceutical Packaging Market for Closures
- 20.5. Asia: Historical Trends (Since 2018) and Forecasted Estimates (Till 2035)
- 20.5.1. Pre-Sterilized / Ready to Use Pharmaceutical Packaging Market for Containers
- 20.5.2. Pre-Sterilized / Ready to Use Pharmaceutical Packaging Market for Closures
- 20.6. Latin America: Historical Trends (Since 2018) and Forecasted Estimates (Till 2035)
- 20.6.1. Pre-Sterilized / Ready to Use Pharmaceutical Packaging Market for Containers
- 20.6.2. Pre-Sterilized / Ready to Use Pharmaceutical Packaging Market for Closures
- 20.7. Middle East and North Africa: Historical Trends (Since 2018) and Forecasted Estimates (Till 2035)
- 20.7.1. Pre-Sterilized / Ready to Use Pharmaceutical Packaging Market for Containers
- 20.7.2. Pre-Sterilized / Ready to Use Pharmaceutical Packaging Market for Closures
- 20.8. Rest of the World: Historical Trends (Since 2018) and Forecasted Estimates (Till 2035)
- 20.8.1. Pre-Sterilized / Ready to Use Pharmaceutical Packaging Market for Containers
- 20.8.2. Pre-Sterilized / Ready to Use Pharmaceutical Packaging Market for Closures
- 20.9. Data Triangulation and Validation
21. EMERGING TRENDS IN PHARMACEUTICAL PACKAGING
- 21.1. Chapter Overview
- 21.2. Emerging Trends
- 21.2.1. Preference for Self-Medication of Drugs, Through the Use of Modern Drug Delivery Devices
- 21.2.2. Development of Improved Packaging Components and Efforts to Optimize Manufacturing Costs
- 21.2.3. Availability of Modular Facilities
- 21.2.4. Growing Demand and Preference for Personalized Therapies
- 21.2.5. Rise in Provisions for Automating Fill / Finish Operations
- 21.2.6. Surge in Partnership Activity
- 21.2.7. Increase in Initiatives Undertaken by Industry Stakeholders in Developing Regions
- 21.3. Concluding Remarks
22. CASE STUDY: ROBOTICS IN PHARMACEUTICAL PACKAGING
- 22.1. Chapter Overview
- 22.2. Role of Robotics in Pharmaceutical Industry
- 22.2.1. Key Considerations for Selecting a Robotic System
- 22.2.2. Advantages of Robotic Systems
- 22.2.3. Disadvantages of Robotic Systems
- 22.3. Companies Providing Robots for Use in Pharmaceutical Industry
- 22.4. Companies Providing Equipment Integrated Robotic Systems in Pharmaceutical Packaging
- 22.4.1. Aseptic Technologies
- 22.4.1.1. Crystal L1 Robot Line
- 22.4.1.2. Crystal SL1 Robot Line
- 22.4.2. AST
- 22.4.2.1. ASEPTiCELL
- 22.4.2.2. GENiSYS R
- 22.4.2.3. GENiSYS C
- 22.4.2.4. GENiSYS Lab
- 22.4.3. Bosch Packaging Technology
- 22.4.3.1. ATO
- 22.4.4. Dara Pharma
- 22.4.4.1. SYX-E Cartridge + RABS
- 22.4.5. Fedegari
- 22.4.5.1. Fedegari Isolator
- 22.4.6. IMA
- 22.4.6.1. INJECTA
- 22.4.6.2. STERI LIF3
- 22.4.7. Steriline
- 22.4.7.1. Robotic Nest Filling Machine (RNFM)
- 22.4.7.2. Robotic Vial Filling Machine (RVFM)
- 22.4.7.3. Robotic Vial Capping Machine (RVCM)
- 22.4.8. Vanrx Pharmasystems
- 22.4.8.1. Microcell Vial Filler
- 22.4.8.2. SA25 Aseptic Filling Workcell
- 22.4.1. Aseptic Technologies
- 22.5. Concluding Remarks
23. CONCLUSION
- 23.1. Chapter Overview
24. EXECUTIVE INSIGHTS
- 24.1. Chapter Overview
- 24.2. Company A
- 24.2.1. Company Snapshot
- 24.2.2. Interview Transcript: Business Development Specialist
- 24.3. Company B
- 24.3.1. Company Snapshot
- 24.3.2. Interview Transcript: Founder and Managing Director
- 24.4. Company C
- 24.4.1. Company Snapshot
- 24.4.2. Interview Transcript: Business Development and Technology Director
- 24.5. Company D
- 24.5.1. Company Snapshot
- 24.5.2. Interview Transcript: Former Facilitator
- 24.6. Company E
- 24.6.1. Company Snapshot
- 24.6.2. Interview Transcript: Former Project Manager of Business Development
25. APPENDIX 1: TABULATED DATA
26. APPENDIX 2: LIST OF COMPANIES AND ORGANIZATION
List of Tables
- Table 5.1 Compatibility of Polymers with Ethylene Oxide Sterilization
- Table 5.2 Advantages and Disadvantages of Different Sterilization Techniques
- Table 6.1 Pre-Sterilized / Ready to Use Containers: Information on Type of Container, Material(s) of Fabrication, Container Color and Type of Compatible Drug(s)
- Table 6.2 Pre-Sterilized / Ready to Use Containers: Information on Scale of Operation, Packaging Format(s) and Sterilization Technique(s) Used
- Table 6.3 Pre-Sterilized / Ready to Use Containers: Information on Quality Certification(s) Obtained and Target Market
- Table 6.4 Pre-Sterilized / Ready to Use Containers: Information on Availability of Additional Coating and RTU Kits
- Table 6.5 Pre-Sterilized / Ready to Use Containers: List of Manufacturers
- Table 7.1 Pre-Sterilized / Ready to Use Closures: Information on Type of Closure, Material(s) of Fabrication, Type of Compatible Container(s), Type of Compatible Drug(s) and Sterilization Technique(s) Used
- Table 7.2 Pre-Sterilized / Ready to Use Closures: Information on Available Finish Format(s), Quality Certification(s) Obtained and Target Market
- Table 7.3 Pre-Sterilized / Ready to Use Closures: Information on Availability of Additional Coating
- Table 7.4 Pre-Sterilized / Ready to Use Closures: List of Manufacturers
- Table 11.1 Leading Ready to Use Container and Closure Manufacturers
- Table 11.2 APG Pharma Packaging: Company Snapshot
- Table 11.3 APG Pharma Packaging: Ready to Use Closures
- Table 11.4 Aptar: Company Snapshot
- Table 11.5 Aptar: Ready to Use Closures
- Table 11.6 Aptar: Recent Developments and Future Outlook
- Table 11.7 Daikyo Seiko: Company Snapshot
- Table 11.8 Daikyo Seiko: Ready to Use Containers
- Table 11.9 Daikyo Seiko: Ready to Use Closures
- Table 11.10 Datwyler: Company Snapshot
- Table 11.11 Datwyler: Ready to Use Closures
- Table 11.12 Datwyler: Recent Developments and Future Outlook
- Table 11.13 DWK Life Sciences: Company Snapshot
- Table 11.14 DWK Life Sciences: Ready to Use Containers
- Table 11.15 DWK Life Sciences: Ready to Use Closures
- Table 11.16 DWK Life Sciences: Recent Developments and Future Outlook
- Table 11.17 Ningbo Zhengli Pharmaceutical Packaging: Company Snapshot
- Table 11.18 Ningbo Zhengli Pharmaceutical Packaging: Ready to Use Containers
- Table 11.19 Ningbo Zhengli Pharmaceutical Packaging: Recent Developments and Future Outlook
- Table 11.20 SCHOTT: Company Snapshot
- Table 11.21 SCHOTT: Ready to Use Containers
- Table 11.22 SCHOTT: Ready to Use Closures
- Table 11.23 SCHOTT: Recent Developments and Future Outlook
- Table 11.24 Stevanato: Company Snapshot
- Table 11.25 Stevanato: Ready to Use Containers
- Table 11.26 Stevanato: Ready to Use Closures
- Table 11.27 Stevanato: Recent Developments and Future Outlook
- Table 11.28 West Pharmaceutical Services: Company Snapshot
- Table 11.29 West Pharmaceutical Services: Ready to Use Containers
- Table 11.30 West Pharmaceutical Services: Ready to Use Closures
- Table 11.31 West Pharmaceutical Services: Recent Developments and Future Outlook
- Table 12.1 Pre-Sterilized / Ready to Use Containers and Closures: List of Partnerships and Collaborations, Since 2015
- Table 14.1 Global Demand for Pre-Sterilized / Ready to Use Pharmaceutical Packaging: Distribution by Type of Container
- Table 14.2 Global Demand for Pre-Sterilized / Ready to Use Pharmaceutical Packaging: Distribution by Type of Closure
- Table 14.3 Global Demand for Pre-Sterilized / Ready to Use Pharmaceutical Packaging: Distribution by Material of Fabrication
- Table 14.4 Global Demand for Pre-Sterilized / Ready to Use Pharmaceutical Packaging: Distribution by Key Geographical Regions
- Table 16.1 Tiered Pricing Structure for Pre-Sterilized / RTU Pharmaceutical Packaging across Different Geographies
- Table 22.1 List of Pharmaceutical Robotics Manufacturers
- Table 22.2 Aseptic Technologies: Company Overview
- Table 22.3 Aseptic Technologies: Key Specifications of Crystal L1 Robot Line
- Table 22.4 Aseptic Technologies: Key Specifications of Crystal SL1 Robot Line
- Table 22.5 AST: Company Overview
- Table 22.6 AST: Key Specifications of ASEPTiCell
- Table 22.7 AST: Key Specifications of GENiSYS R
- Table 22.8 AST: Key Specifications of GENiSYS C
- Table 22.9 AST: Key Specifications of GENiSYS Lab
- Table 22.10 Bosch Packaging Technology: Company Overview
- Table 22.11 Bosch Packaging Technology: Key Specifications of ATO
- Table 22.12 Dara Pharma: Company Overview
- Table 22.13 Dara Pharma: Key Specifications of SYX-E Cartridge + RABS
- Table 22.14 Fedegari: Company Overview
- Table 22.15 Fedegari: Key Specifications of Fedegari Isolator
- Table 22.16 IMA: Company Overview
- Table 22.17 IMA: Key Specifications of INJECTA
- Table 22.18 IMA: Key Specifications of STERI LIF3
- Table 22.19 Steriline: Company Overview
- Table 22.20 Steriline: Key Specifications of Robotic Nest Filling Machine
- Table 22.21 Steriline: Key Specifications of Robotic Vial Filling Machine
- Table 22.22 Steriline: Key Specifications of Robotic Vial Capping Machine)
- Table 22.23 Vanrx Pharmasystems: Company Overview
- Table 22.24 Vanrx Pharmasystems: Key Specifications of Microcell Vial Filler
- Table 22.25 Key Specifications of SA25 Aseptic Filling Workcell
- Table 24.1 Jinan Youlyy Industrial: Company Snapshot
- Table 24.2 Sagar Rubber: Company Snapshot
- Table 24.3 Aseptic Technologies: Company Snapshot
- Table 24.4 BioPhorum Operations: Company Snapshot
- Table 24.5 PYRAMID Laboratories: Company Snapshot
- Table 25.1 Pre-Sterilized / Ready to Use Containers: Distribution by Type of Container
- Table 25.2 Pre-Sterilized / Ready to Use Containers: Distribution by Material(s) of Fabrication
- Table 25.3 Pre-Sterilized / Ready to Use Containers: Distribution by Container Color
- Table 25.4 Pre-Sterilized / Ready to Use Containers: Distribution by Type of Compatible Drug(s)
- Table 25.5 Pre-Sterilized / Ready to Use Containers: Distribution by Scale of Operation
- Table 25.6 Pre-Sterilized / Ready to Use Containers: Distribution by Packaging Format(s)
- Table 25.7 Pre-Sterilized / Ready to Use Containers: Distribution by Sterilization Technique(s) Used
- Table 25.8 Pre-Sterilized / Ready to Use Containers: Distribution by Quality Certification(s) Obtained
- Table 25.9 Pre-Sterilized / Ready to Use Containers: Distribution by Target Market
- Table 25.10 Pre-Sterilized / Ready to Use Containers: Distribution by Availability of Additional Coating
- Table 25.11 Pre-Sterilized / Ready to Use Containers: Distribution by Availability of RTU Kits
- Table 25.12 Pre-Sterilized / Ready to Use Container Manufacturers: Distribution by Year of Establishment
- Table 25.13 Pre-Sterilized / Ready to Use Container Manufacturers: Distribution by Company Size
- Table 25.14 Pre-Sterilized / Ready to Use Container Manufacturers: Distribution by Location of Headquarters (Region-wise)
- Table 25.15 Pre-Sterilized / Ready to Use Container Manufacturers: Distribution by Location of Headquarters (Country-wise)
- Table 25.16 Leading Manufacturers: Distribution by Number of Products
- Table 25.17 Pre-Sterilized / Ready to Use Closures: Distribution by Type of Closure
- Table 25.18 Pre-Sterilized / Ready to Use Closures: Distribution by Material(s) of Fabrication
- Table 25.19 Pre-Sterilized / Ready to Use Closures: Distribution by Type of Compatible Container(s)
- Table 25.20 Pre-Sterilized / Ready to Use Closures: Distribution by Type of Compatible Drug(s)
- Table 25.21 Pre-Sterilized / Ready to Use Closures: Distribution by Sterilization Technique(s) Used
- Table 25.22 Pre-Sterilized / Ready to Use Closures: Distribution by Available Finish Format(s)
- Table 25.23 Pre-Sterilized / Ready to Use Closures: Distribution by Quality Certification(s) Obtained
- Table 25.24 Pre-Sterilized / Ready to Use Closures: Distribution by Target Market
- Table 25.25 Pre-Sterilized / Ready to Use Closures: Distribution by Availability of Additional Coating
- Table 25.26 Pre-Sterilized / Ready to Use Closure Manufacturers: Distribution by Year of Establishment
- Table 25.27 Pre-Sterilized / Ready to Use Closure Manufacturers: Distribution by Company Size
- Table 25.28 Pre-Sterilized / Ready to Use Closure Manufacturers: Distribution by Location of Headquarters (Region-wise)
- Table 25.29 Pre-Sterilized / Ready to Use Closure Manufacturers: Distribution by Location of Headquarters (Country-wise)
- Table 25.30 Leading Manufacturers: Distribution by Number of Products
- Table 25.31 Key Insights: Distribution by Type of Container and Scale of Operation
- Table 25.32 Key Insights: Distribution by Type of Container and Packaging Format(s)
- Table 25.33 Key Insights: Distribution by Type of Container and Material(s) of Fabrication
- Table 25.34 Key Insights: Distribution by Type of Container and Container Color
- Table 25.35 Key Insights: Distribution by Type of Container and Sterilization Technique(s) Used
- Table 25.36 Key Insights: Distribution by Type of Container and Type of Compatible Drug(s)
- Table 25.37 Key Insights: Distribution by Material(s) of Fabrication and Sterilization Technique(s) Used
- Table 25.38 Key Insights: Distribution by Type of Closure and Material(s) of Fabrication
- Table 25.39 Key Insights: Distribution by Type of Closure and Sterilization Technique(s) Used
- Table 25.40 Key Insights: Distribution by Type of Closure and Available Finish Format(s)
- Table 25.41 Key Insights: Distribution by Type of Closure and Type of Compatible Drug(s)
- Table 25.42 Aptar: Annual Revenues, Since 2016 (USD Billion)
- Table 25.43 Datwyler: Annual Revenues, Since 2016 (CHF Billion)
- Table 25.44 SCHOTT: Annual Revenues, Since 2019 (EUR Billion)
- Table 25.45 West Pharmaceutical Services: Annual Revenues, Since 2018 (USD Billion)
- Table 25.46 Partnerships and Collaborations: Cumulative Year-wise Trend, Since 2015
- Table 25.47 Partnerships and Collaborations: Distribution by Type of Partnership
- Table 25.48 Partnerships and Collaborations: Distribution by Year of Partnership and Type of Partnership
- Table 25.49 Partnerships and Collaborations: Distribution by Type of Partner
- Table 25.50 Partnerships and Collaborations: Distribution by Year of Partnership and Type of Partner, Since 2015
- Table 25.51 Partnerships and Collaborations: Distribution by Type of Partnership and Type of Partner
- Table 25.52 Partnerships and Collaborations: Distribution by Purpose(s) of Partnership
- Table 25.53 Partnerships and Collaborations: Distribution by Type of Packaging System
- Table 25.54 Partnerships and Collaborations: Distribution by Type of Packaging Material
- Table 25.55 Most Active Players: Distribution by Number of Partnerships
- Table 25.56 Partnerships and Collaborations: Local and International Agreements
- Table 25.57 Partnerships and Collaborations: Intercontinental and Intracontinental Agreements
- Table 25.58 Global Demand for Pre-Sterilized / Ready to Use Pharmaceutical Packaging, Till 2035: Distribution by Type of Container
- Table 25.59 Demand for Pre-Sterilized / Ready to Use Vials, Till 2035
- Table 25.60 Demand for Pre-Sterilized / Ready to Use Syringes, Till 2035
- Table 25.61 Demand for Pre-Sterilized / Ready to Use Cartridges, Till 2035
- Table 25.62 Demand for Pre-Sterilized / Ready to Use Pharmaceutical Packaging, Till 2035: Distribution by Type of Closure
- Table 25.63 Demand for Pre-Sterilized / Ready to Use Caps, Till 2035
- Table 25.64 Demand for Pre-Sterilized / Ready to Use Plungers, Till 2035
- Table 25.65 Demand for Pre-Sterilized / Ready to Use Seals, Till 2035
- Table 25.66 Demand for Pre-Sterilized / Ready to Use Stoppers, Till 2035
- Table 25.67 Demand for Pre-Sterilized / Ready to Use Tip Caps / Needle Shields, Till 2035
- Table 25.68 Global Demand for Pre-Sterilized / Ready to Use Pharmaceutical Packaging, Till 2035: Distribution by Material of Fabrication
- Table 25.69 Demand for Pre-Sterilized / Ready to Use Pharmaceutical Packaging for Aluminum Containers and Closures, Till 2035
- Table 25.70 Demand for Pre-Sterilized / Ready to Use Pharmaceutical Packaging for Glass Containers and Closures, Till 2035
- Table 25.71 Demand for Pre-Sterilized / Ready to Use Pharmaceutical Packaging for Plastic Containers and Closures, Till 2035
- Table 25.72 Demand for Pre-Sterilized / Ready to Use Pharmaceutical Packaging for Rubber Containers and Closures, Till 2035
- Table 25.73 Global Demand for Pre-Sterilized / Ready to Use Pharmaceutical Packaging, Till 2035: Distribution by Geography
- Table 25.74 Demand for Pre-Sterilized / Ready to Use Pharmaceutical Packaging in North America, Till 2035
- Table 25.75 Demand for Pre-Sterilized / Ready to Use Pharmaceutical Packaging in Europe, Till 2035
- Table 25.76 Demand for Pre-Sterilized / Ready to Use Pharmaceutical Packaging in Asia, Till 2035
- Table 25.77 Demand for Pre-Sterilized / Ready to Use Pharmaceutical Packaging in Latin America, Till 2035
- Table 25.78 Demand for Pre-Sterilized / Ready to Use Pharmaceutical Packaging in Middle East and North Africa, Till 2035
- Table 25.79 Demand for Pre-Sterilized / Ready to Use Pharmaceutical Packaging in Rest of the World, Till 2035
- Table 25.80 Global Pre-Sterilized / Ready to Use Pharmaceutical Packaging Market, Historical Trends (Since 2018) and Forecasted Estimates (Till 2035)
- Table 25.81 Global Pre-Sterilized / Ready to Use Pharmaceutical Packaging Market, Till 2035: Optimistic Scenario
- Table 25.82 Global Pre-Sterilized / Ready to Use Pharmaceutical Packaging Market, Till 2035: Conservative Scenario
- Table 25.83 Pre-Sterilized / Ready to Use Pharmaceutical Packaging Market for Vials: Historical Trends (Since 2018) and Forecasted Estimates (Till 2035)
- Table 25.84 Pre-Sterilized / Ready to Use Pharmaceutical Packaging Market for Syringes: Historical Trends (Since 2018) and Forecasted Estimates (Till 2035)
- Table 25.85 Pre-Sterilized / Ready to Use Pharmaceutical Packaging Market for Cartridges: Historical Trends (Since 2018) and Forecasted Estimates (Till 2035)
- Table 25.86 Pre-Sterilized / Ready to Use Pharmaceutical Packaging Market for Caps: Historical Trends (Since 2018) and Forecasted Estimates (Till 2035)
- Table 25.87 Pre-Sterilized / Ready to Use Pharmaceutical Packaging Market for Plungers: Historical Trends (Since 2018) and Forecasted Estimates (Till 2035)
- Table 25.88 Pre-Sterilized / Ready to Use Pharmaceutical Packaging Market for Seals: Historical Trends (Since 2018) and Forecasted Estimates (Till 2035)
- Table 25.89 Pre-Sterilized / Ready to Use Pharmaceutical Packaging Market for Stoppers: Historical Trends (Since 2018) and Forecasted Estimates (Till 2035)
- Table 25.90 Pre-Sterilized / Ready to Use Pharmaceutical Packaging Market for Tip Caps / Needle Shields: Historical Trends (Since 2018) and Forecasted Estimates (Till 2035)
- Table 25.91 Pre-Sterilized / Ready to Use Pharmaceutical Packaging Market for Aluminum Containers and Closures: Historical Trends (Since 2018) and Forecasted Estimates (Till 2035)
- Table 25.92 Pre-Sterilized / Ready to Use Pharmaceutical Packaging Market for Glass Containers and Closures: Historical Trends (Since 2018) and Forecasted Estimates (Till 2035)
- Table 25.93 Pre-Sterilized / Ready to Use Pharmaceutical Packaging Market for Plastic Containers and Closures: Historical Trends (Since 2018) and Forecasted Estimates (Till 2035)
- Table 25.94 Pre-Sterilized / Ready to Use Pharmaceutical Packaging Market for Rubber Containers and Closures: Historical Trends (Since 2018) and Forecasted Estimates (Till 2035)
- Table 25.95 Pre-Sterilized / Ready to Use Pharmaceutical Packaging Market in North America: Historical Trends (Since 2018) and Forecasted Estimates (Till 2035)
- Table 25.96 Pre-Sterilized / Ready to Use Pharmaceutical Packaging Market for Containers in North America: Historical Trends (Since 2018) and Forecasted Estimates (Till 2035)
- Table 25.97 Pre-Sterilized / Ready to Use Pharmaceutical Packaging Market for Closures in North America: Historical Trends (Since 2018) and Forecasted Estimates (Till 2035)
- Table 25.98 Pre-Sterilized / Ready to Use Pharmaceutical Packaging Market in Europe: Historical Trends (Since 2018) and Forecasted Estimates (Till 2035)
- Table 25.99 Pre-Sterilized / Ready to Use Pharmaceutical Packaging Market for Containers in Europe: Historical Trends (Since 2018) and Forecasted Estimates (Till 2035)
- Table 25.100 Pre-Sterilized / Ready to Use Pharmaceutical Packaging Market for Closures in Europe: Historical Trends (Since 2018) and Forecasted Estimates (Till 2035)
- Table 25.101 Pre-Sterilized / Ready to Use Pharmaceutical Packaging Market in Asia: Historical Trends (Since 2018) and Forecasted Estimates (Till 2035)
- Table 25.102 Pre-Sterilized / Ready to Use Pharmaceutical Packaging Market for Containers in Asia: Historical Trends (Since 2018) and Forecasted Estimates (Till 2035)
- Table 25.103 Pre-Sterilized / Ready to Use Pharmaceutical Packaging Market for Closures in Asia: Historical Trends (Since 2018) and Forecasted Estimates (Till 2035)
- Table 25.104 Pre-Sterilized / Ready to Use Pharmaceutical Packaging Market in Latin America: Historical Trends (Since 2018) and Forecasted Estimates (Till 2035)
- Table 25.105 Pre-Sterilized / Ready to Use Pharmaceutical Packaging Market for Containers in Latin America: Historical Trends (Since 2018) and Forecasted Estimates (Till 2035)
- Table 25.106 Pre-Sterilized / Ready to Use Pharmaceutical Packaging Market for Closures in Latin America: Historical Trends (Since 2018) and Forecasted Estimates (Till 2035)
- Table 25.107 Pre-Sterilized / Ready to Use Pharmaceutical Packaging Market in Middle East and North Africa: Historical Trends (Since 2018) and Forecasted Estimates (Till 2035)
- Table 25.108 Pre-Sterilized / Ready to Use Pharmaceutical Packaging Market for Containers in Middle East and North Africa: Historical Trends (Since 2018) and Forecasted Estimates (Till 2035)
- Table 25.109 Pre-Sterilized / Ready to Use Pharmaceutical Packaging Market for Closures in Middle East and North Africa: Historical Trends (Since 2018) and Forecasted Estimates (Till 2035)
- Table 25.110 Pre-Sterilized / Ready to Use Pharmaceutical Packaging Market in Rest of the World: Historical Trends (Since 2018) and Forecasted Estimates (Till 2035)
- Table 25.111 Pre-Sterilized / Ready to Use Pharmaceutical Packaging Market for Containers in Rest of the World: Historical Trends (Since 2018) and Forecasted Estimates (Till 2035)
- Table 25.112 Pre-Sterilized / Ready to Use Pharmaceutical Packaging Market for Closures in Rest of the World: Historical Trends (Since 2018) and Forecasted Estimates (Till 2035)
List of Figures
- Figure 2.1 Research Methodology: Research Methodology
- Figure 2.2 Research Methodology: Forecast Methodology
- Figure 2.3 Research Methodology: Robust Quality Control
- Figure 2.4 Research Methodology: Key Market Segmentation
- Figure 4.1 Executive Summary: Pre-Sterilized / Ready to Use Containers Market Landscape
- Figure 4.2 Executive Summary: Pre-Sterilized / Ready to Use Closures Market Landscape
- Figure 4.3 Executive Summary: Partnerships and Collaborations
- Figure 4.4 Executive Summary: Market Entry Decision Making Framework
- Figure 4.5 Executive Summary: Demand Analysis
- Figure 4.6 Executive Summary: Market Sizing and Opportunity Analysis
- Figure 5.1 Advantages of Pharmaceutical Packaging
- Figure 5.2 Type of Pharmaceutical Packaging
- Figure 5.3 Innovation in Pharmaceutical Packaging and Value Chain
- Figure 5.4 Ready to Use Enables Flexible, Flexible Aseptic Processing
- Figure 5.5 Advantages of Ready to Use Platform
- Figure 5.6 Drivers of Ready to Use Platform
- Figure 6.1 Pre-Sterilized / Ready to Use Containers: Distribution by Type of Container
- Figure 6.2 Pre-Sterilized / Ready to Use Containers: Distribution by Material(s) of Fabrication
- Figure 6.3 Pre-Sterilized / Ready to Use Containers: Distribution by Container Color
- Figure 6.4 Pre-Sterilized / Ready to Use Containers: Distribution by Type of Compatible Drug(s)
- Figure 6.5 Pre-Sterilized / Ready to Use Containers: Distribution by Scale of Operation
- Figure 6.6 Pre-Sterilized / Ready to Use Containers: Distribution by Packaging Format(s)
- Figure 6.7 Pre-Sterilized / Ready to Use Containers: Distribution by Sterilization Technique(s) Used
- Figure 6.8 Pre-Sterilized / Ready to Use Containers: Distribution by Quality Certification(s) Obtained
- Figure 6.9 Pre-Sterilized / Ready to Use Containers: Distribution by Target Market
- Figure 6.10 Pre-Sterilized / Ready to Use Containers: Distribution by Availability of Additional Coating
- Figure 6.11 Pre-Sterilized / Ready to Use Containers: Distribution by Availability of RTU Kits
- Figure 6.12 Pre-Sterilized / Ready to Use Container Manufacturers: Distribution by Year of Establishment
- Figure 6.13 Pre-Sterilized / Ready to Use Container Manufacturers: Distribution by Company Size
- Figure 6.14 Pre-Sterilized / Ready to Use Container Manufacturers: Distribution by Location of Headquarters (Region-wise)
- Figure 6.15 Pre-Sterilized / Ready to Use Container Manufacturers: Distribution by Location of Headquarters (Country-wise)
- Figure 6.16 Leading Manufacturers: Distribution by Number of Products
- Figure 7.1 Pre-Sterilized / Ready to Use Closures: Distribution by Type of Closure
- Figure 7.2 Pre-Sterilized / Ready to Use Closures: Distribution by Material(s) of Fabrication
- Figure 7.3 Pre-Sterilized / Ready to Use Closures: Distribution by Type of Compatible Container(s)
- Figure 7.4 Pre-Sterilized / Ready to Use Closures: Distribution by Type of Compatible Drug(s)
- Figure 7.5 Pre-Sterilized / Ready to Use Closures: Distribution by Sterilization Technique(s) Used
- Figure 7.6 Pre-Sterilized / Ready to Use Closures: Distribution by Available Finish Format(s)
- Figure 7.7 Pre-Sterilized / Ready to Use Closures: Distribution by Quality Certification(s) Obtained
- Figure 7.8 Pre-Sterilized / Ready to Use Closures: Distribution by Target Market
- Figure 7.9 Pre-Sterilized / Ready to Use Closures: Distribution by Availability of Additional Coating
- Figure 7.10 Pre-Sterilized / Ready to Use Closure Manufacturers: Distribution by Year of Establishment
- Figure 7.11 Pre-Sterilized / Ready to Use Closure Manufacturers: Distribution by Company Size
- Figure 7.12 Pre-Sterilized / Ready to Use Closure Manufacturers: Distribution by Location of Headquarters (Region-wise)
- Figure 7.13 Pre-Sterilized / Ready to Use Closure Manufacturers: Distribution by Location of Headquarters (Country-wise)
- Figure 7.14 Leading Manufacturers: Distribution by Number of Products
- Figure 8.1 Key Insights: Distribution by Type of Container and Scale of Operation
- Figure 8.2 Key Insights: Distribution by Type of Container and Packaging Format(s)
- Figure 8.3 Key Insights: Distribution by Type of Container and Material(s) of Fabrication
- Figure 8.4 Key Insights: Distribution by Type of Container and Container Color
- Figure 8.5 Key Insights: Distribution by Type of Container and Sterilization Technique(s) Used
- Figure 8.6 Key Insights: Distribution by Type of Container and Type of Compatible Drug(s)
- Figure 8.7 Key Insights: Distribution by Material(s) of Fabrication and Sterilization Technique(s) Used
- Figure 8.8 Key Insights: Distribution by Type of Closure and Material(s) of Fabrication
- Figure 8.9 Key Insights: Distribution by Type of Closure and Sterilization Technique(s) Used
- Figure 8.10 Key Insights: Distribution by Type of Closure and Available Finish Format(s)
- Figure 8.11 Key Insights: Distribution by Type of Closure and Type of Compatible Drug(s)
- Figure 9.1 Product Competitiveness Analysis: Vials
- Figure 9.2 Product Competitiveness Analysis: Syringes
- Figure 9.3 Product Competitiveness Analysis: Bags
- Figure 9.4 Product Competitiveness Analysis: Cartridges
- Figure 10.1 Product Competitiveness Analysis: Stoppers
- Figure 10.2 Product Competitiveness Analysis: Plungers
- Figure 10.3 Product Competitiveness Analysis: Caps
- Figure 10.4 Product Competitiveness Analysis: Tip Caps / Needle Shields
- Figure 10.5 Product Competitiveness Analysis: Seals
- Figure 11.1 Aptar: Annual Revenues, Since 2016 (USD Billion)
- Figure 11.2 Datwyler: Annual Revenues, Since 2016 (CHF Billion)
- Figure 11.3 SCHOTT: Annual Revenues, Since 2016 (EUR Billion)
- Figure 11.4 West Pharmaceutical Services: Annual Revenues, Since 2018 (USD Billion)
- Figure 12.1 Partnerships and Collaborations: Cumulative Year-wise Trend, Since 2015
- Figure 12.2 Partnerships and Collaborations: Distribution by Type of Partnership
- Figure 12.3 Partnerships and Collaborations: Distribution by Year and Type of Partnership
- Figure 12.4 Partnerships and Collaborations: Distribution by Type of Partner
- Figure 12.5 Partnerships and Collaborations: Distribution by Year of Partnership and Type of Partner, Since 2015
- Figure 12.6 Partnerships and Collaborations: Distribution by Type of Partnership and Type of Partner
- Figure 12.7 Partnerships and Collaborations: Distribution by Purpose of Partnership
- Figure 12.8 Partnerships and Collaborations: Distribution by Type of Packaging System
- Figure 12.9 Partnerships and Collaborations: Distribution by Type of Packaging Material
- Figure 12.10 Most Active Players: Distribution by Number of Partnerships
- Figure 12.11 Partnerships and Collaborations: Local and International Agreements
- Figure 12.12 Partnerships and Collaborations: Intercontinental and Intracontinental Agreements
- Figure 13.1 Spider Web Analysis: Product Reach
- Figure 13.2 Spider Web Analysis: Product Differentiation
- Figure 13.3 Spider Web Analysis: Market Activity
- Figure 13.4 Spider Web Analysis: Product Competitiveness
- Figure 13.5 Spider Web Analysis: Manufacturing Complexity
- Figure 13.6 Market Entry Decision Making Framework: Concluding Remarks
- Figure 14.1 Demand for Pre-Sterilized / Ready to Use Vials, Historical Trends (Since 2018) and Forecasted Estimates (Till 2035)
- Figure 14.2 Demand for Pre-Sterilized / Ready to Use Syringes, Historical Trends (Since 2018) and Forecasted Estimates (Till 2035)
- Figure 14.3 Demand for Pre-Sterilized / Ready to Use Cartridges, Historical Trends (Since 2018) and Forecasted Estimates (Till 2035)
- Figure 14.4 Demand for Pre-Sterilized / Ready to Use Caps, Historical Trends (Since 2018) and Forecasted Estimates (Till 2035)
- Figure 14.5 Demand for Pre-Sterilized / Ready to Use Plungers, Historical Trends (Since 2018) and Forecasted Estimates (Till 2035)
- Figure 14.6 Demand for Pre-Sterilized / Ready to Use Seals, Historical Trends (Since 2018) and Forecasted Estimates (Till 2035)
- Figure 14.7 Demand for Pre-Sterilized / Ready to Use Stoppers, Historical Trends (Since 2018) and Forecasted Estimates (Till 2035)
- Figure 14.8 Demand for Pre-Sterilized / Ready to Use Tip Caps / Needle Shields, Historical Trends (Since 2018) and Forecasted Estimates (Till 2035)
- Figure 14.9 Demand for Pre-Sterilized / Ready to Use Aluminum Containers and Closures, Historical Trends (Since 2018) and Forecasted Estimates (Till 2035)
- Figure 14.10 Demand for Pre-Sterilized / Ready to Use Glass Containers and Closures, Historical Trends (Since 2018) and Forecasted Estimates (Till 2035)
- Figure 14.11 Demand for Pre-Sterilized / Ready to Use Plastic Containers and Closures, Historical Trends (Since 2018) and Forecasted Estimates (Till 2035)
- Figure 14.12 Demand for Pre-Sterilized / Ready to Use Rubber Containers and Closures, Historical Trends (Since 2018) and Forecasted Estimates (Till 2035)
- Figure 14.13 Demand for Pre-Sterilized / Ready to Use Pharmaceutical Packaging in North America, Historical Trends (Since 2018) and Forecasted Estimates (Till 2035)
- Figure 14.14 Demand for Pre-Sterilized / Ready to Use Pharmaceutical Packaging in Europe, Historical Trends (Since 2018) and Forecasted Estimates (Till 2035)
- Figure 14.15 Demand for Pre-Sterilized / Ready to Use Pharmaceutical Packaging in Asia, Historical Trends (Since 2018) and Forecasted Estimates (Till 2035)
- Figure 14.16 Demand for Pre-Sterilized / Ready to Use Pharmaceutical Packaging in Latin America, Historical Trends (Since 2018) and Forecasted Estimates (Till 2035)
- Figure 14.17 Demand for Pre-Sterilized / Ready to Use Pharmaceutical Packaging in Middle East and North Africa, Historical Trends (Since 2018) and Forecasted Estimates (Till 2035)
- Figure 14.18 Demand for Pre-Sterilized / Ready to Use Pharmaceutical Packaging in Rest of the World, Historical Trends (Since 2018) and Forecasted Estimates (Till 2035)
- Figure 16.1 Percentage Distribution of Production and Processing Costs for Primary Packaging Components
- Figure 16.2 Global Pre-Sterilized / Ready to Use Pharmaceutical Packaging Market, Historical Trends (Since 2018) and Forecasted Estimates (Till 2035)
- Figure 16.3 Global Pre-Sterilized / Ready to Use Pharmaceutical Packaging Market: Conservative Scenario
- Figure 16.4 Global Pre-Sterilized / Ready to Use Pharmaceutical Packaging Market: Optimistic Scenario
- Figure 16.5 Dynamic Dashboard
- Figure 17.1 Pre-Sterilized / Ready to Use Pharmaceutical Packaging Market: Distribution by Type of Container (USD Billion)
- Figure 17.2 Pre-Sterilized / Ready to Use Pharmaceutical Packaging Market for Vials: Historical Trends (Since 2018) and Forecasted Estimates (Till 2035) (USD Billion)
- Figure 17.3 Pre-Sterilized / Ready to Use Pharmaceutical Packaging Market for Syringes: Historical Trends (Since 2018) and Forecasted Estimates (Till 2035) (USD Billion)
- Figure 17.4 Pre-Sterilized / Ready to Use Pharmaceutical Packaging Market for Cartridges: Historical Trends (Since 2018) and Forecasted Estimates (Till 2035) (USD Billion)
- Figure 18.1 Pre-Sterilized / Ready to Use Pharmaceutical Packaging Market: Distribution by Type of Closure (USD Billion)
- Figure 18.2 Pre-Sterilized / Ready to Use Pharmaceutical Packaging Market for Caps: Historical Trends (Since 2018) and Forecasted Estimates (Till 2035) (USD Billion)
- Figure 18.3 Pre-Sterilized / Ready to Use Pharmaceutical Packaging Market for Plungers: Historical Trends (Since 2018) and Forecasted Estimates (Till 2035) (USD Billion)
- Figure 18.4 Pre-Sterilized / Ready to Use Pharmaceutical Packaging Market for Seals: Historical Trends (Since 2018) and Forecasted Estimates (Till 2035) (USD Billion)
- Figure 18.5 Pre-Sterilized / Ready to Use Pharmaceutical Packaging Market for Stoppers: Historical Trends (Since 2018) and Forecasted Estimates (Till 2035) (USD Billion)
- Figure 18.6 Pre-Sterilized / Ready to Use Pharmaceutical Packaging Market for Tip Caps / Needle Shields: Historical Trends (Since 2018) and Forecasted Estimates (Till 2035) (USD Billion)
- Figure 19.1 Pre-Sterilized / Ready to Use Pharmaceutical Packaging Market for Aluminum Containers and Closures: Historical Trends (Since 2018) and Forecasted Estimates (Till 2035)
- Figure 19.2 Pre-Sterilized / Ready to Use Pharmaceutical Packaging Market for Glass Containers and Closures: Historical Trends (Since 2018) and Forecasted Estimates (Till 2035)
- Figure 19.3 Pre-Sterilized / Ready to Use Pharmaceutical Packaging Market for Plastic Containers and Closures: Historical Trends (Since 2018) and Forecasted Estimates (Till 2035)
- Figure 19.4 Pre-Sterilized / Ready to Use Pharmaceutical Packaging Market for Rubber Containers and Closures: Historical Trends (Since 2018) and Forecasted Estimates (Till 2035)
- Figure 20.1 Pre-Sterilized / Ready to Use Pharmaceutical Packaging Market in North America: Historical Trends (Since 2018) and Forecasted Estimates (Till 2035)
- Figure 20.2 Pre-Sterilized / Ready to Use Pharmaceutical Packaging Market for Containers in North America: Historical Trends (Since 2018) and Forecasted Estimates (Till 2035)
- Figure 20.3 Pre-Sterilized / Ready to Use Pharmaceutical Packaging Market for Closures in North America: Historical Trends (Since 2018) and Forecasted Estimates (Till 2035)
- Figure 20.4 Pre-Sterilized / Ready to Use Pharmaceutical Packaging Market in Europe: Historical Trends (Since 2018) and Forecasted Estimates (Till 2035)
- Figure 20.5 Pre-Sterilized / Ready to Use Pharmaceutical Packaging Market for Containers in Europe: Historical Trends (Since 2018) and Forecasted Estimates (Till 2035)
- Figure 20.6 Pre-Sterilized / Ready to Use Pharmaceutical Packaging Market for Closures in Europe: Historical Trends (Since 2018) and Forecasted Estimates (Till 2035)
- Figure 20.7 Pre-Sterilized / Ready to Use Pharmaceutical Packaging Market in Asia: Historical Trends (Since 2018) and Forecasted Estimates (Till 2035)
- Figure 20.8 Pre-Sterilized / Ready to Use Pharmaceutical Packaging Market for Containers in Asia: Historical Trends (Since 2018) and Forecasted Estimates (Till 2035)
- Figure 20.9 Pre-Sterilized / Ready to Use Pharmaceutical Packaging Market for Closures in Asia: Historical Trends (Since 2018) and Forecasted Estimates (Till 2035)
- Figure 20.10 Pre-Sterilized / Ready to Use Pharmaceutical Packaging Market in Latin America: Historical Trends (Since 2018) and Forecasted Estimates (Till 2035)
- Figure 20.11 Pre-Sterilized / Ready to Use Pharmaceutical Packaging Market for Containers in Latin America: Historical Trends (Since 2018) and Forecasted Estimates (Till 2035)
- Figure 20.12 Pre-Sterilized / Ready to Use Pharmaceutical Packaging Market for Closures in Latin America: Historical Trends (Since 2018) and Forecasted Estimates (Till 2035)
- Figure 20.13 Pre-Sterilized / Ready to Use Pharmaceutical Packaging Market in Middle East and North Africa: Historical Trends (Since 2018) and Forecasted Estimates (Till 2035)
- Figure 20.14 Pre-Sterilized / Ready to Use Pharmaceutical Packaging Market for Containers in Middle East and North Africa: Historical Trends (Since 2018) and Forecasted Estimates (Till 2035)
- Figure 20.15 Pre-Sterilized / Ready to Use Pharmaceutical Packaging Market for Closures in Middle East and North Africa: Historical Trends (Since 2018) and Forecasted Estimates (Till 2035)
- Figure 20.6 Pre-Sterilized / Ready to Use Pharmaceutical Packaging Market in Rest of the World: Historical Trends (Since 2018) and Forecasted Estimates (Till 2035)
- Figure 20.17 Pre-Sterilized / Ready to Use Pharmaceutical Packaging Market for Containers in Rest of the World: Historical Trends (Since 2018) and Forecasted Estimates (Till 2035)
- Figure 20.18 Pre-Sterilized / Ready to Use Pharmaceutical Packaging Market for Closures in Rest of the World: Historical Trends (Since 2018) and Forecasted Estimates (Till 2035)
- Figure 21.1 Emerging Trends in Pharmaceutical Packaging
- Figure 21.2 Future Growth Opportunities for Ready to Use Containers and Closures Based on Recent Trends
- Figure 22.1 Key Considerations for Selecting a Robotic System
- Figure 22.2 Pharmaceutical Manufacturing: Advantages of Robotic Systems
- Figure 22.3 Pharmaceutical Manufacturing: Disadvantages of Robotic Systems
- Figure 23.1 Concluding Remarks: Pre-Sterilized / Ready to Use Containers Market Landscape
- Figure 23.2 Concluding Remarks: Pre-Sterilized / Ready to Use Closures Market Landscape
- Figure 23.3 Concluding Remarks: Partnerships and Collaborations
- Figure 23.4 Concluding Remarks: Market Entry Decision Making Framework
- Figure 23.5 Concluding Remarks: Demand Analysis
- Figure 23.6 Concluding Remarks: Market Forecast
 抗体合约製造市场:产业趋势及2035年全球预测 - 各製造抗体类型,各使用表现系统类型,各产业规模,各地区
 全球医疗CMO市场(2025年版)
 全球製药契约製造市场(至 2030 年):按服务(药物开发、製药(原料药、FDF - 肠外给药、片剂、胶囊)、生技药品(原料药、FDF)、包装和标籤、填充完成)和分子(小型、大型(ADC、CGT))
 量子运算的 ADC 和 DAC 市场规模、份额和趋势分析报告:按类型、架构、量子位元类型、应用层、地区和细分市场预测,2025-2030 年
 契约製造市场按服务类型、产品、技术、用户类型和最终用户产业划分-2025-2030 年全球预测生物製药契约製造市场(按服务类型、产品类型、生产阶段、应用和组织规模)—2025-2030 年全球预测脂质CMO市场:产业趋势及全球预测 - 依脂质类型、公司规模、业务规模和主要地区抗体受託製造的全球市场,规模,占有率,趋势,产业分析报告:各产品,来历,各治疗领域,各终端用户,各地区 - 市场预测,2025年~2034年
 製药和生物製药合约製造市场-全球产业规模、份额、趋势、机会和预测(按产品类型、服务、地区和竞争细分,2020-2030 年)
 契约製造:全球市场(~2030 年)