


 |
市场调查报告书
商品编码
1993583
碳足迹管理市场:依产品、部署方式、企业规模、最终用户产业及地区划分:产业趋势及全球预测(至 2035 年)Carbon Footprint Management Market: Distribution by Type of Offering, Deployment Mode, Type of Enterprise, End-use Industry, and Geographical Regions: Industry Trends and Global Forecasts, Till 2035 |
||||||
碳足迹管理市场展望
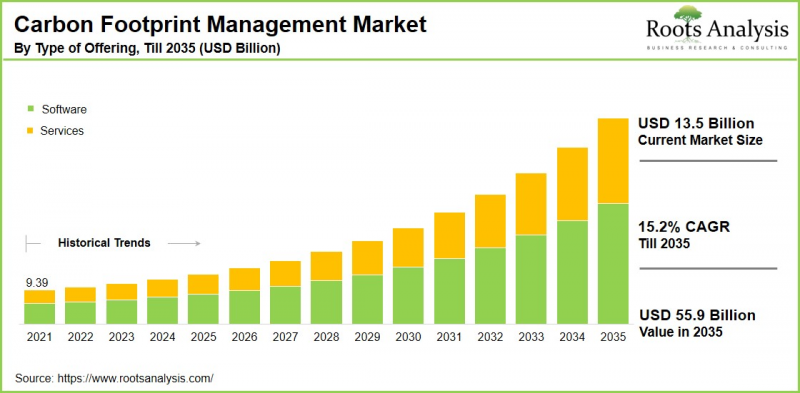
预计到 2035 年,全球碳足迹管理市场将以 15.2% 的复合年增长率成长,从目前的 135 亿美元成长至 559 亿美元。
碳足迹是对温室气体排放量的量化衡量,以二氧化碳当量表示,这些排放量由一项活动、流程或产品直接或间接产生。这些排放来自多种来源,包括能源消耗、工业生产、运输系统和废弃物管理实践。碳足迹管理透过系统性地测量、减少和抵消排放,最大限度地减少对环境的影响,在应对气候变迁方面发挥至关重要的作用。
这种系统性方法需要关键利害关係人(尤其是企业)的积极参与,具体策略包括碳足迹评估、源头减量以及参与碳抵销计画。近年来,在监管措施的强化支持下,碳足迹管理已成为全球永续发展工作的核心要素,世界各国政府都在实施气候变迁减缓政策,以实现净零排放目标。从经济角度来看,由于提高能源效率和减少浪费可以降低成本等实际利益,各组织扩大采用有效的碳管理措施。
预计这些环境和经济因素的综合作用将在预测期内显着推动市场成长。
高阶主管策略洞察
推动碳足迹管理市场成长的关键因素
推动全球碳足迹管理市场成长的关键因素之一是政府主导的旨在减少碳排放的各项举措的日益普及。这些举措包括碳信用交易机制(CCTS),该机制对碳排放定价,以帮助遏制温室气体排放。此外,各行各业扩大采用净零排放目标,显着增加了对先进技术的需求。再加上企业内部永续发展目标的提高和投资者的密切关注,使得准确的碳足迹追踪和报告成为可能。此外,环境、社会和治理 (ESG) 标准日益重要,进一步推动了市场扩张。投资人越来越青睐那些展现出卓越环境绩效和透明永续发展实践的企业。
碳足迹管理市场 - 产业竞争格局
当前市场格局的特点是,众多规模各异的企业并存,它们拥有跨多个地区提供解决方案和服务所需的技术专长和营运能力。其中,大多数企业 (45%) 提供基于云端的碳足迹管理解决方案。另一方面,提供本地部署解决方案的企业比例相对较小,约 4%。主要的云端解决方案提供者包括 AiDASH、Carbon Footprint、Cority、Diligent 和 Envirosoft。
此外,市场上的小型新进业者正积极拓展产品组合,以满足细分市场需求,并抓住各产业领域尚未开发的机会。 Carbon Analytics、Carbon Footprint、Carbon Upcycling Technologies、Envirosoft、ESP 和 Green Sutra 等公司正专注于创新,并提供针对性的解决方案以增强其竞争优势。
不断发展的碳足迹管理—产业新趋势
碳足迹管理市场的新趋势包括人工智慧 (AI)、机器学习和物联网 (IoT) 等先进技术的加速应用。这些技术能够实现对碳排放的即时监测和预测。这些创新正在将传统的碳排放追踪转变为数据驱动的决策支援系统,从而提高营运效率和合规性。另一个关键趋势是向基于云端的整合平台转型,这些平台提供可扩展性、集中式仪表板和自动化温室气体 (GHG) 运算功能。这些平台有助于企业遵守日益严格的监管要求和全球揭露标准。
此外,随着企业加强其 ESG 承诺并增加永续发展报告义务,企业正在将碳管理纳入更广泛的永续发展策略中。
区域分析:欧洲引领碳足迹管理市场
根据我们的分析,欧洲今年占了碳足迹管理市场最大的占有率。这主要归功于其全面而严格的监管环境,该环境要求企业测量、揭露并减少温室气体排放。诸如 "欧洲绿色协议" 和 "企业永续发展报告指令" (CSRD)等强有力的政策框架,正在製定必要的合规要求,从而推动各行业对先进的碳核算和管理解决方案的需求。此外,政府的大力支持、对绿色技术的大量公共资金投入以及欧洲消费者日益增强的环保意识,都在促进这些解决方案的普及。
碳足迹管理市场的主要挑战
阻碍碳足迹管理普及的主要挑战包括缺乏标准化的研究方法和一致的排放报告架构。这导致不同地区和行业之间的温室气体数据存在差异且缺乏可比性,使基准测试和监管合规工作变得更加复杂。 此外,许多组织在收集和整合准确数据方面面临挑战,尤其是在复杂的供应链中收集和整合范围 3 排放数据时。造成这项挑战的原因包括供应商报告不一致、系统碎片化以及数位基础设施不足,这些因素都削弱了碳清单的可靠性。此外,缺乏具备碳核算专业知识的熟练人员以及不断变化的监管环境也增加了合规和策略规划的复杂性。
碳足迹管理市场 - 主要市场区隔
产品类型
- 软体
- 服务
部署方式
- 云端部署
- 本地部署
企业规模
- 小型企业
- 中型企业
- 大型企业
终端用户产业
- 能源和公用事业 製造业 住宅及商业建筑 运输和物流 农业 其他
地区
- 北美 美国 加拿大 墨西哥 其他北美地区国家/地区
- 欧洲 奥地利 比利时 丹麦 法国 德国 爱尔兰 义大利 荷兰
- 挪威
- 俄罗斯
- 西班牙
- 瑞典
- 瑞士
- 英国
- 其他欧洲国家
- 亚洲
- 中国
- 印度
- 日本
- 新加坡
- 韩国
- 其他亚洲国家
- 拉丁美洲
- 巴西
- 智利
- 哥伦比亚
- 委内瑞拉
- 其他拉丁美洲国家
- 中东和北非
- 埃及
- 伊朗
- 伊拉克
- 以色列
- 科威特
- 沙乌地阿拉伯
- 阿联酋
- 其他中东和北非国家国家
- 世界其他地区
- 澳大利亚
- 纽西兰
- 其他国家/地区
碳足迹管理市场主要公司
- Carbon Footprint
- Carbon Trust
- Diligent
- EcoAct
- EnergyCAP
- ENGIE Impact
- Envirosoft
- ESP
- Optimum Energy
- SAP
- GreenSutra
碳足迹管理市场 - 报告范围
本碳足迹管理市场报告深入分析以下几个面向:
- 市场规模与机会分析:对碳足迹管理市场进行详细分析,重点在于以下关键市场细分:[A] 产品形式,[B] 部署形式,[C] 公司类型,[D] 最终用户产业,以及 [E]区域
- 竞争格局:基于相关参数(例如[A]成立年份、[B]公司规模、[C]总部所在地和[D]所有权结构)对进入碳足迹管理市场的公司进行全面分析。
- 公司简介:对进入碳足迹管理市场的主要公司进行详细介绍。本文檔提供以下方面的详细资讯:[A]总部所在地、[B]公司规模、[C]企业理念、[D]业务规模、[E]管理团队、[F]联络资讯、[G]财务资讯、[H]业务板块、[I]产品和技术组合、[J]近期发展和未来展望。
- 大趋势:对碳足迹管理产业当前大趋势的评估。
- 专利分析:基于相关参数(例如[A]专利类型、[B]专利公开年份、[C]专利年龄和[D]主要参与者)对碳足迹管理领域已提交和已註册的专利进行深入分析。
- 近期发展:概述碳足迹管理市场近期发展情况,并基于以下相关参数进行分析:[A] 实施年限,[B] 专案类型,[C] 地域分布,以及 [D] 最活跃的进入者。
- 波特五力分析:分析碳足迹管理市场五大主要竞争因素(新进业者的威胁、买方议价能力、供应商议价能力、替代品的威胁、以及现有竞争对手之间的竞争)。
- SWOT 分析:深入剖析特定领域的优势、劣势、机会和威胁的 SWOT 框架。此外,哈维鲍尔分析强调了每个 SWOT 参数的相对影响。我们也提供这项服务。
目录
第一章:专案概述
第二章:研究方法
第三章:市场动态
第四章:宏观经济指标
- 章节总结
- 市场动态
- 结论
第五章:摘要整理
第六章:引言
- 碳足迹管理概述
- 碳排放/碳足迹的构成要素
- 未来趋势
第七章:供应链分析
- 流程概述利害关係人
- 碳足迹管理流程示意图
- 主要挑战和缓解措施
第八章 监理环境
- 国际和国内监管机构
第九章:碳足迹管理市场 - 主要参与者
- 研究方法与关键参数
- 依成立年份分析
- 依公司规模分析
- 依总部所在地分析
- 依公司类型分析
- 以交付方式分析
- 依公司类型和产品类型分析
- 依部署模式分析
第十章:公司竞争分析
- 研究方法与评分标准
- 主要参与者比较:2x2矩阵
- 主要参与者
第十一章 新创企业生态系分析
- 研究方法与关键参数
- 依成立年份分析
- 依公司规模分析
- 依总部所在地分析
- 依公司类型分析
- 以交付方式分析
- 依部署方式分析
- 依总部所在地分析碳足迹管理解决方案提供商
- 以公司规模分析云端碳足迹管理解决方案供应商
第十二章 公司简介
- 概述
- 碳足迹
- 碳信赖
- 勤勉
- EcoAct
- EnergyCAP
- ENGIE Impact
- Optimum Energy
- SAP
- Envirosoft
- GreenSutra
- ESP
第十三章 大趋势
- 气候变迁法规与净零排放目标
- 技术进步
- 企业脱碳策略
- 以永续发展为中心的消费者需求
- 健全的监理框架
- 将碳管理融入商业策略
第十四章 未满足的需求
- 缺乏碳核算知识
- 定义排放边界
- 资料收集
- 资料验证与准确性
- 标准化与资料一致性
- 后期成果
- 科技与基础设施
- 价格波动
第15章 碳足迹管理:关键策略
- 聚焦再生能源
- 提高能源效率
- 供应链优化
- 减少浪费
- 永续交通策略
- 碳中和农业
- 温室气体减量方案
- 净零排放航空
第16章 专利分析
- 研究范围与方法
- 关键参数
- 碳足迹管理:专利分析
第17章 全球碳足迹管理市场
- 关键假设与研究方法
- 全球碳足迹管理市场 - 历史趋势(2021-2021)与预测(2035)
- 情境分析
- 主要市场细分
第18章 依产品类型划分的市场机会
第19章 依部署方式划分的市场机会
第20章 依业务类型划分的市场机会
第21章 依最终用户产业划分的市场机会
第22章 依地区划分的市场机会
第23章 来自一手研究的洞察
第24章 结论
第25章 附录一:表格数据
第26章 附录二、公司与组织清单
Carbon Footprint Management Market Outlook
As per Roots Analysis, the global carbon footprint management market size is estimated to grow from USD 13.5 billion in current year to USD 55.9 billion by 2035, at a CAGR of 15.2% during the forecast period, till 2035.
Carbon footprint represents the quantification of greenhouse gas emissions, measured in carbon dioxide equivalent, generated directly or indirectly by activities, processes, or products. These emissions arise from a wide range of sources, including energy usage, industrial manufacturing, transportation systems, and waste management practices. Carbon footprint management focuses on systematically measuring, reducing, and offsetting emissions to minimize their environmental impact and plays a critical role in addressing climate change.
This structured approach actively involves key stakeholders, particularly businesses, through strategies such as carbon footprint assessment, emission reduction at the source, and participation in carbon offset initiatives. In recent years, carbon footprint management has emerged as a core component of global sustainability efforts, supported by increasing regulatory action as governments worldwide implement climate mitigation policies to achieve net-zero targets. From an economic standpoint, organizations are increasingly adopting robust carbon management practices due to tangible benefits, including cost savings driven by improved energy efficiency and reduced waste.
Collectively, these environmental and economic drivers are expected to significantly propel market growth over the forecast period.
Strategic Insights for Senior Leaders
Key Drivers Propelling Growth of Carbon Footprint Management Market
One of the primary drivers accelerating the growth of the global carbon footprint management market is the increasing implementation of government initiatives aimed at reducing carbon emissions. These initiatives include mechanisms such as carbon credit trading schemes (CCTS), which price carbon to help curb greenhouse gas emissions. Further, the growing adoption of net-zero commitments across multiple industries has significantly increased the demand for advanced technologies. This enables accurate carbon footprint tracking and reporting, driven by both internal sustainability objectives and heightened scrutiny from investors. Moreover, the rising prominence of environmental, social, and governance (ESG) criteria is further supporting market expansion, as investors are increasingly favoring organizations demonstrating strong environmental performance and transparent sustainability practices.
Carbon Footprint Management Market: Competitive Landscape of Companies in this Industry
The current market landscape is characterized by the presence of both small and large companies with technical expertise and operational capabilities to deliver solutions and services across multiple regions. Notably, majority of the companies (45%) offer cloud-based carbon footprint management solutions. However, a comparatively small share, approximately 4%, provides on-premise offerings; notable providers of cloud-based solutions include AiDASH, Carbon Footprint, Cority, Diligent, and Envirosoft.
Further, small players in the market are actively enhancing their portfolios to address niche requirements and capitalize on untapped opportunities across diverse industry verticals. Companies such as Carbon Analytics, Carbon Footprint, Carbon Upcycling Technologies, Envirosoft, ESP, and Green Sutra are focusing on innovation and providing targeted solutions to strengthen their competitive positioning.
Carbon Footprint Management Evolution: Emerging Trends in the Industry
Emerging trends in the carbon footprint management market include the accelerated adoption of advanced technologies, such as artificial intelligence (AI), machine learning, the Internet of Things (IoT), which are enabling real-time emissions monitoring, and forecasting of carbon outputs. These innovations are transforming traditional carbon tracking into data-driven decision support systems that enhance operational efficiency and compliance. Another important trend is the shift toward cloud-based and integrated platforms that offer scalability, centralized dashboards, and automated greenhouse gas (GHG) accounting. These platforms help organizations comply with increasingly stringent regulatory requirements and global disclosure standards.
Additionally, heightened corporate ESG commitments and sustainability reporting obligations are driving enterprises to integrate carbon management into broader sustainability strategies.
Regional Analysis: Europe Leads the Carbon Footprint Management Market
According to our analysis, in the current year, the carbon footprint management market in Europe captures the largest share. This is due to due to its comprehensive and stringent regulatory environment, which compels organizations to measure, disclose, and reduce greenhouse gas emissions. Robust policy frameworks such as the European Green Deal, the Corporate Sustainability Reporting Directive (CSRD), have created mandatory compliance requirements that drive demand for advanced carbon accounting and management solutions across industries. Further, strong governmental support, substantial public funding for green technologies, and rising environmental awareness among European consumers is driving the adoption of such solutions.
Key Challenges in Carbon Footprint Management Market
Key challenges hindering the adoption of carbon footprint management include lack of standardized methodologies and consistent emissions reporting frameworks. This results in variability and limited comparability of greenhouse gas data across regions and industries, thereby complicating benchmarking and regulatory compliance efforts. Additionally, many organizations struggle with accurate data collection and integration, particularly for Scope 3 emissions across complex supply chains. This challenge is driven by inconsistent supplier reporting, fragmented systems, and insufficient digital infrastructure, which undermines the reliability of carbon inventories. Furthermore, there is a shortage of skilled professionals with expertise in carbon accounting and an evolving regulatory landscape that adds complexity to compliance and strategic planning.
Carbon Footprint Management Market: Key Market Segmentation
Type of Offering
- Software
- Service
Deployment Mode
- Cloud-based
- On-premises
Type of Enterprise
- Small Companies
- Mid-sized Companies
- Large Companies
End Use Industry
- Energy Utilities
- Manufacturing Industry
- Residential and Commercial Buildings
- Transportation and Logistics
- Agriculture Industry
- Other Industries
Geographical Regions
- North America
- US
- Canada
- Mexico
- Other North American countries
- Europe
- Austria
- Belgium
- Denmark
- France
- Germany
- Ireland
- Italy
- Netherlands
- Norway
- Russia
- Spain
- Sweden
- Switzerland
- UK
- Other European countries
- Asia
- China
- India
- Japan
- Singapore
- South Korea
- Other Asian countries
- Latin America
- Brazil
- Chile
- Colombia
- Venezuela
- Other Latin American countries
- Middle East and North Africa
- Egypt
- Iran
- Iraq
- Israel
- Kuwait
- Saudi Arabia
- UAE
- Other MENA countries
- Rest of the World
- Australia
- New Zealand
- Other countries
Example Players in Carbon Footprint Management Market
- Carbon Footprint
- Carbon Trust
- Diligent
- EcoAct
- EnergyCAP
- ENGIE Impact
- Envirosoft
- ESP
- Optimum Energy
- SAP
- GreenSutra
Carbon Footprint Management Market: Report Coverage
The report on the carbon footprint management market features insights on various sections, including:
- Market Sizing and Opportunity Analysis: An in-depth analysis of the carbon footprint management market, focusing on key market segments, including [A] type of offering, [B] deployment mode, [C] type of enterprise, [D] end-use industry, and [E] geographical regions.
- Competitive Landscape: A comprehensive analysis of the companies engaged in the carbon footprint management market, based on several relevant parameters, such as [A] year of establishment, [B] company size, [C] location of headquarters and [D] ownership structure.
- Company Profiles: Elaborate profiles of prominent players engaged in the carbon footprint management market, providing details on [A] location of headquarters, [B] company size, [C] company mission, [D] company footprint, [E] management team, [F] contact details, [G] financial information, [H] operating business segments, [I] product / technology portfolio, [J] recent developments, and an informed future outlook.
- Megatrends: An evaluation of ongoing megatrends in the carbon footprint management industry.
- Patent Analysis: An insightful analysis of patents filed / granted in the carbon footprint management domain, based on relevant parameters, including [A] type of patent, [B] patent publication year, [C] patent age and [D] leading players.
- Recent Developments: An overview of the recent developments made in the carbon footprint management market, along with analysis based on relevant parameters, including [A] year of initiative, [B] type of initiative, [C] geographical distribution and [D] most active players.
- Porter's Five Forces Analysis: An analysis of five competitive forces prevailing in the carbon footprint management market, including threats of new entrants, bargaining power of buyers, bargaining power of suppliers, threats of substitute products and rivalry among existing competitors.
- SWOT Analysis: An insightful SWOT framework, highlighting the strengths, weaknesses, opportunities and threats in the domain. Additionally, it provides Harvey ball analysis, highlighting the relative impact of each SWOT parameter.
Key Questions Answered in this Report
- What is the current and future market size?
- Who are the leading companies in this market?
- What are the growth drivers that are likely to influence the evolution of this market?
- What are the key partnership and funding trends shaping this industry?
- Which region is likely to grow at higher CAGR till 2035?
- How is the current and future market opportunity likely to be distributed across key market segments?
Reasons to Buy this Report
- Detailed Market Analysis: The report provides a comprehensive market analysis, offering detailed revenue projections of the overall market and its specific sub-segments. This information is valuable to both established market leaders and emerging entrants.
- In-depth Analysis of Trends: Stakeholders can leverage the report to gain a deeper understanding of the competitive dynamics within the market. Each report maps ecosystem activity across partnerships, funding, and patent landscapes to reveal growth hotspots and white spaces in the industry.
- Opinion of Industry Experts: The report features extensive interviews and surveys with key opinion leaders and industry experts to validate market trends mentioned in the report.
- Decision-ready Deliverables: The report offers stakeholders with strategic frameworks (Porter's Five Forces, value chain, SWOT), and complimentary Excel / slide packs with customization support.
Additional Benefits
- Complimentary Dynamic Excel Dashboards for Analytical Modules
- Exclusive 15% Free Content Customization
- Personalized Interactive Report Walkthrough with Our Expert Research Team
- Free Report Updates for Versions Older than 6-12 Months
TABLE OF CONTENTS
1. PROJECT OVERVIEW
- 1.1. Context
- 1.2. Project Objectives
2. RESEARCH METHODOLOGY
- 2.1. Chapter Overview
- 2.2. Research Assumptions
- 2.2.1. Market Landscape and Market Trends
- 2.2.2. Market Forecast and Opportunity Analysis
- 2.2.3. Comparative Analysis
- 2.3. Database Building
- 2.3.1. Data Collection
- 2.3.2. Data Validation
- 2.3.3. Data Analysis
- 2.4. Project Methodology
- 2.4.1. Secondary Research
- 2.4.1.1. Annual Reports
- 2.4.1.2. Academic Research Papers
- 2.4.1.3. Company Websites
- 2.4.1.4. Investor Presentations
- 2.4.1.5. Regulatory Filings
- 2.4.1.6. White Papers
- 2.4.1.7. Industry Publications
- 2.4.1.8. Conferences and Seminars
- 2.4.1.9. Government Portals
- 2.4.1.10. Media and Press Releases
- 2.4.1.11. Newsletters
- 2.4.1.12. Industry Databases
- 2.4.1.13. Roots Proprietary Databases
- 2.4.1.14. Paid Databases and Sources
- 2.4.1.15. Social Media Portals
- 2.4.1.16. Other Secondary Sources
- 2.4.2. Primary Research
- 2.4.2.1. Types of Primary Research
- 2.4.2.1.1. Qualitative Research
- 2.4.2.1.2. Quantitative Research
- 2.4.2.1.3. Hybrid Approach
- 2.4.2.2. Advantages of Primary Research
- 2.4.2.3. Techniques for Primary Research
- 2.4.2.3.1. Interviews
- 2.4.2.3.2. Surveys
- 2.4.2.3.3. Focus Groups
- 2.4.2.3.4. Observational Research
- 2.4.2.3.5. Social Media Interactions
- 2.4.2.4. Key Opinion Leaders Considered in Primary Research
- 2.4.2.4.1. Company Executives (CXOs)
- 2.4.2.4.2. Board of Directors
- 2.4.2.4.3. Company Presidents and Vice Presidents
- 2.4.2.4.4. Research and Development Heads
- 2.4.2.4.5. Technical Experts
- 2.4.2.4.6. Subject Matter Experts
- 2.4.2.4.7. Scientists
- 2.4.2.4.8. Doctors and Other Healthcare Providers
- 2.4.2.5. Ethics and Integrity
- 2.4.2.5.1. Research Ethics
- 2.4.2.5.2. Data Integrity
- 2.4.2.1. Types of Primary Research
- 2.4.3. Analytical Tools and Databases
- 2.4.1. Secondary Research
- 2.5. Robust Quality Control
3. MARKET DYNAMICS
- 3.1. Chapter Overview
- 3.2. Forecast Methodology
- 3.2.1. Top-down Approach
- 3.2.2. Bottom-up Approach
- 3.2.3. Hybrid Approach
- 3.3. Market Assessment Framework
- 3.3.1. Total Addressable Market (TAM)
- 3.3.2. Serviceable Addressable Market (SAM)
- 3.3.3. Serviceable Obtainable Market (SOM)
- 3.3.4. Currently Acquired Market (CAM)
- 3.4. Forecasting Tools and Techniques
- 3.4.1. Qualitative Forecasting
- 3.4.2. Correlation
- 3.4.3. Regression
- 3.4.4. Extrapolation
- 3.4.5. Convergence
- 3.4.6. Sensitivity Analysis
- 3.4.7. Scenario Planning
- 3.4.8. Data Visualization
- 3.4.9. Time Series Analysis
- 3.4.10. Forecast Error Analysis
- 3.5. Key Considerations
- 3.5.1. Demographics
- 3.5.2. Government Regulations
- 3.5.3. Reimbursement Scenarios
- 3.5.4. Market Access
- 3.5.5. Supply Chain
- 3.5.6. Industry Consolidation
- 3.5.7. Pandemic / Unforeseen Disruptions Impact
- 3.6. Limitations
4. MACRO-ECONOMIC INDICATORS
- 4.1. Chapter Overview
- 4.2. Market Dynamics
- 4.2.1. Time Period
- 4.2.1.1. Historical Trends
- 4.2.1.2. Current and Forecasted Estimates
- 4.2.2. Currency Coverage
- 4.2.2.1. Major Currencies Affecting the Market
- 4.2.2.2. Factors Affecting Currency Fluctuations
- 4.2.2.3. Impact of Currency Fluctuations on the Industry
- 4.2.3. Foreign Currency Exchange Rate
- 4.2.3.1. Impact of Foreign Exchange Rate Volatility on the Market
- 4.2.3.2. Strategies for Mitigating Foreign Exchange Risk
- 4.2.4. Recession
- 4.2.4.1. Assessment of Current Economic Conditions and Potential Impact on the Market
- 4.2.4.2. Historical Analysis of Past Recessions and Lessons Learnt
- 4.2.5. Inflation
- 4.2.5.1. Measurement and Analysis of Inflationary Pressures in the Economy
- 4.2.5.2. Potential Impact of Inflation on the Market Evolution
- 4.2.6. Interest Rates
- 4.2.6.1. Interest Rates and Their Impact on the Market
- 4.2.6.2. Strategies for Managing Interest Rate Risk
- 4.2.7. Commodity Flow Analysis
- 4.2.7.1. Type of Commodity
- 4.2.7.2. Origins and Destinations
- 4.2.7.3. Values and Weights
- 4.2.7.4. Modes of Transportation
- 4.2.8. Global Trade Dynamics
- 4.2.8.1. Import Scenario
- 4.2.8.2. Export Scenario
- 4.2.8.3. Trade Policies
- 4.2.8.4. Strategies for Mitigating the Risks Associated with Trade Barriers
- 4.2.8.5. Impact of Trade Barriers on the Market
- 4.2.9. War Impact Analysis
- 4.2.9.1. Russian-Ukraine War
- 4.2.9.2. Israel-Hamas War
- 4.2.10. COVID Impact / Related Factors
- 4.2.10.1. Global Economic Impact
- 4.2.10.2. Industry-specific Impact
- 4.2.10.3. Government Response and Stimulus Measures
- 4.2.10.4. Future Outlook and Adaptation Strategies
- 4.2.11. Other Indicators
- 4.2.11.1. Fiscal Policy
- 4.2.11.2. Consumer Spending
- 4.2.11.3. Gross Domestic Product (GDP)
- 4.2.11.4. Employment
- 4.2.11.5. Taxes
- 4.2.11.6. Stock Market Performance
- 4.2.11.7. Cross-Border Dynamics
- 4.2.1. Time Period
- 4.3. Conclusion
5. EXECUTIVE SUMMARY
6. INTRODUCTION
- 6.1. Overview of Carbon Footprint Management
- 6.2. Components Contributing to Carbon Emission / Footprint
- 6.3. Future Trends
7. SUPPLY CHAIN ANALYSIS
- 7.1. Brief Overview of Processes and Stakeholders Involved
- 7.2. Schematic Representation of Carbon Footprint Management Process
- 7.3. Key Challenges and Mitigation Strategies
8. REGULATORY SCENARIO
- 8.1. International and National Regulatory Authorities
9. CARBON FOOTPRINT MANAGEMENT MARKET: LEADING PLAYERS
- 9.1. Methodology and Key Parameters
- 9.2. Analysis by Year of Establishment
- 9.3. Analysis by Company Size
- 9.4. Analysis by Location of Headquarters \
- 9.5. Analysis by Type of Company
- 9.6. Analysis by Type of Offering
- 9.7. Analysis by Type of Company and Type of Offering
- 9.8. Analysis by Deployment Mode
10. COMPANY COMPETITIVENESS ANALYSIS
- 10.1. Methodology and Scoring Criteria
- 10.2. Comparison of Leading Players: 2x2 Matrix
- 10.3. Leading Players
11. STARTUP ECOSYSTEM ANALYSIS
- 11.1. Methodology and Key Parameters
- 11.2. Analysis by Year of Establishment
- 11.3. Analysis by Company Size
- 11.4. Analysis by Location of Headquarters
- 11.5. Analysis by Type of Company
- 11.7. Analysis by Type of Offering
- 11.8. Analysis by Type of Deployment Mode
- 11.9. Analysis of Carbon Footprint Management Solution Providers by Location of Headquarters
- 11.10. Analysis of Cloud-based Carbon Footprint Management Solution Providers by Company Size
12. COMPANY PROFILES
- 12.1. Overview
- 12.2. Carbon Footprint
- 12.2.1. Company Overview
- 12.2.2. Management Team
- 12.2.3. Carbon Footprint Management Portfolio
- 12.2.4. Recent Initiatives
- *similar details are presented for other below mentioned companies based on information in the public domain**
- 12.3. Carbon Trust
- 12.4. Diligent
- 12.5. EcoAct
- 12.6. EnergyCAP
- 12.7. ENGIE Impact
- 12.8. Optimum Energy
- 12.9. SAP
- 12.10. Envirosoft
- 12.11. GreenSutra
- 12.12. ESP
13. MEGATRENDS
- 13.1. Climate Regulations and Net-zero Commitments
- 13.2. Technological Advancements
- 13.3. Corporate Decarbonization Strategies
- 13.4. Sustainability Driven Consumer Demands
- 13.5. Robust Regulatory Framework
- 13.6. Integration of Carbon Management into Business Strategy
14. UNMET NEEDS
- 14.1. Lack of Carbon Accounting Knowledge
- 14.2. Defining Emission Boundaries
- 14.3. Data Collection
- 14.4. Data Verification and Accuracy
- 14.5. Standardization and Data Consistency
- 14.6. Late Achievements
- 14.7. Technology and Infrastructure
- 14.8. Price Variations
15. CARBON FOOTPRINT MANAGEMENT: KEY STRATEGIES
- 15.1. Focus on Renewable Energy
- 15.2. Energy Efficiency Improvements
- 15.3. Supply Chain Optimization
- 15.4. Waste Reduction
- 15.5. Sustainable Transportation Strategies
- 15.6. Carbon Neutral Farming
- 15.7. Green House Solutions
- 15.8. Net Zero Aviation
16. PATENT ANALYSIS
- 16.1. Scope and Methodology
- 16.2. Key Parameters
- 16.3. Carbon Footprint Management: Patent Analysis
- 16.3.1. Analysis by Application Year
- 16.3.2. Analysis by Type of Patent
- 16.3.3. Analysis by Patent Jurisdiction
- 16.3.4. Analysis by Patent Publication Year
- 16.3.5. Analysis by Type of Patent and Patent Publication Year
- 16.3.6. Leading Players: Analysis by Number of Patents
- 16.3.7. Leading Individual Patent Assignees: Analysis by Number of Patents
- 16.3.8. Analysis by Type of Applicant
- 16.3.9. Analysis by Patent Age
- 16.3.10. Patent Valuation
17. GLOBAL CARBON FOOTPRINT MANAGEMENT MARKET
- 17.1. Key Assumptions and Methodology
- 17.2. Global Carbon Footprint Management Market, Historical Trends (Since 2021) and Forecasted Estimates (Till 2035)
- 17.2.1. Scenario Analysis
- 17.2.1.1. Conservative Scenario
- 17.2.1.2. Optimistic Scenario
- 17.2.1. Scenario Analysis
- 17.3. Key Market Segmentations
18. MARKET OPPORTUNITIES BASED ON TYPE OF OFFERING
- 18.1. Key Assumptions and Methodology
- 18.2. Carbon Footprint Management Market, by Type of Offering
- 18.2.1. Carbon Footprint Management Market for Software, Historical Trends (Since 2021) and Forecasted Estimates (Till 2035)
- 18.2.2. Carbon Footprint Management Market for Solution, Historical Trends (Since 2021) and Forecasted Estimates (Till 2035)
19. MARKET OPPORTUNITIES BASED ON DEPLOYMENT MODE
- 19.1. Key Assumptions and Methodology
- 19.2. Carbon Footprint Management Market, by Deployment Mode
- 19.2.1. Carbon Footprint Management Market for Cloud-based, Historical Trends (Since 2021) and Forecasted Estimates (Till 2035)
- 19.2.2. Carbon Footprint Management Market for On-Premises, Historical Trends (Since 2021) and Forecasted Estimates (Till 2035)
20. MARKET OPPORTUNITIES BASED ON TYPE OF ENTERPRISE
- 20.1. Key Assumptions and Methodology
- 20.2. Carbon Footprint Management Market, by Type of Enterprise
- 20.2.1. Carbon Footprint Management Market for Small Companies, Historical Trends (Since 2021) and Forecasted Estimates (Till 2035)
- 20.2.2. Carbon Footprint Management Market for Mid-sized Companies, Historical Trends (Since 2021) and Forecasted Estimates (Till 2035)
- 20.2.3. Carbon Footprint Management Market for Large Companies, Historical Trends (Since 2021) and Forecasted Estimates (Till 2035)
21. MARKET OPPORTUNITIES BASED ON END USE INDUSTRY
- 21.1. Key Assumptions and Methodology
- 21.2. Carbon Footprint Management Market, by End Use Industry
- 21.2.1. Carbon Footprint Management Market for Energy Utilities, Historical Trends (Since 2021) and Forecasted Estimates (Till 2035)
- 21.2.2. Carbon Footprint Management Market for Manufacturing Industry, Historical Trends (Since 2021) and Forecasted Estimates (Till 2035)
- 21.2.3. Carbon Footprint Management Market for Residential and Commercial Buildings, Historical Trends (Since 2021) and Forecasted Estimates (Till 2035)
- 21.2.4. Carbon Footprint Management Market for Transportation and Logistics, Historical Trends (Since 2021) and Forecasted Estimates (Till 2035)
- 21.2.5. Carbon Footprint Management Market for Agriculture Industry, Historical Trends (Since 2021) and Forecasted Estimates (Till 2035)
- 21.2.5. Carbon Footprint Management Market for Other Industries, Historical Trends (Since 2021) and Forecasted Estimates (Till 2035)
22. MARKET OPPORTUNITIES BASED ON GEOGRAPHICAL REGIONS
- 22.1. Key Assumptions and Methodology
- 22.2. Carbon Footprint Management Market, by Geographical Regions
- 22.2.1. Carbon Footprint Management Market for in North America, Historical Trends (Since 2021) and Forecasted Estimates (Till 2035)
- 22.2.1.1. Carbon Footprint Management Market in the US, Historical Trends (Since 2021) and Forecasted Estimates (Till 2035)
- 22.2.1.2. Carbon Footprint Management Market in Canada, Historical Trends (Since 2021) and Forecasted Estimates (Till 2035)
- 22.2.2 Carbon Footprint Management Market for in Europe, Historical Trends (Since 2021) and Forecasted Estimates (Till 2035)
- 22.2.2.1. Carbon Footprint Management Market in Germany, Historical Trends (Since 2021) and Forecasted Estimates (Till 2035)
- 22.2.2.2. Carbon Footprint Management Market in the UK, Historical Trends (Since 2021) and Forecasted Estimates (Till 2035)
- 22.2.2.3. Carbon Footprint Management Market in France, Historical Trends (Since 2021) and Forecasted Estimates (Till 2035)
- 22.2.2.4. Carbon Footprint Management Market in Italy, Historical Trends (Since 2021) and Forecasted Estimates (Till 2035)
- 22.2.2.5. Carbon Footprint Management Market in Spain, Historical Trends (Since 2021) and Forecasted Estimates (Till 2035)
- 22.2.2.6. Carbon Footprint Management Market for in Netherlands, Historical Trends (Since 2021) and Forecasted Estimates (Till 2035)
- 22.2.2.7. Carbon Footprint Management Market in Belgium, Historical Trends (Since 2021) and Forecasted Estimates (Till 2035)
- 22.2.2.8. Carbon Footprint Management Market in Austria, Historical Trends (Since 2021) and Forecasted Estimates (Till 2035)
- 22.2.2.9. Carbon Footprint Management Market in Rest of Europe, Historical Trends (Since 2021) and Forecasted Estimates (Till 2035)
- 22.2.3. Carbon Footprint Management Market for in Asia-Pacific, Historical Trends (Since 2021) and Forecasted Estimates (Till 2035)
- 22.2.3.1. Carbon Footprint Management Market in China, Historical Trends (Since 2021) and Forecasted Estimates (Till 2035)
- 22.2.3.2. Carbon Footprint Management Market in India, Historical Trends (Since 2021) and Forecasted Estimates (Till 2035)
- 22.2.3.3. Carbon Footprint Management Market for in Japan, Historical Trends (Since 2021) and Forecasted Estimates (Till 2035)
- 22.3.3.4. Carbon Footprint Management Market in the Indonesia, Historical Trends (Since 2021) and Forecasted Estimates (Till 2035)
- 22.3.3.5. Carbon Footprint Management Market in South Korea, Historical Trends (Since 2021) and Forecasted Estimates (Till 2035)
- 22.3.3.6. Carbon Footprint Management Market for in Rest of Asia-Pacific, Historical Trends (Since 2021) and Forecasted Estimates (Till 2035)
- 22.2.4. Carbon Footprint Management Market in Middle East and Africa, Historical Trends (Since 2021) and Forecasted Estimates (Till 2035)
- 22.2.4.1. Carbon Footprint Management Market in Iran, Historical Trends (Since 2021) and Forecasted Estimates (Till 2035)
- 22.2.4.2. Carbon Footprint Management Market in Saudi Arabia, Historical Trends (Since 2021) and Forecasted Estimates (Till 2035)
- 22.2.4.3. Carbon Footprint Management Market in South Africa, Historical Trends (Since 2021) and Forecasted Estimates (Till 2035)
- 22.2.4.4. Carbon Footprint Management Market in UAE, Historical Trends (Since 2021) and Forecasted Estimates (Till 2035)
- 22.2.4.5. Carbon Footprint Management Market in Kuwait, Historical Trends (Since 2021) and Forecasted Estimates (Till 2035)
- 22.2.4.6. Carbon Footprint Management Market in Oman, Historical Trends (Since 2021) and Forecasted Estimates (Till 2035)
- 22.2.4.7. Carbon Footprint Management Market in Israel, Historical Trends (Since 2021) and Forecasted Estimates (Till 2035)
- 22.2.4.8. Carbon Footprint Management Market in Rest of Middle East and Africa, Historical Trends (Since 2021) and Forecasted Estimates (Till 2035)
- 22.2.5. Carbon Footprint Management Market in Latin America, Historical Trends (Since 2021) and Forecasted Estimates (Till 2035)
- 22.2.5.1. Carbon Footprint Management Market in Brazil, Historical Trends (Since 2021) and Forecasted Estimates (Till 2035)
- 22.2.5.2. Carbon Footprint Management Market in Argentina, Historical Trends (Since 2021) and Forecasted Estimates (Till 2035)
- 22.2.5.3. Carbon Footprint Management Market in Rest of Latin America, Historical Trends (Since 2021) and Forecasted Estimates (Till 2035)
- 22.2.1. Carbon Footprint Management Market for in North America, Historical Trends (Since 2021) and Forecasted Estimates (Till 2035)
- 22.3. Market Movement Analysis
- 22.4. Penetration-Growth (P-G) Matrix
23. INSIGHTS FROM PRIMARY RESEARCH
24. CONCLUDING INSIGHTS
25. APPENDIX I: TABULATED DATA
26. APPENDIX II: LIST OF COMPANIES AND ORGANIZATIONS
 2026年全球碳足迹管理市场报告2026年全球碳足迹管理软体市场报告
 全球碳足迹管理市场规模、份额、趋势和成长分析报告(2026-2034年)
 碳足迹管理市场 - 全球产业规模、份额、趋势、竞争格局、机会及预测(按组件、部署模式、类型、最终用户产业、地区和竞争格局划分,2021-2031年)
 碳足迹管理市场规模、份额和成长分析(按组件、部署类型、组织规模、垂直产业和地区划分)-2026-2033年产业预测
 2025 年至 2033 年碳足迹管理市场报告(按产品、部署模式、最终用途产业和地区划分)
 全球碳足迹管理市场(至 2030 年)按组件(解决方案/服务)、部署模式(本地/云端)、组织规模(企业/中型/小型企业)、行业垂直和地区划分
 2025-2029年全球人工智慧碳足迹管理市场
 碳足迹管理市场 - 全球及区域分析:按组件、部署模型、垂直和地理 - 分析与预测(2025-2034)
 碳足迹管理市场分析与预测(至 2034 年):类型、产品、服务、技术、组件、应用、流程、最终用户、解决方案、部署