


 |
市场调查报告书
商品编码
1830061
碳黑的全球市场 (~2035年):流程类型·等级·用途·流通管道·粒子尺寸·永续性简介·各地区Carbon Black Market, Till 2035: Distribution by Type of Process, Type of Grade, Type of Application, Type of Distribution Channel, Particle Size, Sustainability Profile, and Geographical Regions: Industry Trends and Global Forecasts |
||||||
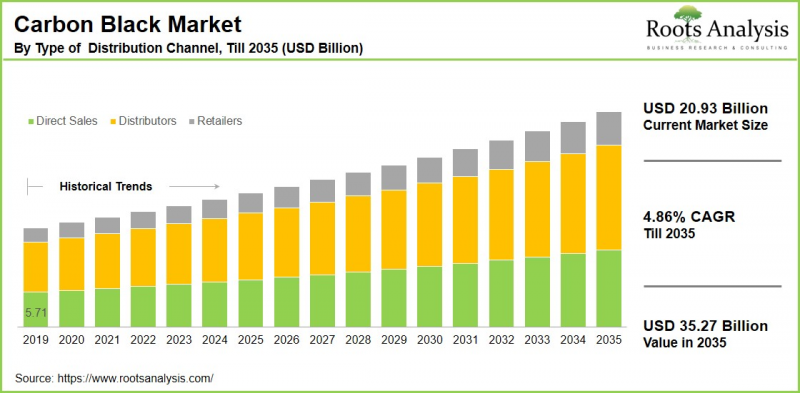
预计到 2035 年,全球炭黑市场规模将从目前的 209.3 亿美元增长至 352.7 亿美元,预测期内复合年增长率为 4.86%。
碳黑市场机会:分类
流程类型
- 乙炔碳黑
- 炉黑
- 热感黑
- 其他
等级
- 特殊等级
- 标准等级
用途
- 油墨和碳粉
- 非轮胎橡胶
- 塑胶
- 轮胎
- 其他
流通管道
- 直销
- 经销商
- 零售店
粒子尺寸
- 奈米尺寸
- 微尺寸
- 宏尺寸
永续性简介
- 生物原来碳黑
- 传统碳黑
- 完全回收碳黑
- 低碳足迹碳黑
- 部分回收碳黑
地区
- 北美
- 美国
- 加拿大
- 墨西哥
- 其他的北美各国
- 欧洲
- 奥地利
- 比利时
- 丹麦
- 法国
- 德国
- 爱尔兰
- 义大利
- 荷兰
- 挪威
- 俄罗斯
- 西班牙
- 瑞典
- 瑞士
- 英国
- 其他欧洲各国
- 亚洲
- 中国
- 印度
- 日本
- 新加坡
- 韩国
- 其他亚洲各国
- 南美
- 巴西
- 智利
- 哥伦比亚
- 委内瑞拉
- 其他的南美各国
- 中东·北非
- 埃及
- 伊朗
- 伊拉克
- 以色列
- 科威特
- 沙乌地阿拉伯
- 阿拉伯联合大公国
- 其他的中东·北非各国
- 全球其他地区
- 澳洲
- 纽西兰
- 其他的国家
炭黑市场:成长与趋势
炭黑在轮胎产业中发挥着至关重要的作用,随着汽车产量的增加,轮胎製造对炭黑的需求也不断增长。炭黑是由碳氢化合物不完全燃烧产生的细碳粉,用作补强剂,以提高橡胶製品的强度和性能。
炭黑广泛应用于汽车、航太、电子、农业和建筑等各种工业领域。随着汽车和製造业的持续成长,炭黑的需求预计将进一步成长,凸显其在现代工业应用中的重要角色。
随着技术进步和创新,炭黑产业不断发展。这推动了炭黑在电池和再生能源储存等新领域的应用,展现了其适应能力和对产业创新的投入。此外,整个产业都注重永续发展,并采取了多项举措,例如开发永续炭黑和推广旨在最大程度减少化石燃料使用的循环经济。预计这些因素将在预测期内推动炭黑市场的显着成长。
本报告探讨了全球炭黑市场,并提供了市场概况、背景、市场影响因素分析、市场规模趋势和预测、按部门市场和地区进行的详细分析、竞争格局以及主要公司概况。
目录
第1章 序文
第2章 调查手法
第3章 经济以及其他的计划特有的考虑事项
第4章 宏观经济指标
第5章 摘要整理
第6章 简介
第7章 竞争情形
第8章 碳黑市场上Start-Ups生态系统
第9章 企业简介
- 章概要
- Abu Dhabi National Oil
- Asahi Carbon
- Birla Carbon
- Cabot
- China Synthetic Rubber
- Himadri Specialty Chemical
- IMERYS Graphite and Carbon
- International CSRC
- Jiangxi Black Cat Carbon Black
- Longxing Chemical
- Mitsubishi Chemical
- OCI Company
- Omsk Carbon
- Orion Engineered Carbons
- Phillips Carbon Black
- Sid Richardson Carbon &Energy
- Tokai Carbon
第10章 价值链分析
第11章 SWOT分析
第12章 全球碳黑市场
第13章 各流程的市场机会
第14章 各等级的市场机会
第15章 各用途的市场机会
第16章 各流通管道的市场机会
第17章 粒子各尺寸的市场机会
第18章 永续性简介的市场机会
第19章 北美碳黑的市场机会
第20章 欧洲的碳黑的市场机会
第21章 亚洲的碳黑的市场机会
第22章 中东·北非的碳黑的市场机会
第23章 南美的碳黑的市场机会
第24章 全球其他地区的碳黑的市场机会
第25章 表格形式资料
第26章 企业·团体一览
第27章 客制化的机会
第28章 ROOTS订阅服务
第29章 着者详细内容
Carbon Black Market Overview
As per Roots Analysis, the global carbon black market size is estimated to grow from USD 20.93 billion in the current year USD 35.27 billion by 2035, at a CAGR of 4.86% during the forecast period, till 2035.
The opportunity for carbon black market has been distributed across the following segments:
Type of Process
- Acetylene Black
- Furnace Black
- Thermal Black
- Others
Type of Grade
- Specialty Grade
- Standard Grade
Type of Application
- Inks & Toners
- Non-Tire Rubber
- Plastics
- Tire
- Others
Type of Distribution Channel
- Direct Sales
- Distributors
- Retailers
Particle Size
- Nano-sized
- Micro-sized
- Macro-sized
Sustainability Profile
- Bio-derived Carbon Black
- Conventional Carbon Black
- Fully Recycled Carbon Black
- Low Carbon Footprint Carbon Black
- Partially Recycled Carbon Black
Geographical Regions
- North America
- US
- Canada
- Mexico
- Other North American countries
- Europe
- Austria
- Belgium
- Denmark
- France
- Germany
- Ireland
- Italy
- Netherlands
- Norway
- Russia
- Spain
- Sweden
- Switzerland
- UK
- Other European countries
- Asia
- China
- India
- Japan
- Singapore
- South Korea
- Other Asian countries
- Latin America
- Brazil
- Chile
- Colombia
- Venezuela
- Other Latin American countries
- Middle East and North Africa
- Egypt
- Iran
- Iraq
- Israel
- Kuwait
- Saudi Arabia
- UAE
- Other MENA countries
- Rest of the World
- Australia
- New Zealand
- Other countries
Carbon Black Market: Growth and Trends
Carbon black plays a vital role in the tire sector, as the production of vehicles rises, so does the demand for carbon black in tire production. Specifically, carbon black is a fine carbon powder generated through the incomplete burning of hydrocarbons and acts as a reinforcing agent that improves the reliability and performance of rubber products.
Carbon black finds applications across various industries, including automotive, aerospace, electronics, agriculture, and construction. Additionally, as the automotive and manufacturing sectors continue to grow, the demand for carbon black is anticipated to increase, underscoring its essential function in contemporary industrial applications.
The carbon black sector is in a state of constant evolution, propelled by innovations and technological progress. This change has facilitated the integration of carbon black into new sectors like batteries and renewable energy storage, demonstrating its adaptability and the industry's dedication to innovation. Moreover, the industry prioritizes sustainability, as evidenced by the emergence of sustainable carbon black and circular economy initiatives aimed at minimizing fossil fuel usage. Owing to the above-mentioned factors, the carbon black market is expected to grow significantly during the forecast period.
Carbon Black Market: Key Segments
Market Share by Type of Process
Based on type of process, the global carbon black market is segmented into acetylene black, furnace black, thermal black and others. According to our estimates, currently, the furnace black segment captures the majority of the market share. Further, this segment is projected to experience the highest CAGR during the forecast period. This is due to its cost-effectiveness and versatility in various applications, especially within the tire and rubber sectors.
Market Share by Type of Grade
Based on type of grade, the global carbon black market is segmented into specialty grade and standard grade. According to our estimates, currently, the standard grade segment captures the majority of the market share. This is due to its extensive application in manufacturing general-purpose rubber items such as tires, hoses, and belts.
However, the specialty grade segment is expected to grow at a higher CAGR during the forecast period. Key factors contributing to its growth include rising demand for advanced materials, the expansion of significant industries, and innovations within established markets.
Market Share by Type of Application
Based on type of application, the global carbon black market is segmented into inks & toners, non-tire rubber, plastics, tire and others. According to our estimates, currently, the tire segment captures the majority of the market share. This can be attributed to the dependence on carbon black, along with the rapid expansion of the automotive sector globally, particularly in developing countries.
However, the plastics segment is expected to grow at a higher CAGR during the forecast period. Key factors contributing to its growth include rising demand for advanced materials, the expansion of significant industries, and innovations within established markets.
Market Share by Type of Distribution Channel
Based on type of distribution channel, the global carbon black market is segmented into direct sales, distributors and retailers. According to our estimates, currently, the distributors segment captures the majority of the market share.
Further, this segment is projected to experience the highest CAGR during the forecast period. This can be attributed to their capacity to manage substantial quantities of carbon black and offer extensive market coverage, alongside the growing industrial demand for effective supply chain solutions.
Market Share by Particle Size
Based on particle size, the global carbon black market is segmented into nano-sized, micro-sized, macro-sized. According to our estimates, currently, the macro-sized segment captures the majority of the market share. Further, this segment is projected to experience the highest CAGR during the forecast period. This growth can be attributed to their application in the tire industry and the expected expansion in the automotive and construction industries.
Market Share by Sustainability Profile
Based on sustainability profile, the global carbon black market is segmented into bio-derived carbon black, conventional carbon black, fully recycled carbon black, low carbon footprint carbon black and partially recycled carbon black. According to our estimates, currently, the conventional carbon black segment captures the majority of the market share. This is due to several factors such as a well-established supply chain, widespread usage across different industries, and cost-effective manufacturing.
However, the bio-derived carbon black segment is expected to grow at a higher CAGR during the forecast period, owing to the changing consumer preferences, regulatory backing for environmentally friendly materials.
Market Share by Geographical Regions
Based on geographical regions, the carbon black market is segmented into North America, Europe, Asia, Latin America, Middle East and North Africa, and the rest of the world. According to our estimates, currently, Asia captures the majority share of the market. Additionally, it is projected to experience a higher CAGR during the forecast period. The primary factors contributing to this leadership include increasing production and demand for carbon black and its application in various industrial sectors, especially in countries such as China and India.
Example Players in Carbon Black Market
- Abu Dhabi National Oil
- Asahi Carbon
- Birla Carbon
- Cabot
- China Synthetic Rubber
- Himadri Specialty Chemical
- Imers Graphite and Carbon
- International CSRC
- Jiangxi Black Cat Carbon Black
- Longxing Chemical
- Mitsubishi Chemical
- OCI Company
- Omsk Carbon
- Orion Engineered Carbons
- Phillips Carbon Black
- Sid Richardson Carbon & Energy
- Tokai Carbon
Carbon Black Market: Research Coverage
The report on the carbon black market features insights on various sections, including:
- Market Sizing and Opportunity Analysis: An in-depth analysis of the carbon black market, focusing on key market segments, including [A] type of process, [B] type of grade, [C] type of application, [D] type of distribution channel, [E] particle size, [F] sustainability profile, and [G] geographical regions.
- Competitive Landscape: A comprehensive analysis of the companies engaged in the carbon black market, based on several relevant parameters, such as [A] year of establishment, [B] company size, [C] location of headquarters and [D] ownership structure.
- Company Profiles: Elaborate profiles of prominent players engaged in the carbon black market, providing details on [A] location of headquarters, [B] company size, [C] company mission, [D] company footprint, [E] management team, [F] contact details, [G] financial information, [H] operating business segments, [I] carbon black portfolio, [J] moat analysis, [K] recent developments, and an informed future outlook.
- SWOT Analysis: An insightful SWOT framework, highlighting the strengths, weaknesses, opportunities and threats in the domain. Additionally, it provides Harvey ball analysis, highlighting the relative impact of each SWOT parameter.
- Value Chain Analysis: A comprehensive analysis of the value chain, providing information on the different phases and stakeholders involved in the carbon black market.
Key Questions Answered in this Report
- How many companies are currently engaged in carbon black market?
- Which are the leading companies in this market?
- What factors are likely to influence the evolution of this market?
- What is the current and future market size?
- What is the CAGR of this market?
- How is the current and future market opportunity likely to be distributed across key market segments?
Reasons to Buy this Report
- The report provides a comprehensive market analysis, offering detailed revenue projections of the overall market and its specific sub-segments. This information is valuable to both established market leaders and emerging entrants.
- Stakeholders can leverage the report to gain a deeper understanding of the competitive dynamics within the market. By analyzing the competitive landscape, businesses can make informed decisions to optimize their market positioning and develop effective go-to-market strategies.
- The report offers stakeholders a comprehensive overview of the market, including key drivers, barriers, opportunities, and challenges. This information empowers stakeholders to stay abreast of market trends and make data-driven decisions to capitalize on growth prospects.
Additional Benefits
- Complimentary Excel Data Packs for all Analytical Modules in the Report
- 15% Free Content Customization
- Detailed Report Walkthrough Session with Research Team
- Free Updated report if the report is 6-12 months old or older
TABLE OF CONTENTS
1. PREFACE
- 1.1. Introduction
- 1.2. Market Share Insights
- 1.3. Key Market Insights
- 1.4. Report Coverage
- 1.5. Key Questions Answered
- 1.6. Chapter Outlines
2. RESEARCH METHODOLOGY
- 2.1. Chapter Overview
- 2.2. Research Assumptions
- 2.3. Database Building
- 2.3.1. Data Collection
- 2.3.2. Data Validation
- 2.3.3. Data Analysis
- 2.4. Project Methodology
- 2.4.1. Secondary Research
- 2.4.1.1. Annual Reports
- 2.4.1.2. Academic Research Papers
- 2.4.1.3. Company Websites
- 2.4.1.4. Investor Presentations
- 2.4.1.5. Regulatory Filings
- 2.4.1.6. White Papers
- 2.4.1.7. Industry Publications
- 2.4.1.8. Conferences and Seminars
- 2.4.1.9. Government Portals
- 2.4.1.10. Media and Press Releases
- 2.4.1.11. Newsletters
- 2.4.1.12. Industry Databases
- 2.4.1.13. Roots Proprietary Databases
- 2.4.1.14. Paid Databases and Sources
- 2.4.1.15. Social Media Portals
- 2.4.1.16. Other Secondary Sources
- 2.4.2. Primary Research
- 2.4.2.1. Introduction
- 2.4.2.2. Types
- 2.4.2.2.1. Qualitative
- 2.4.2.2.2. Quantitative
- 2.4.2.3. Advantages
- 2.4.2.4. Techniques
- 2.4.2.4.1. Interviews
- 2.4.2.4.2. Surveys
- 2.4.2.4.3. Focus Groups
- 2.4.2.4.4. Observational Research
- 2.4.2.4.5. Social Media Interactions
- 2.4.2.5. Stakeholders
- 2.4.2.5.1. Company Executives (CXOs)
- 2.4.2.5.2. Board of Directors
- 2.4.2.5.3. Company Presidents and Vice Presidents
- 2.4.2.5.4. Key Opinion Leaders
- 2.4.2.5.5. Research and Development Heads
- 2.4.2.5.6. Technical Experts
- 2.4.2.5.7. Subject Matter Experts
- 2.4.2.5.8. Scientists
- 2.4.2.5.9. Doctors and Other Healthcare Providers
- 2.4.2.6. Ethics and Integrity
- 2.4.2.6.1. Research Ethics
- 2.4.2.6.2. Data Integrity
- 2.4.3. Analytical Tools and Databases
- 2.4.1. Secondary Research
3. ECONOMIC AND OTHER PROJECT SPECIFIC CONSIDERATIONS
- 3.1. Forecast Methodology
- 3.1.1. Top-Down Approach
- 3.1.2. Bottom-Up Approach
- 3.1.3. Hybrid Approach
- 3.2. Market Assessment Framework
- 3.2.1. Total Addressable Market (TAM)
- 3.2.2. Serviceable Addressable Market (SAM)
- 3.2.3. Serviceable Obtainable Market (SOM)
- 3.2.4. Currently Acquired Market (CAM)
- 3.3. Forecasting Tools and Techniques
- 3.3.1. Qualitative Forecasting
- 3.3.2. Correlation
- 3.3.3. Regression
- 3.3.4. Time Series Analysis
- 3.3.5. Extrapolation
- 3.3.6. Convergence
- 3.3.7. Forecast Error Analysis
- 3.3.8. Data Visualization
- 3.3.9. Scenario Planning
- 3.3.10. Sensitivity Analysis
- 3.4. Key Considerations
- 3.4.1. Demographics
- 3.4.2. Market Access
- 3.4.3. Reimbursement Scenarios
- 3.4.4. Industry Consolidation
- 3.5. Robust Quality Control
- 3.6. Key Market Segmentations
- 3.7. Limitations
4. MACRO-ECONOMIC INDICATORS
- 4.1. Chapter Overview
- 4.2. Market Dynamics
- 4.2.1. Time Period
- 4.2.1.1. Historical Trends
- 4.2.1.2. Current and Forecasted Estimates
- 4.2.2. Currency Coverage
- 4.2.2.1. Overview of Major Currencies Affecting the Market
- 4.2.2.2. Impact of Currency Fluctuations on the Industry
- 4.2.3. Foreign Exchange Impact
- 4.2.3.1. Evaluation of Foreign Exchange Rates and Their Impact on Market
- 4.2.3.2. Strategies for Mitigating Foreign Exchange Risk
- 4.2.4. Recession
- 4.2.4.1. Historical Analysis of Past Recessions and Lessons Learnt
- 4.2.4.2. Assessment of Current Economic Conditions and Potential Impact on the Market
- 4.2.5. Inflation
- 4.2.5.1. Measurement and Analysis of Inflationary Pressures in the Economy
- 4.2.5.2. Potential Impact of Inflation on the Market Evolution
- 4.2.6. Interest Rates
- 4.2.6.1. Overview of Interest Rates and Their Impact on the Market
- 4.2.6.2. Strategies for Managing Interest Rate Risk
- 4.2.7. Commodity Flow Analysis
- 4.2.7.1. Type of Commodity
- 4.2.7.2. Origins and Destinations
- 4.2.7.3. Values and Weights
- 4.2.7.4. Modes of Transportation
- 4.2.8. Global Trade Dynamics
- 4.2.8.1. Import Scenario
- 4.2.8.2. Export Scenario
- 4.2.9. War Impact Analysis
- 4.2.9.1. Russian-Ukraine War
- 4.2.9.2. Israel-Hamas War
- 4.2.10. COVID Impact / Related Factors
- 4.2.10.1. Global Economic Impact
- 4.2.10.2. Industry-specific Impact
- 4.2.10.3. Government Response and Stimulus Measures
- 4.2.10.4. Future Outlook and Adaptation Strategies
- 4.2.11. Other Indicators
- 4.2.11.1. Fiscal Policy
- 4.2.11.2. Consumer Spending
- 4.2.11.3. Gross Domestic Product (GDP)
- 4.2.11.4. Employment
- 4.2.11.5. Taxes
- 4.2.11.6. R&D Innovation
- 4.2.11.7. Stock Market Performance
- 4.2.11.8. Supply Chain
- 4.2.11.9. Cross-Border Dynamics
- 4.2.1. Time Period
5. EXECUTIVE SUMMARY
6. INTRODUCTION
- 6.1. Chapter Overview
- 6.2. Overview of Carbon Black Market
- 6.2.1. Type of Process
- 6.2.2. Type of Grade
- 6.2.3. Type of Application
- 6.2.4. Type of Distribution Channel
- 6.3. Future Perspective
7. COMPETITIVE LANDSCAPE
- 7.1. Chapter Overview
- 7.2. Carbon Black: Overall Market Landscape
- 7.2.1. Analysis by Year of Establishment
- 7.2.2. Analysis by Company Size
- 7.2.3. Analysis by Location of Headquarters
- 7.2.4. Analysis by Ownership Structure
8. STARTUP ECOSYSTEM IN THE CARBON BLACK MARKET
- 8.1. Carbon Black Market: Market Landscape of Startups
- 8.1.1. Analysis by Year of Establishment
- 8.1.2. Analysis by Company Size
- 8.1.3. Analysis by Company Size and Year of Establishment
- 8.1.4. Analysis by Location of Headquarters
- 8.1.5. Analysis by Company Size and Location of Headquarters
- 8.1.6. Analysis by Ownership Structure
- 8.2. Key Findings
9. COMPANY PROFILES
- 9.1. Chapter Overview
- 9.2. Abu Dhabi National Oil *
- 9.2.1. Company Overview
- 9.2.2. Company Mission
- 9.2.3. Company Footprint
- 9.2.4. Management Team
- 9.2.5. Contact Details
- 9.2.6. Financial Performance
- 9.2.7. Operating Business Segments
- 9.2.8. Service / Product Portfolio (project specific)
- 9.2.9. MOAT Analysis
- 9.2.10. Recent Developments and Future Outlook
- 9.3. Asahi Carbon
- 9.4. Birla Carbon
- 9.5. Cabot
- 9.6. China Synthetic Rubber
- 9.7. Himadri Specialty Chemical
- 9.8. IMERYS Graphite and Carbon
- 9.9. International CSRC
- 9.10. Jiangxi Black Cat Carbon Black
- 9.11. Longxing Chemical
- 9.12. Mitsubishi Chemical
- 9.13. OCI Company
- 9.14. Omsk Carbon
- 9.15. Orion Engineered Carbons
- 9.16. Phillips Carbon Black
- 9.17. Sid Richardson Carbon & Energy
- 9.18. Tokai Carbon
10. VALUE CHAIN ANALYSIS
11. SWOT ANALYSIS
12. GLOBAL CARBON BLACK MARKET
- 12.1. Chapter Overview
- 12.2. Key Assumptions and Methodology
- 12.3. Trends Disruption Impacting Market
- 12.4. Global Carbon Black Market, Historical Trends (Since 2019) and Forecasted Estimates (Till 2035)
- 12.5. Multivariate Scenario Analysis
- 12.5.1. Conservative Scenario
- 12.5.2. Optimistic Scenario
- 12.6. Key Market Segmentations
13. MARKET OPPORTUNITIES BASED ON TYPE OF PROCESS
- 13.1. Chapter Overview
- 13.2. Key Assumptions and Methodology
- 13.3. Revenue Shift Analysis
- 13.4. Market Movement Analysis
- 13.5. Penetration-Growth (P-G) Matrix
- 13.6. Carbon Black Market for Acetylene Black: Historical Trends (Since 2019) and Forecasted Estimates (Till 2035)
- 13.7. Carbon Black Market for Furnace Black: Historical Trends (Since 2019) and Forecasted Estimates (Till 2035)
- 13.8. Carbon Black Market for Thermal Black: Historical Trends (Since 2019) and Forecasted Estimates (Till 2035)
- 13.9. Carbon Black Market for Others: Historical Trends (Since 2019) and Forecasted Estimates (Till 2035)
- 13.10. Data Triangulation and Validation
14. MARKET OPPORTUNITIES BASED ON TYPE OF GRADE
- 14.1. Chapter Overview
- 14.2. Key Assumptions and Methodology
- 14.3. Revenue Shift Analysis
- 14.4. Market Movement Analysis
- 14.5. Penetration-Growth (P-G) Matrix
- 14.6. Carbon Black Market for Specialty Grade: Historical Trends (Since 2019) and Forecasted Estimates (Till 2035)
- 14.7. Carbon Black Market for Standard Grade: Historical Trends (Since 2019) and Forecasted Estimates (Till 2035)
- 14.8. Data Triangulation and Validation
15. MARKET OPPORTUNITIES BASED ON TYPE OF APPLICATION
- 15.1. Chapter Overview
- 15.2. Key Assumptions and Methodology
- 15.3. Revenue Shift Analysis
- 15.4. Market Movement Analysis
- 15.5. Penetration-Growth (P-G) Matrix
- 15.6. Carbon Black Market for Inks & Toners: Historical Trends (Since 2019) and Forecasted Estimates (Till 2035)
- 15.7. Carbon Black Market for Non-Tire Rubber: Historical Trends (Since 2019) and Forecasted Estimates (Till 2035)
- 15.8. Carbon Black Market for Plastics: Historical Trends (Since 2019) and Forecasted Estimates (Till 2035)
- 15.9. Carbon Black Market for Tire: Historical Trends (Since 2019) and Forecasted Estimates (Till 2035)
- 15.10. Carbon Black Market for Others: Historical Trends (Since 2019) and Forecasted Estimates (Till 2035)
- 15.11. Data Triangulation and Validation
16. MARKET OPPORTUNITIES BASED ON TYPE OF DISTRIBUTION CHANNEL
- 16.1. Chapter Overview
- 16.2. Key Assumptions and Methodology
- 16.3. Revenue Shift Analysis
- 16.4. Market Movement Analysis
- 16.5. Penetration-Growth (P-G) Matrix
- 16.6. Carbon Black Market for Direct Sales: Historical Trends (Since 2019) and Forecasted Estimates (Till 2035)
- 16.7. Carbon Black Market for Distributors: Historical Trends (Since 2019) and Forecasted Estimates (Till 2035)
- 16.8. Carbon Black Market for Retailers: Historical Trends (Since 2019) and Forecasted Estimates (Till 2035)
- 16.9. Data Triangulation and Validation
17. MARKET OPPORTUNITIES BASED ON PARTICLE SIZE
- 17.1. Chapter Overview
- 17.2. Key Assumptions and Methodology
- 17.3. Revenue Shift Analysis
- 17.4. Market Movement Analysis
- 17.5. Penetration-Growth (P-G) Matrix
- 17.6. Carbon Black Market for Nano-Sized: Historical Trends (Since 2019) and Forecasted Estimates (Till 2035)
- 17.7. Carbon Black Market for Micro-sized: Historical Trends (Since 2019) and Forecasted Estimates (Till 2035)
- 17.8. Carbon Black Market for Macro-sized: Historical Trends (Since 2019) and Forecasted Estimates (Till 2035)
- 17.9. Data Triangulation and Validation
18. MARKET OPPORTUNITIES BASED ON SUSTAINABILITY PROFILE
- 18.1. Chapter Overview
- 18.2. Key Assumptions and Methodology
- 18.3. Revenue Shift Analysis
- 18.4. Market Movement Analysis
- 18.5. Penetration-Growth (P-G) Matrix
- 18.6. Carbon Black Market for Bio-derived Carbon Black: Historical Trends (Since 2019) and Forecasted Estimates (Till 2035)
- 18.7. Carbon Black Market for Conventional Carbon Black: Historical Trends (Since 2019) and Forecasted Estimates (Till 2035)
- 18.8. Carbon Black Market for Fully Recycled Carbon Black: Historical Trends (Since 2019) and Forecasted Estimates (Till 2035)
- 18.9. Carbon Black Market for Low Carbon Footprint Carbon Black: Historical Trends (Since 2019) and Forecasted Estimates (Till 2035)
- 18.10. Carbon Black Market for Partially Recycled Carbon Black: Historical Trends (Since 2019) and Forecasted Estimates (Till 2035)
- 18.11. Data Triangulation and Validation
19. MARKET OPPORTUNITIES FOR CARBON BLACK IN NORTH AMERICA
- 19.1. Chapter Overview
- 19.2. Key Assumptions and Methodology
- 19.3. Revenue Shift Analysis
- 19.4. Market Movement Analysis
- 19.5. Penetration-Growth (P-G) Matrix
- 19.6. Carbon Black Market in North America: Historical Trends (Since 2019) and Forecasted Estimates (Till 2035)
- 19.6.1. Carbon Black Market in the US: Historical Trends (Since 2019) and Forecasted Estimates (Till 2035)
- 19.6.2. Carbon Black Market in Canada: Historical Trends (Since 2019) and Forecasted Estimates (Till 2035)
- 19.6.3. Carbon Black Market in Mexico: Historical Trends (Since 2019) and Forecasted Estimates (Till 2035)
- 19.6.4. Carbon Black Market in Other North American Countries: Historical Trends (Since 2019) and Forecasted Estimates (Till 2035)
- 19.7. Data Triangulation and Validation
20. MARKET OPPORTUNITIES FOR CARBON BLACK IN EUROPE
- 20.1. Chapter Overview
- 20.2. Key Assumptions and Methodology
- 20.3. Revenue Shift Analysis
- 20.4. Market Movement Analysis
- 20.5. Penetration-Growth (P-G) Matrix
- 20.6. Carbon Black Market in Europe: Historical Trends (Since 2019) and Forecasted Estimates (Till 2035)
- 20.6.1. Carbon Black Market in Austria: Historical Trends (Since 2019) and Forecasted Estimates (Till 2035)
- 20.6.2. Carbon Black Market in Belgium: Historical Trends (Since 2019) and Forecasted Estimates (Till 2035)
- 20.6.3. Carbon Black Market in Denmark: Historical Trends (Since 2019) and Forecasted Estimates (Till 2035)
- 20.6.4. Carbon Black Market in France: Historical Trends (Since 2019) and Forecasted Estimates (Till 2035)
- 20.6.5. Carbon Black Market in Germany: Historical Trends (Since 2019) and Forecasted Estimates (Till 2035)
- 20.6.6. Carbon Black Market in Ireland: Historical Trends (Since 2019) and Forecasted Estimates (Till 2035)
- 20.6.7. Carbon Black Market in Italy: Historical Trends (Since 2019) and Forecasted Estimates (Till 2035)
- 20.6.8. Carbon Black Market in Netherlands: Historical Trends (Since 2019) and Forecasted Estimates (Till 2035)
- 20.6.9. Carbon Black Market in Norway: Historical Trends (Since 2019) and Forecasted Estimates (Till 2035)
- 20.6.10. Carbon Black Market in Russia: Historical Trends (Since 2019) and Forecasted Estimates (Till 2035)
- 20.6.11. Carbon Black Market in Spain: Historical Trends (Since 2019) and Forecasted Estimates (Till 2035)
- 20.6.12. Carbon Black Market in Sweden: Historical Trends (Since 2019) and Forecasted Estimates (Till 2035)
- 20.6.13. Carbon Black Market in Switzerland: Historical Trends (Since 2019) and Forecasted Estimates (Till 2035)
- 20.6.14. Carbon Black Market in the UK: Historical Trends (Since 2019) and Forecasted Estimates (Till 2035)
- 20.6.15. Carbon Black Market in Other European Countries: Historical Trends (Since 2019) and Forecasted Estimates (Till 2035)
- 20.7. Data Triangulation and Validation
21. MARKET OPPORTUNITIES FOR CARBON BLACK IN ASIA
- 21.1. Chapter Overview
- 21.2. Key Assumptions and Methodology
- 21.3. Revenue Shift Analysis
- 21.4. Market Movement Analysis
- 21.5. Penetration-Growth (P-G) Matrix
- 21.6. Carbon Black Market in Asia: Historical Trends (Since 2019) and Forecasted Estimates (Till 2035)
- 21.6.1. Carbon Black Market in China: Historical Trends (Since 2019) and Forecasted Estimates (Till 2035)
- 21.6.2. Carbon Black Market in India: Historical Trends (Since 2019) and Forecasted Estimates (Till 2035)
- 21.6.3. Carbon Black Market in Japan: Historical Trends (Since 2019) and Forecasted Estimates (Till 2035)
- 21.6.4. Carbon Black Market in Singapore: Historical Trends (Since 2019) and Forecasted Estimates (Till 2035)
- 21.6.5. Carbon Black Market in South Korea: Historical Trends (Since 2019) and Forecasted Estimates (Till 2035)
- 21.6.6. Carbon Black Market in Other Asian Countries: Historical Trends (Since 2019) and Forecasted Estimates (Till 2035)
- 21.7. Data Triangulation and Validation
22. MARKET OPPORTUNITIES FOR CARBON BLACK IN MIDDLE EAST AND NORTH AFRICA (MENA)
- 22.1. Chapter Overview
- 22.2. Key Assumptions and Methodology
- 22.3. Revenue Shift Analysis
- 22.4. Market Movement Analysis
- 22.5. Penetration-Growth (P-G) Matrix
- 22.6. Carbon Black Market in Middle East and North Africa (MENA): Historical Trends (Since 2019) and Forecasted Estimates (Till 2035)
- 22.6.1. Carbon Black Market in Egypt: Historical Trends (Since 2019) and Forecasted Estimates (Till 205)
- 22.6.2. Carbon Black Market in Iran: Historical Trends (Since 2019) and Forecasted Estimates (Till 2035)
- 22.6.3. Carbon Black Market in Iraq: Historical Trends (Since 2019) and Forecasted Estimates (Till 2035)
- 22.6.4. Carbon Black Market in Israel: Historical Trends (Since 2019) and Forecasted Estimates (Till 2035)
- 22.6.5. Carbon Black Market in Kuwait: Historical Trends (Since 2019) and Forecasted Estimates (Till 2035)
- 22.6.6. Carbon Black Market in Saudi Arabia: Historical Trends (Since 2019) and Forecasted Estimates (Till 2035)
- 22.6.7. Carbon Black Market in United Arab Emirates (UAE): Historical Trends (Since 2019) and Forecasted Estimates (Till 2035)
- 22.6.8. Carbon Black Market in Other MENA Countries: Historical Trends (Since 2019) and Forecasted Estimates (Till 2035)
- 22.7. Data Triangulation and Validation
23. MARKET OPPORTUNITIES FOR CARBON BLACK IN LATIN AMERICA
- 23.1. Chapter Overview
- 23.2. Key Assumptions and Methodology
- 23.3. Revenue Shift Analysis
- 23.4. Market Movement Analysis
- 23.5. Penetration-Growth (P-G) Matrix
- 23.6. Carbon Black Market in Latin America: Historical Trends (Since 2019) and Forecasted Estimates (Till 2035)
- 23.6.1. Carbon Black Market in Argentina: Historical Trends (Since 2019) and Forecasted Estimates (Till 2035)
- 23.6.2. Carbon Black Market in Brazil: Historical Trends (Since 2019) and Forecasted Estimates (Till 2035)
- 23.6.3. Carbon Black Market in Chile: Historical Trends (Since 2019) and Forecasted Estimates (Till 2035)
- 23.6.4. Carbon Black Market in Colombia Historical Trends (Since 2019) and Forecasted Estimates (Till 2035)
- 23.6.5. Carbon Black Market in Venezuela: Historical Trends (Since 2019) and Forecasted Estimates (Till 2035)
- 23.6.6. Carbon Black Market in Other Latin American Countries: Historical Trends (Since 2019) and Forecasted Estimates (Till 2035)
- 23.7. Data Triangulation and Validation
24. MARKET OPPORTUNITIES FOR CARBON BLACK IN REST OF THE WORLD
- 24.1. Chapter Overview
- 24.2. Key Assumptions and Methodology
- 24.3. Revenue Shift Analysis
- 24.4. Market Movement Analysis
- 24.5. Penetration-Growth (P-G) Matrix
- 24.6. Carbon Black Market in Rest of the World: Historical Trends (Since 2019) and Forecasted Estimates (Till 2035)
- 24.6.1. Carbon Black Market in Australia: Historical Trends (Since 2019) and Forecasted Estimates (Till 2035)
- 24.6.2. Carbon Black Market in New Zealand: Historical Trends (Since 2019) and Forecasted Estimates (Till 2035)
- 24.6.3. Carbon Black Market in Other Countries
- 24.7. Data Triangulation and Validation
25. TABULATED DATA
26. LIST OF COMPANIES AND ORGANIZATIONS
27. CUSTOMIZATION OPPORTUNITIES
28. ROOTS SUBSCRIPTION SERVICES
29. AUTHOR DETAILS
 2026年全球黑火药市场报告
 特种奈米碳管管粉末市场:依纯度、类型、生产方法、功能、最终用途和应用划分-全球预测,2026-2032年
 全球炭黑市场(2026-2036)
 炭黑:市场占有率分析、产业趋势与统计、成长预测(2026-2031)2026年全球炭黑市场报告2026年全球石墨化炭黑(GCB)市场报告
 炭黑市场-全球产业规模、份额、趋势、机会、预测:按类型、应用、地区和竞争格局划分,2021-2031年炭黑填充母粒市场按类型、等级、产品形式、加工技术、应用和分销管道划分,全球预测(2026-2032年)全球炭黑市场:市场规模、份额、成长率、产业分析、按类型、应用和地区划分的分析、未来预测(2026-2034)标准炭黑市场规模、占有率、成长、全球产业分析:按类型、应用和地区划分的洞察与预测(2026-2034 年)