


 |
市场调查报告书
商品编码
1849801
最后填充医药品受託製造市场:2035年前的产业趋势和全球预测 - 各最后填充服务形式,FDF,API滴定率,一次用包装容器,各地区,主要企业Fill Finish Pharmaceutical Contract Manufacturing Market: Industry Trends and Global Forecasts, Till 2035 - Distribution by Type of Fill Finish Service Offered, FDF, API Potency, Primary Packaging Container, Geographical Regions and Leading Players |
||||||
全球最终灌装药品合约生产市场预计将从目前的 75 亿美元成长至 2035 年的 121 亿美元,预测期内复合年增长率 (CAGR) 为 4.8%。
最终灌装药品合约生产市场
市场区隔将市场机会分为以下几个部分:
最终灌装服务类型
- 无菌填充
- BFS(成型同时填充)
- 末端杀菌
FDF类型
- 非专利FDF
- 原厂药FDF
API滴定率
- 低活性API
- 高活性API
一次用包装容器类型
- 安瓿
- 滤芯
- 预填充式注射器
- 管瓶
- 其他
事业规模
- 临床
- 商业
企业规模
- 中小企业
- 大企业/超大企业
主要地区
- 北美
- 欧洲
- 亚太地区
- 南美
- 中东·北非
最终灌装合约生产市场成长与趋势
目前小分子药物约占市场总量的近90%的治疗药物研发管线。研究表明,每年核准的新药中约有60%是小分子药物。这一趋势是由该领域的快速成长所驱动的,而快速成长又源于对高效、个人化疗法的日益增长的需求。此外,小分子药物也面临许多挑战,尤其是在其生产过程中涉及的无菌填充环节。无菌灌装是药品生产的关键步骤。在此阶段保持无菌状态对于患者安全以及确保产品品质和疗效至关重要。此外,使用小分子药物的新製剂需要专门的工具和专业知识,这会增加生产成本。因此,许多药物研发商倾向于将最终灌装工序外包给合约服务提供者。
由于对专业知识和高效生产製程的需求,不断扩展的小分子药物研发管线及其日益复杂的特性,正在推动製药业对专业最终灌装生产服务的需求。
最终灌装药品合约生产市场关键洞察
本报告深入分析了最终灌装药品合约生产市场的现状,并指出了该行业的潜在成长机会。主要发现包括:
- 目前,近390家机构提供最终灌装药品合约生产服务,其中大多数合约生产商提供无菌灌装服务。
- 西林瓶(63%)已成为应用最广泛的初级包装形式。近85%的公司具备灌装液体製剂作为最终剂型的必要能力。
- 目前成品药合约生产(CMO)市场格局高度分散,主要地区既有新进者,也有老牌企业。
- 为了获得竞争优势,产业参与者正积极升级现有能力并增加新能力,以强化各自的产品组合。
- 全球药品灌装产能分布在世界各地的不同工厂,大型和超大型企业占了总产能的80%。
- 预计到2035年,成品药灌装合约生产市场将保持稳定成长,其中终端灭菌预计将在不久的将来占市场占有率的大部分(超过40%)。
- 从长远来看,安瓿瓶和西林瓶预计将推动最终灌装药品合约生产市场的成长,其中西林瓶细分市场预计到2035年将占大部分市场占有率(50%)。
最终灌装药品合约生产市场的主要细分市场
目前,终端灭菌细分市场在最终灌装药品合约生产市场中占最大占有率。
根据所提供的最终灌装服务类型,该市场可细分为无菌填充、原位填充 (BFS) 和终端灭菌。 值得注意的是,终端灭菌技术预计在未来十年主导市场。这是因为终端灭菌技术能够确保无菌性,并提高可靠性和成本效益。
通用名製剂(FDF)在最终灌装合约生产市场中占最大占有率。
依FDF类型划分,市场分为通用名製剂及原厂製剂。值得注意的是,通用名製剂预计在未来十年主导市场。这得益于其具竞争力的价格、成本效益以及合约生产商所坚持的品质标准。
目前,低效价原料药(API)在最终灌装合约生产市场中占最大占有率。
依API强度划分,市场分为低效价API和高效价API。由于需求量大、生产要求相对简单且整体生产成本较低,低效价API目前在最终灌装合约生产市场中占主导地位。
预计在预测期内,预灌封注射器市场将以较高的复合年增长率成长。
依初级包装类型划分,市场可分为安瓿、药筒、预灌封注射器、小瓶和其他容器。值得注意的是,安瓿目前在最终灌装药品合约生产市场中占较大占有率。
按业务规模划分,预计在预测期内,商业规模将主导最终灌装药品合约生产市场。
依业务规模划分,市场可分为临床规模及商业规模。值得注意的是,目前商业规模小分子药物灌装服务产生的收入在最终灌装药品合约生产市场中占最大占有率。
大型和超大型服务提供者在最终灌装药品合约生产市场中占最大占有率。
依公司规模划分,市场分为中小企业及大型及超大型企业。值得注意的是,未来十年,大型和超大型服务提供者很可能主导最终灌装药品合约生产市场。这得归功于他们专业且技能娴熟的员工队伍、创新的填充/包装设施以及强大的监管能力。
欧洲将占最大的市场占有率。
依地区划分,市场分为北美、欧洲、亚太、拉丁美洲、中东和非洲以及世界其他地区。虽然欧洲目前占大部分市场占有率,但预计世界其他地区的市场将以更高的复合年增长率成长。
进入最终灌装药品合约生产市场的公司范例
- Alcami
- Amanta Healthcare
- Aurigene Pharmaceutical Services
- Batterjee Pharma
- Burrard Pharmaceuticals
- Curida
- Eriochem
- Fresenius Kabi
- GlaxoSmithKline
- Nextar Chempharma Solutions
- Pfizer CentreOne
- Plastikon Healthcare
- Procaps
- Recipharm
- ROMMELAG CMO
- Sharp
- Sypharma
- Teva Pharmaceuticals
- WuXi AppTec
最终灌装药品合约生产市场研究报告
- 市场规模和机会分析:本报告提供详细的市场规模估算本报告对小分子药物最终灌装合约製药市场进行了全面评估,重点关注以下关键细分市场:[A] 提供的最终灌装服务类型,[B] 成品剂型,[C] 原料药浓度,[D] 初级包装容器类型,[B] 成品剂型,[C] 原料药浓度,[D] 初级包装容器类型,[E] 业务规模,[E] 业务规模。
- 市场概况:本报告对参与最终灌装合约製药生产的公司进行了全面评估,考虑了以下各项参数:[A] 成立年份,[B] 公司规模(基于员工人数),[C] 总部所在地,[D] 生产设施所在地,[E] 业务规模,[F] 提供的最终灌装服务类型,[D] 生产设施所在地,[E] 成品,[F] 提供的最终
- 竞争分析:本报告深入分析了小分子药物最终灌装合约製药生产商的竞争格局,并考察了公司实力、产品组合实力和产品组合多样性等因素。
- 公司简介:本报告提供北美、欧洲、亚太及其他地区主要最终灌装合约製药企业的简介,重点关注[A]公司概况、[B]财务资讯(如有)、[C]服务组合、[D]近期发展以及[E]未来展望。
- 产能分析:本报告提供全球小分子药物年度最终灌装产能的估算。各种包装容器(安瓿、卡式、注射器和西林瓶)的可用产能按[A]公司规模和[B]主要地区进行划分。
- 案例研究1:本报告包含一个案例研究,探讨了在无菌最终灌装製程中使用机器人/自动化设备的优势。此外,还列出了提供适用于製药操作的机器人的设备製造商。
- 案例研究2:本报告包含一个案例研究,重点在于包装在无菌最终填充製程中的作用。此外,还列出了提供即用型组件的供应商。
- 成长推动因素和阻碍因素:本报告分析了影响市场成长的各种因素,包括推动因素、阻碍因素、市场推动因素和挑战。
目录
第1章 序文
第2章 调查手法
第3章 市场动态
- 章概要
- 预测调查手法
- 市场评估组成架构
- 预测工具和技巧
- 重要的考虑事项
- 主要的市场区隔
- 坚牢的品管
- 限制事项
第4章 经济以及其他的计划特有的考虑事项
第5章 摘要整理
第6章 简介
- 章概要
- 低分子化合物的最后填充服务的简介
- 无菌填充
- 末端杀菌
- BFS(成型同时填充)技术
- 低分子相关业务的外包的必要性
- 低分子化合物产业的契约製造商所扮演的角色
- 最后填充服务供应商选择时应该考虑的重点
- 最后填充服务的外包的优点
- 最后填充业务的外包的风险与课题
- 未来展望
第7章 市场形势
- 章概要
- 低分子最后填充服务供应商:市场形势
第8章 企业简介北美的服务供应商
- 章概要
- 北美低分子最后填充服务供应商
- Alcami
- Pfizer CentreOne
- Sharp Services
- 其他的企业
- Burrard Pharmaceuticals
- Plastikon Healthcare
第9章 企业简介:欧洲的服务供应商
- 章概要
- 欧洲低分子最后填充服务供应商
- Fresenius Kabi
- GlaxoSmithKline
- Recipharm
- 其他的企业
- Curida
- ROMMELAG CMO
第10章 企业简介:亚太地区的服务供应商
- 章概要
- 亚太地区低分子最后填充服务供应商
- Aurigene Pharmaceutical Services
- Sypharma
- WuXi AppTec
- 其他的企业
- Amanta Healthcare
第11章 企业简介:其他地区的服务供应商
- 章概要
- 其他地区的低分子最后填充服务供应商
- Eriochem
- Teva Pharmaceutical Industries
- 其他的企业
- Batterjee Pharma
- Procaps
第12章 企业竞争力分析
第13章 容量分析
第14章 案例研究:填充/最后润饰工作的机器人系统
第15章 案例研究:无菌最后填充用马上能使用的包装零件
第16章 市场影响分析:促进因素,阻碍因素,机会,课题
第17章 全球最后填充医药品受託製造市场
第18章 最后填充医药品受託製造市场(各提供最后填充服务形式)
第19章 最后填充医药品受託製造市场(各FDF类型)
第20章 最后填充医药品受託製造市场(API效力)
第21章 最后填充医药品受託製造市场(一次用包装容器各类型)
第22章 最后填充医药品受託製造市场(各产业规模)
第23章 最后填充医药品受託製造市场(不同企业规模)
第24章 最后填充医药品受託製造市场(各地区)
第25章 最后填充医药品受託製造市场(各主要企业)
第26章 结论
第27章 执行洞察
第28章 附录I:表资料
第29章 附录II:企业及组织一览
Fill Finish Pharmaceutical Contract Manufacturing Market: Overview
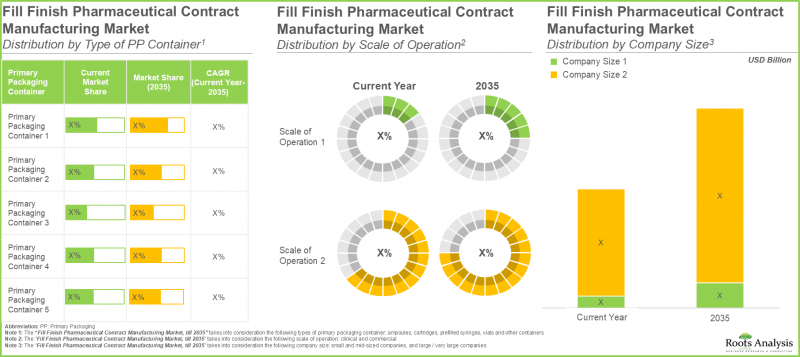
As per Roots Analysis, the global fill finish pharmaceutical contract manufacturing market is estimated to grow from USD 7.5 billion in the current year to USD 12.1 billion by 2035, at a CAGR of 4.8% during the forecast period, till 2035.
Fill Finish Pharmaceutical Contract Manufacturing Market
The market opportunity has been distributed across the following segments:
Type of Fill Finish Service Offered
- Aseptic Filling
- Blow-Fill-Seal
- Terminal Sterilization
Type of FDF
- Generic FDF
- Originator FDF
API Potency
- Low Potent API
- High Potent API
Type of Primary Packaging Container
- Ampoules
- Cartridges
- Prefilled Syringe
- Vials
- Other Containers
Scale of Operation
- Clinical
- Commercial
Company Size
- Small and Mid-sized Companies
- Large / Very Large Companies
Key Geographical Regions
- North America
- Europe
- Asia-Pacific
- Latin America
- Middle East and North Africa
Fill Finish Pharmaceutical Contract Manufacturing Market: Growth and Trends
Currently, small molecule drugs constitute nearly 90% of the therapeutic pipeline. Research suggests that about 60% of the new drugs approved each year are small molecules. This trend stems from the rapid growth in this field, driven by the increasing demand for effective and personalized treatments. In addition, small molecules present various challenges, especially in the sterile fill-finish process involved in their production. The sterile fill-finish stage is a critical step in pharmaceutical manufacturing. It is important to maintain aseptic conditions during this phase for patient safety and to ensure the product's quality and effectiveness. Further, new formulations using small molecules need specialized tools and expertise, which can increase production costs. As a result, many drug developers prefer outsourcing their fill-finish operations to contract service providers.
Driven by the need for specialized knowledge and efficient production processes, the expanding pipeline and rising complexity of small molecule drugs have increased the demand for specialized fill-finish manufacturing services in the pharmaceutical sector.
Fill Finish Pharmaceutical Contract Manufacturing Market: Key Insights
The report delves into the current state of the fill finish pharmaceutical contract manufacturing market and identifies potential growth opportunities within the industry. Some key findings from the report include:
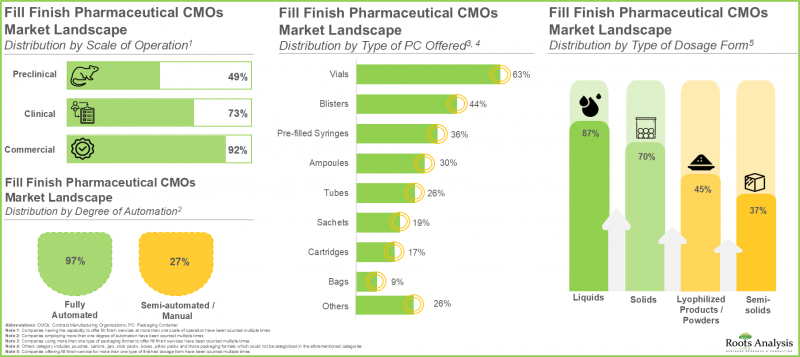
- Presently, close to 390 organizations offer fill finish pharmaceutical contract manufacturing services; of these, majority of the contract manufacturing organizations offer aseptic filling services.
- Vials (63%) have emerged as the most adopted primary packaging container format; close to 85% of the players have the required capabilities to fill finish liquid formulations as the finished dosage form.
- The current market landscape of fill finish pharmaceutical CMOs is highly fragmented, featuring the presence of both new entrants and established players across key geographical regions.
- In pursuit of obtaining a competitive edge, industry stakeholders are actively upgrading their existing capabilities and adding new competencies in order to enhance their respective product portfolios.
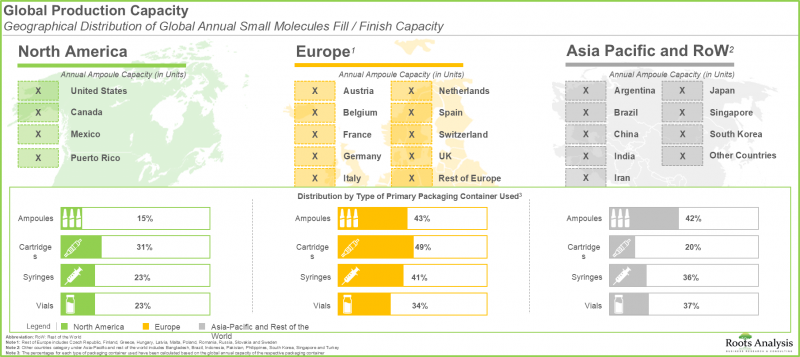
- The global pharmaceutical fill finish capacity is well distributed across different facilities worldwide; notably, large and very large players account for 80% of the total capacity.
- The fill finish pharmaceutical contract manufacturing market is anticipated to grow at a steady rate, till 2035; terminal sterilization is expected to capture the majority share (over 40%) of the market in foreseeable future.
- In the long term, ampoules and vials packaging formats are likely to drive the growth of fill finish pharmaceutical contract manufacturing market; vials segment is expected to capture the majority share (~50%) by 2035.
Fill Finish Pharmaceutical Contract Manufacturing Market: Key Segments
Currently, Terminal Sterilization Segment Occupies the Largest Share of the Fill Finish Pharmaceutical Contract Manufacturing Market
Based on the type of fill finish service offered, the market is segmented into aseptic filling, blow-fill-seal and terminal sterilization. It is worth highlighting that the terminal sterilization segment is likely to dominate the market in the coming decade. This can be attributed to the fact that terminal sterilization offers sterility assurance, making it more reliable and cost-effective.
Generic FDF Segment Holds Maximum Share of the Fill Finish Pharmaceutical Contract Manufacturing Market
Based on the type of FDF, the market is segmented into generic FDF and originator FDF. It is worth highlighting that the generic FDF segment is likely to dominate the market in the coming decade. This is a result of competitive pricing, cost effectiveness and quality standards maintained by contract manufacturers.
Currently, Low Potent API Segment Occupies the Largest Share of the Fill Finish Pharmaceutical Contract Manufacturing Market
Based on the type of API by potency, the market is segmented into low potent API and high potent API. Owing to their higher demand, less complex manufacturing requirements and lower overall production costs, the current fill finish pharmaceutical contract manufacturing market is dominated by low potent API.
Prefilled Syringes Segment is Likely to Grow at a Higher CAGR During the Forecast Period
Based on the type of primary packaging container, the market is segmented into ampoules, cartridges, prefilled syringe, vials and other containers. It is worth highlighting that, at present, the ampoules segment holds the larger share of the fill finish pharmaceutical contract manufacturing market.
By Scale of Operation, Commercial Scale is Likely to Dominate the Fill Finish Pharmaceutical Contract Manufacturing Market During the Forecast Period
Based on the scale of operation, the market is segmented into clinical and commercial scale. It is worth highlighting that, at present, revenues generated from commercial scale small molecules fill finish services hold maximum share in the fill finish pharmaceutical contract manufacturing market.
Large / Very Large Service Providers Accounts for the Largest Share for the Fill Finish Pharmaceutical Contract Manufacturing Market
Based on the company size, the market is segmented into small and mid-sized companies and large / very large companies. It is worth highlighting that large / very large service providers are likely to dominate the fill finish pharmaceutical contract manufacturing market in the coming decade. This can be attributed to the fact that these companies have dedicated and skilled personnel, innovative fill / finish facilities and robust regulatory capabilities.
Europe Accounts for the Largest Share of the Market
Based on key geographical regions, the market is segmented into North America, Europe, Asia-Pacific, Latin America, Middle East and North Africa, and rest of the world. Currently, Europe captures the majority of the market share; however the market in rest of the world is expected to grow at a higher CAGR.
Example Players in the Fill Finish Pharmaceutical Contract Manufacturing Market
- Alcami
- Amanta Healthcare
- Aurigene Pharmaceutical Services
- Batterjee Pharma
- Burrard Pharmaceuticals
- Curida
- Eriochem
- Fresenius Kabi
- GlaxoSmithKline
- Nextar Chempharma Solutions
- Pfizer CentreOne
- Plastikon Healthcare
- Procaps
- Recipharm
- ROMMELAG CMO
- Sharp
- Sypharma
- Teva Pharmaceuticals
- WuXi AppTec
Fill Finish Pharmaceutical Contract Manufacturing Market: Research Coverage
- Market Sizing and Opportunity Analysis: The report features a detailed market size estimation for fill finish pharmaceutical contract manufacturing market (for small molecules), focusing on key market segments, including [A] type of fill finish service offered, [B] type of FDF, [C] API potency, [D] type of primary packaging container, [E] scale of operation, [F] company size and [G] geographical regions.
- Market Landscape: The report presents comprehensive evaluation of companies involved in fill finish pharmaceutical contract manufacturing, considering various parameters, such as [A] year of establishment, [B] company size (based on number of employees), [C] location of headquarters, [D] location of manufacturing facility, [E] scale of operation, [F] type of fill finish service offered, [G] type of finishing service offered [H] type of packaging format, [I] type of finished dosage form, [J] degree of automation.
- Company Competitiveness Analysis: The report highlights a detailed competitive analysis of fill finish pharmaceutical contract manufacturers (for small molecules), examining factors, such as company strength, portfolio strength and portfolio diversity.
- Company Profiles: The report features and in-depth profiles of key fill finish pharmaceutical contract manufacturers based in North America, Europe, Asia-Pacific and rest of the world focusing on [A] company overviews, [B] financial information (if available), [C] service portfolio, [D] recent developments and [E] an informed future outlook.
- Capacity Analysis: The report provides an estimation of global annual small molecules fill finish capacity. The available capacity for various packaging containers used (ampoules, cartridges, syringes and vials) has been segmented across [A] company size and [B] key geographical regions.
- Case Study 1: The report includes a case study discussing the advantages of using robotic / automated equipment for aseptic fill finish processes. In addition, it includes a list of equipment manufacturers providing robots suitable for pharmaceutical operations.
- Case Study 2: The report contains a case study featuring the role of ready-to-use packaging containers in aseptic fill finish operations. In addition, it provides a list of suppliers providing the ready-to-use components.
- Growth Drivers and Restraints: The report analyzes various factors such as drivers, restraints, opportunities, and challenges affecting market growth.
Key Questions Answered in this Report
- How many companies are currently engaged in this market?
- Which are the leading CMOs in this market?
- What factors are likely to influence the evolution of this market?
- What is the current and future market size?
- What is the CAGR of this market?
- How is the current and future market opportunity likely to be distributed across key market segments?
Reasons to Buy this Report
- The report provides a comprehensive market analysis, offering detailed revenue projections of the overall market and its specific sub-segments. This information is valuable to both established market leaders and emerging entrants.
- Stakeholders can leverage the report to gain a deeper understanding of the competitive dynamics within the market. By analyzing the competitive landscape, businesses can make informed decisions to optimize their market positioning and develop effective go-to-market strategies.
- The report offers stakeholders a comprehensive overview of the market, including key drivers, barriers, opportunities, and challenges. This information empowers stakeholders to stay abreast of market trends and make data-driven decisions to capitalize on growth prospects.
Additional Benefits
- Complimentary PPT Insights Packs
- Complimentary Excel Data Packs for all Analytical Modules in the Report
- 15% Free Content Customization
- Detailed Report Walkthrough Session with Research Team
- Free Updated report if the report is 6-12 months old or older
TABLE OF CONTENTS
1. PREFACE
- 1.1. Introduction
- 1.2. Market Share Insights
- 1.3. Key Market Insights
- 1.4. Report Coverage
- 1.5. Key Questions Answered
- 1.6. Chapter Outlines
2. RESEARCH METHODOLOGY
- 2.1. Chapter Overview
- 2.2. Research Assumptions
- 2.2.1. Market Landscape and Market Trends
- 2.2.2. Market Forecast and Opportunity Analysis
- 2.2.3. Comparative Analysis
- 2.3. Database Building
- 2.3.1. Data Collection
- 2.3.2. Data Validation
- 2.3.3. Data Analysis
- 2.4. Project Methodology
- 2.4.1. Secondary Research
- 2.4.1.1. Annual Reports
- 2.4.1.2. Academic Research Papers
- 2.4.1.3. Company Websites
- 2.4.1.4. Investor Presentations
- 2.4.1.5. Regulatory Filings
- 2.4.1.6. White Papers
- 2.4.1.7. Industry Publications
- 2.4.1.8. Conferences and Seminars
- 2.4.1.9. Government Portals
- 2.4.1.10. Media and Press Releases
- 2.4.1.11. Newsletters
- 2.4.1.12. Industry Databases
- 2.4.1.13. Roots Proprietary Databases
- 2.4.1.14. Paid Databases and Sources
- 2.4.1.15. Social Media Portals
- 2.4.1.16. Other Secondary Sources
- 2.4.2. Primary Research
- 2.4.2.1. Types of Primary Research
- 2.4.2.1.1. Qualitative Research
- 2.4.2.1.2. Quantitative Research
- 2.4.2.1.3. Hybrid Approach
- 2.4.2.2. Advantages of Primary Research
- 2.4.2.3. Techniques for Primary Research
- 2.4.2.3.1. Interviews
- 2.4.2.3.2. Surveys
- 2.4.2.3.3. Focus Groups
- 2.4.2.3.4. Observational Research
- 2.4.2.3.5. Social Media Interactions
- 2.4.2.4. Key Opinion Leaders Considered in Primary Research
- 2.4.2.4.1. Company Executives (CXOs)
- 2.4.2.4.2. Board of Directors
- 2.4.2.4.3. Company Presidents and Vice Presidents
- 2.4.2.4.4. Research and Development Heads
- 2.4.2.4.5. Technical Experts
- 2.4.2.4.6. Subject Matter Experts
- 2.4.2.4.7. Scientists
- 2.4.2.4.8. Doctors and Other Healthcare Providers
- 2.4.2.5. Ethics and Integrity
- 2.4.2.5.1. Research Ethics
- 2.4.2.5.2. Data Integrity
- 2.4.2.1. Types of Primary Research
- 2.4.3. Analytical Tools and Databases
- 2.4.1. Secondary Research
3. MARKET DYNAMICS
- 3.1. Chapter Overview
- 3.2. Forecast Methodology
- 3.2.1. Top-down Approach
- 3.2.2. Bottom-up Approach
- 3.2.3. Hybrid Approach
- 3.3. Market Assessment Framework
- 3.3.1. Total Addressable Market (TAM)
- 3.3.2. Serviceable Addressable Market (SAM)
- 3.3.3. Serviceable Obtainable Market (SOM)
- 3.3.4. Currently Acquired Market (CAM)
- 3.4. Forecasting Tools and Techniques
- 3.4.1. Qualitative Forecasting
- 3.4.2. Correlation
- 3.4.3. Regression
- 3.4.4. Extrapolation
- 3.4.5. Convergence
- 3.4.6. Sensitivity Analysis
- 3.4.7. Scenario Planning
- 3.4.8. Data Visualization
- 3.4.9. Time Series Analysis
- 3.4.10. Forecast Error Analysis
- 3.5. Key Considerations
- 3.5.1. Demographics
- 3.5.2. Government Regulations
- 3.5.3. Reimbursement Scenarios
- 3.5.4. Market Access
- 3.5.5. Supply Chain
- 3.5.6. Industry Consolidation
- 3.5.7. Pandemic / Unforeseen Disruptions Impact
- 3.6. Key Market Segmentation
- 3.7. Robust Quality Control
- 3.8. Limitations
4. ECONOMIC AND OTHER PROJECT SPECIFIC CONSIDERATIONS
- 4.1. Chapter Overview
- 4.2. Market Dynamics
- 4.2.1. Time Period
- 4.2.1.1. Historical Trends
- 4.2.1.2. Current and Forecasted Estimates
- 4.2.2. Currency Coverage
- 4.2.2.1. Overview of Major Currencies Affecting the Market
- 4.2.2.2. Impact of Currency Fluctuations on the Industry
- 4.2.3. Foreign Exchange Impact
- 4.2.3.1. Evaluation of Foreign Exchange Rates and Their Impact on Market
- 4.2.3.2. Strategies for Mitigating Foreign Exchange Risk
- 4.2.4. Recession
- 4.2.4.1. Historical Analysis of Past Recessions and Lessons Learnt
- 4.2.4.2. Assessment of Current Economic Conditions and Potential Impact on the Market
- 4.2.5. Inflation
- 4.2.5.1. Measurement and Analysis of Inflationary Pressures in the Economy
- 4.2.5.2. Potential Impact of Inflation on the Market Evolution
- 4.2.1. Time Period
5. EXECUTIVE SUMMARY
6. INTRODUCTION
- 6.1. Chapter Overview
- 6.2. Introduction to Fill / Finish Services for Small Molecules
- 6.2.1. Aseptic Filling
- 6.2.2. Terminal Sterilization
- 6.2.3. Blow-Fill-Seal Technology
- 6.3. Need for Outsourcing Small Molecules-related Operations
- 6.4. Role of Contract Manufacturers in the Small Molecules Industry
- 6.5. Key Considerations while selecting a Fill / Finish Service Provider
- 6.6. Advantages of Outsourcing Fill / Finish Services
- 6.7. Risks and Challenges of Outsourcing Fill / Finish Operations
- 6.8. Future Perspectives
7. MARKET LANDSCAPE
- 7.1. Chapter Overview
- 7.2. Small Molecules Fill / Finish Service Providers: Overall Market Landscape
- 7.2.1. Analysis by Year of Establishment
- 7.2.2. Analysis by Company Size
- 7.2.3. Analysis by Location of Headquarters
- 7.2.4. Analysis by Location of Fill / Finish Facilities
- 7.2.5. Analysis by Scale of Operation
- 7.2.6. Analysis by Type of Filling Service Offered
- 7.2.7. Analysis by Type of Finishing Service Offered
- 7.2.8. Analysis by Type of Packaging Format Used
- 7.2.9. Analysis by Type of Finished Dosage Form
- 7.2.10. Analysis by Degree of Automation
8. COMPANY PROFILES: SERVICE PROVIDERS IN NORTH AMERICA
- 8.1. Chapter Overview
- 8.2. Leading Small Molecules Fill / Finish Service Providers based in North America
- 8.2.1. Alcami
- 8.2.1.1. Company Overview
- 8.2.1.2. Small Molecules Fill / Finish Service Portfolio
- 8.2.1.3. Recent Developments and Future Outlook
- 8.2.2. Pfizer CentreOne
- 8.2.2.1. Company Overview
- 8.2.2.2. Small Molecules Fill / Finish Service Portfolio
- 8.2.2.3. Recent Developments and Future Outlook
- 8.2.3. Sharp Services
- 8.2.3.1. Company Overview
- 8.2.3.2. Small Molecules Fill / Finish Service Portfolio
- 8.2.3.3. Recent Developments and Future Outlook
- 8.2.1. Alcami
- 8.3. Other Leading Small Molecules Fill / Finish Service Providers based in North America
- 8.3.1. Burrard Pharmaceuticals
- 8.3.1.1. Company Overview
- 8.3.1.2. Small Molecules Fill / Finish Service Portfolio
- 8.3.2. Plastikon Healthcare
- 8.3.2.1. Company Overview
- 8.3.2.2. Small Molecules Fill / Finish Service Portfolio
- 8.3.1. Burrard Pharmaceuticals
9. COMPANY PROFILES: SERVICE PROVIDERS IN EUROPE
- 9.1. Chapter Overview
- 9.2. Leading Small Molecules Fill / Finish Service Providers based in Europe
- 9.2.1. Fresenius Kabi
- 9.2.1.1. Company Overview
- 9.2.1.2. Financial Information
- 9.2.1.3. Small Molecules Fill / Finish Service Portfolio
- 9.2.1.4. Recent Developments and Future Outlook
- 9.2.2. GlaxoSmithKline
- 9.2.2.1. Company Overview
- 9.2.2.2. Financial Information
- 9.2.2.3. Small Molecules Fill / Finish Service Portfolio
- 9.2.2.4. Recent Developments and Future Outlook
- 9.2.3. Recipharm
- 9.2.3.1. Company Overview
- 9.2.3.2. Small Molecules Fill / Finish Service Portfolio
- 9.2.3.3. Recent Developments and Future Outlook
- 9.2.1. Fresenius Kabi
- 9.3. Other Leading Small Molecules Fill / Finish Service Providers based in Europe
- 9.3.1. Curida
- 9.3.1.1. Company Overview
- 9.3.1.2. Small Molecules Fill / Finish Service Portfolio
- 9.3.2. ROMMELAG CMO
- 9.3.2.1. Company Overview
- 9.3.2.2. Small Molecules Fill / Finish Service Portfolio
- 9.3.1. Curida
10. COMPANY PROFILES: SERVICE PROVIDERS IN ASIA-PACIFIC
- 10.1. Chapter Overview
- 10.2. Leading Small Molecules Fill / Finish Service Providers based in Asia-Pacific
- 10.2.1. Aurigene Pharmaceutical Services
- 10.2.1.1. Company Overview
- 10.2.1.2. Small Molecules Fill / Finish Service Portfolio
- 10.2.1.3. Recent Developments and Future Outlook
- 10.2.2. Sypharma
- 10.2.2.1. Company Overview
- 10.2.2.2. Small Molecules Fill / Finish Service Portfolio
- 10.2.2.3. Recent Developments and Future Outlook
- 10.2.3. WuXi AppTec
- 10.2.3.1. Company Overview
- 10.2.3.2. Small Molecules Fill / Finish Service Portfolio
- 10.2.3.3. Recent Developments and Future Outlook
- 10.2.1. Aurigene Pharmaceutical Services
- 10.3. Other Small Molecules Fill / Finish Service Providers based in Asia-Pacific
- 10.3.1. Amanta Healthcare
- 10.3.1.1. Company Overview
- 10.3.1.2. Small Molecules Fill / Finish Service Portfolio
- 10.3.1. Amanta Healthcare
11. COMPANY PROFILES: SERVICE PROVIDERS IN REST OF THE WORLD
- 11.1. Chapter Overview
- 11.2. Leading Small Molecules Fill / Finish Service Providers based in Rest of the World
- 11.2.1. Eriochem
- 11.2.1.1. Company Overview
- 11.2.1.2. Small Molecules Fill / Finish Service Portfolio
- 11.2.1.3. Recent Developments and Future Outlook
- 11.2.2. Teva Pharmaceutical Industries
- 11.2.2.1. Company Overview
- 11.2.2.2. Small Molecules Fill / Finish Service Portfolio
- 11.2.2.3. Recent Developments and Future Outlook
- 11.2.1. Eriochem
- 11.3. Other Small Molecules Fill / Finish Service Providers based in Rest of the World
- 11.3.1. Batterjee Pharma
- 11.3.1.1. Company Overview
- 11.3.1.2. Small Molecules Fill / Finish Service Portfolio
- 11.3.2. Procaps
- 11.3.2.1. Company Overview
- 11.3.2.2. Small Molecules Fill / Finish Service Portfolio
- 11.3.1. Batterjee Pharma
12. COMPANY COMPETITIVENESS ANALYSIS
- 12.1. Chapter Overview
- 12.2. Assumptions and Key Parameters
- 12.3. Methodology
- 12.4. Small Molecules Fill / Finish Service Providers based in North America
- 12.5. Small Molecules Fill / Finish Service Providers based in Europe
- 12.6. Small Molecules Fill / Finish Service Providers based in Asia-Pacific and Rest of the World
13. CAPACITY ANALYSIS
- 13.1. Chapter Overview
- 13.2. Global Annual Small Molecules Fill / Finish Capacity for Ampoules (Number of Units)
- 13.2.1. Key Assumptions and Methodology
- 13.2.2. Analysis by Company Size
- 13.2.3. Analysis by Geography
- 13.2.3.1. Analysis of Small Molecules Fill / Finish Capacity for Ampoules in North America
- 13.2.3.2. Analysis of Small Molecules Fill / Finish Capacity for Ampoules in Europe
- 13.2.3.3. Analysis of Small Molecules Fill / Finish Capacity for Ampoules in Asia-Pacific and Rest of the World
- 13.3. Global Annual Small Molecules Fill / Finish Capacity for Cartridges (Number of Units)
- 13.3.1. Key Assumptions and Methodology
- 13.3.2. Analysis by Company Size
- 13.3.3. Analysis by Geography
- 13.3.3.1. Analysis of Small Molecules Fill / Finish Capacity for Cartridges in North America
- 13.3.3.2. Analysis of Small Molecules Fill / Finish Capacity for Cartridges in Europe
- 13.3.3.3. Analysis of Small Molecules Fill / Finish Capacity for Cartridges in Asia-Pacific and Rest of the World
- 13.4. Global Annual Small Molecules Fill / Finish Capacity for Prefilled Syringes (Number of Units)
- 13.4.1. Key Assumptions and Methodology
- 13.4.2. Analysis by Company Size
- 13.4.3. Analysis by Geography
- 13.4.3.1. Analysis of Small Molecules Fill / Finish Capacity for Prefilled Syringes in North America
- 13.4.3.2. Analysis of Small Molecules Fill / Finish Capacity for Prefilled Syringes in Europe
- 13.4.3.3. Analysis of Small Molecules Fill / Finish Capacity for Prefilled Syringes in Asia-Pacific and Rest of the World
- 13.5. Global Annual Small Molecules Fill / Finish Capacity for Vials (Number of Units)
- 13.5.1. Key Assumptions and Methodology
- 13.5.2. Analysis by Company Size
- 13.5.3. Analysis by Geography
- 13.5.3.1. Analysis of Small Molecules Fill / Finish Capacity for Vials in North America
- 13.5.3.2. Analysis of Small Molecules Fill / Finish Capacity for Vials in Europe
- 13.5.3.3. Analysis of Small Molecules Fill / Finish Capacity for Vials in Asia-Pacific and Rest of the World
14. CASE STUDY: ROBOTIC SYSTEMS IN FILL / FINISH OPERATIONS
- 14.1. Chapter Overview
- 14.2. Role of Robotic Systems in Fill / Finish Operations
- 14.2.1. Types of Robots Used
- 14.2.2. Key Considerations for Selecting Robotic Systems
- 14.3. Companies Providing Robots for use in the Pharmaceutical Industry
- 14.4. Companies Providing Isolator- based Aseptic Filling Systems
- 14.5. Small Molecules Fill / Finish Service Providers: List of Equipment Used
- 14.6. Concluding Remarks
15. CASE STUDY: READY-TO-USE PACKAGING COMPONENTS FOR ASEPTIC FILL / FINISH
- 15.1. Chapter Overview
- 15.2. Role of Ready-to-Use Packaging Components in Aseptic Fill / Finish Operations
- 15.2.1. Advantages of Ready-to-Use Packaging Components
- 15.2.2. Disadvantages of Ready-to-Use Packaging Components
- 15.3. Companies Providing Ready-to-Use Packaging Components
- 15.4. Concluding Remarks
16. MARKET IMPACT ANALYSIS: DRIVERS, RESTRAINTS, OPPORTUNITIES AND CHALLENGES
- 16.1. Chapter Overview
- 16.2. Market Drivers
- 16.3. Market Restraints
- 16.4. Market Opportunities
- 16.5. Market Challenges
- 16.6. Conclusion
17. GLOBAL PHARMACEUTICAL FILL / FINISH MANUFACTURING MARKET
- 17.1. Chapter Overview
- 17.2. Assumptions and Methodology
- 17.3. Global Pharmaceutical Fill / Finish Manufacturing Market, till 2035
- 17.3.1. Scenario Analysis
- 17.3.1.1. Conservative Scenario
- 17.3.1.2. Optimistic Scenario
- 17.3.1. Scenario Analysis
- 17.4. Key Market Segmentations
18. PHARMACEUTICAL FILL / FINISH MANUFACTURING MARKET, BY TYPE OF FILL / FINISH SERVICE OFFERED
- 18.1. Chapter Overview
- 18.2. Assumptions and Methodology
- 18.3. Pharmaceutical Fill / Finish Manufacturing Market: Distribution by Type of Fill / Finish Service Offered, 2019, Current Year and 2035
- 18.3.1. Pharmaceutical Fill / Finish Manufacturing Market for Terminal Sterilization, till 2035
- 18.3.2. Pharmaceutical Fill / Finish Manufacturing Market for Aseptic Filling, till 2035
- 18.3.3. Pharmaceutical Fill / Finish Manufacturing Market for Blow-Fill-Seal, till 2035
- 18.4. Pharmaceutical Fill / Finish Manufacturing Market, by Type of Fill / Finish Services Offered: Market Dynamics Assessment
- 18.4.1. Penetration-Growth (P-G) Matrix
- 18.4.2. Data Triangulation and Validation
19. PHARMACEUTICAL FILL / FINISH MANUFACTURING MARKET, BY TYPE OF FDF
- 19.1. Chapter Overview
- 19.2. Assumptions and Methodology
- 19.3. Pharmaceutical Fill / Finish Manufacturing Market: Distribution by Type of FDF, 2019, Current Year and 2035
- 19.3.1. Pharmaceutical Fill / Finish Manufacturing Market for Generic FDF, till 2035
- 19.3.2. Pharmaceutical Fill / Finish Manufacturing Market for Originator FDF, till 2035
- 19.4. Pharmaceutical Fill / Finish Manufacturing Market, by Type of FDF: Market Dynamics Assessment
- 19.4.1. Penetration-Growth (P-G) Matrix
- 19.4.2. Data Triangulation and Validation
20. PHARMACEUTICAL FILL / FINISH MANUFACTURING MARKET, BY API POTENCY
- 20.1. Chapter Overview
- 20.2. Assumptions and Methodology
- 20.3. Pharmaceutical Fill / Finish Manufacturing Market: Distribution by API Potency, 2019, Current Year and 2035
- 20.3.1. Pharmaceutical Fill / Finish Manufacturing Market for Low Potent API, till 2035
- 20.3.2. Pharmaceutical Fill / Finish Manufacturing Market for High Potent API, till 2035
- 20.4. Pharmaceutical Fill / Finish Manufacturing Market, by API Potency: Market Dynamics Assessment
- 20.4.1. Penetration-Growth (P-G) Matrix
- 20.4.2. Data Triangulation and Validation
21. PHARMACEUTICAL FILL / FINISH MANUFACTURING MARKET, BY TYPE OF PRIMARY PACKAGING CONTAINER
- 21.1. Chapter Overview
- 21.2. Assumptions and Methodology
- 21.3. Pharmaceutical Fill / Finish Manufacturing Market: Distribution by Type of Primary Packaging Container, 2019, Current Year and 2035
- 21.3.1. Pharmaceutical Fill / Finish Manufacturing Market for Vials, till 2035
- 21.3.2. Pharmaceutical Fill / Finish Manufacturing Market for Ampoules, till 2035
- 21.3.3. Pharmaceutical Fill / Finish Manufacturing Market for Prefilled Syringes, till 2035
- 21.3.4. Pharmaceutical Fill / Finish Manufacturing Market for Cartridges, till 2035
- 21.3.5. Pharmaceutical Fill / Finish Manufacturing Market for Other Containers, till 2035
- 21.4. Pharmaceutical Fill / Finish Manufacturing Market, by Type of Primary Packaging Container: Market Dynamics Assessment
- 21.4.1. Penetration-Growth (P-G) Matrix
- 21.4.2. Data Triangulation and Validation
22. PHARMACEUTICAL FILL / FINISH MANUFACTURING MARKET, BY SCALE OF OPERATION
- 22.1. Chapter Overview
- 22.2. Assumptions and Methodology
- 22.3. Pharmaceutical Fill / Finish Manufacturing Market: Distribution by Scale of Operation, 2019, Current Year and 2035
- 22.3.1. Pharmaceutical Fill / Finish Manufacturing Market for Clinical Scale, till 2035
- 22.3.2. Pharmaceutical Fill / Finish Manufacturing Market for Commercial Scale, till 2035
- 22.4. Pharmaceutical Fill / Finish Manufacturing Market, by Scale of Operation: Market Dynamics Assessment
- 22.4.1. Penetration-Growth (P-G) Matrix
- 22.4.2. Data Triangulation and Validation
23. PHARMACEUTICAL FILL / FINISH MANUFACTURING MARKET, BY COMPANY SIZE
- 23.1. Chapter Overview
- 23.2. Assumptions and Methodology
- 23.3. Pharmaceutical Fill / Finish Manufacturing Market: Distribution by Company Size, 2019, Current Year and 2035
- 23.3.1. Pharmaceutical Fill / Finish Manufacturing Market for Small and Mid-sized Companies, till 2035
- 23.3.2. Pharmaceutical Fill / Finish Manufacturing Market for Large / Very Large Companies, till 2035
- 23.4. Pharmaceutical Fill / Finish Manufacturing Market, by Company Size: Market Dynamics Assessment
- 23.4.1. Penetration-Growth (P-G) Matrix
- 23.4.2. Data Triangulation and Validation
24. PHARMACEUTICAL FILL / FINISH MANUFACTURING MARKET, BY GEOGRAPHICAL REGIONS
- 24.1. Chapter Overview
- 24.2. Assumptions and Methodology
- 24.3. Pharmaceutical Fill / Finish Manufacturing Market: Distribution by Geographical Regions, 2019, Current Year and 2035
- 24.3.1. Pharmaceutical Fill / Finish Manufacturing Market in North America, till 2035
- 24.3.1.1. Pharmaceutical Fill / Finish Manufacturing Market in the US, till 2035
- 24.3.1.2. Pharmaceutical Fill / Finish Manufacturing Market in Canada, till 2035
- 24.3.1.3. Pharmaceutical Fill / Finish Manufacturing Market in Mexico, till 2035
- 24.3.1.4. Pharmaceutical Fill / Finish Manufacturing Market in Puerto Rico, till 2035
- 24.3.2. Pharmaceutical Fill / Finish Manufacturing Market in Europe, till 2035
- 24.3.2.1. Pharmaceutical Fill / Finish Manufacturing Market in France, till 2035
- 24.3.2.2. Pharmaceutical Fill / Finish Manufacturing Market in Germany, till 2035
- 24.3.2.3. Pharmaceutical Fill / Finish Manufacturing Market in Italy, till 2035
- 24.3.2.4. Pharmaceutical Fill / Finish Manufacturing Market in the UK, till 2035
- 24.3.2.5. Pharmaceutical Fill / Finish Manufacturing Market in Spain, till 2035
- 24.3.2.6. Pharmaceutical Fill / Finish Manufacturing Market in Rest of Europe, till 2035
- 24.3.3. Pharmaceutical Fill / Finish Manufacturing Market in Asia-Pacific, till 2035
- 24.3.3.1. Pharmaceutical Fill / Finish Manufacturing Market in India, till 2035
- 24.3.3.2. Pharmaceutical Fill / Finish Manufacturing Market in Japan, till 2035
- 24.3.3.3. Pharmaceutical Fill / Finish Manufacturing Market in China, till 2035
- 24.3.3.4. Pharmaceutical Fill / Finish Manufacturing Market in Rest of Asia-Pacific, till 2035
- 24.3.4. Pharmaceutical Fill / Finish Manufacturing Market in Middle East and North Africa, till 2035
- 24.3.5. Pharmaceutical Fill / Finish Manufacturing Market in Latin America, till 2035
- 24.3.6. Pharmaceutical Fill / Finish Manufacturing Market in Rest of the World, till 2035
- 24.3.1. Pharmaceutical Fill / Finish Manufacturing Market in North America, till 2035
- 24.4. Pharmaceutical Fill / Finish Manufacturing Market, by Geographical Regions: Market Dynamics Assessment
- 24.4.1. Penetration-Growth (P-G) Matrix
- 24.4.2. Data Triangulation and Validation
25. PHARMACEUTICAL FILL / FINISH MANUFACTURING MARKET, BY LEADING PLAYERS
- 25.1. Chapter Overview
- 25.2. Leading Industry Players
26. CONCLUSION
27. EXECUTIVE INSIGHT
- 27.1. Chapter Overview
- 27.2. Company A
- 27.2.1. Company Snapshot
- 27.2.2. Interview Transcript: Senior Executive Director, Global Sales and Marketing
28. APPENDIX I: TABULATED DATA
29. APPENDIX II: LIST OF COMPANIES AND ORGANIZATIONS
List of Tables
- Table 7.1 Small Molecules Fill / Finish Service Providers: List of Companies
- Table 7.2 Small Molecules Fill / Finish Service Providers: Information on Scale of Operation, Type of Filling Service Offered and Type of Finishing Service Offered
- Table 7.3 Small Molecules Fill / Finish Service Providers: Information on Type of Packaging Format Used, Type of Finished Dosage Form and Degree of Automation
- Table 8.1 Small Molecules Fill / Finish Service Providers in North America: List of Companies Profiled
- Table 8.2 Alcami: Company Overview
- Table 8.3 Alcami: Small Molecules Fill / Finish Service Portfolio
- Table 8.4 Alcami: Recent Developments and Future Outlook
- Table 8.5 Pfizer CentreOne: Company Overview
- Table 8.6 Pfizer CentreOne: Small Molecules Fill / Finish Service Portfolio
- Table 8.7 Sharp Services: Company Overview
- Table 8.8 Sharp Services: Small Molecules Fill / Finish Service Portfolio
- Table 8.9 Sharp Services: Recent Developments and Future Outlook
- Table 8.10 Burrard Pharmaceuticals: Company Overview
- Table 8.11 Burrard Pharmaceuticals: Small Molecules Fill / Finish Service Portfolio
- Table 8.12 Plastikon Healthcare: Company Overview
- Table 8.13 Plastikon Healthcare: Small Molecules Fill / Finish Service Portfolio
- Table 9.1 Small Molecules Fill / Finish Service Providers: List of Companies Profiled
- Table 9.2 Fresenius Kabi: Company Overview
- Table 9.3 Fresenius Kabi: Small Molecules Fill / Finish Service Portfolio
- Table 9.4 Fresenius Kabi: Recent Developments and Future Outlook
- Table 9.5 GlaxoSmithKline: Company Overview
- Table 9.6 GlaxoSmithKline: Small Molecules Fill / Finish Service Portfolio
- Table 9.7 GlaxoSmithKline: Recent Developments and Future Outlook
- Table 9.8 Recipharm: Company Overview
- Table 9.9 Recipharm: Small Molecules Fill / Finish Service Portfolio
- Table 9.10 Recipharm: Recent Developments and Future Outlook
- Table 9.11 Curida: Company Overview
- Table 9.12 Curida: Small Molecules Fill / Finish Service Portfolio
- Table 9.13 ROMMELAG CMO: Company Overview
- Table 9.14 ROMMELAG CMO: Small Molecules Fill / Finish Service Portfolio
- Table 10.1 Small Molecules Fill / Finish Service Providers: List of Companies Profiled
- Table 10.2 Aurigene Pharmaceutical Services: Company Overview
- Table 10.3 Aurigene Pharmaceutical Services: Small Molecules Fill / Finish Service Portfolio
- Table 10.4 Aurigene Pharmaceutical Services: Recent Developments and Future Outlook
- Table 10.5 Sypharma: Company Overview
- Table 10.6 Sypharma: Small Molecules Fill / Finish Service Portfolio
- Table 10.7 Sypharma: Recent Developments and Future Outlook
- Table 10.8 WuXi AppTec: Company Overview
- Table 10.9 WuXi AppTec: Small Molecules Fill / Finish Service Portfolio
- Table 10.10 WuXi AppTec: Recent Developments and Future Outlook
- Table 10.11 Amanta Healthcare: Company Overview
- Table 10.12 Amanta Healthcare: Small Molecules Fill / Finish Service Portfolio
- Table 11.1 Small Molecules Fill / Finish Service Providers: List of Companies Profiled
- Table 11.2 Eriochem: Company Overview
- Table 11.3 Eriochem: Small Molecules Fill / Finish Service Portfolio
- Table 11.4 Teva Pharmaceutical Industries: Company Overview
- Table 11.5 Teva Pharmaceutical Industries: Small Molecules Fill / Finish Service Portfolio
- Table 11.6 Teva Pharmaceutical Industries: Recent Developments and Future Outlook
- Table 11.7 Batterjee Pharma: Company Overview
- Table 11.8 Batterjee Pharma: Small Molecules Fill / Finish Service Portfolio
- Table 11.9 Nextar Chempharma Solutions: Company Overview
- Table 11.10 Nextar Chempharma Solutions: Small Molecules Fill / Finish Service Portfolio
- Table 11.11 Procaps: Company Overview
- Table 11.12 Procaps: Small Molecules Fill / Finish Service Portfolio
- Table 13.1 Small Molecules Fill / Finish Service Providers: Information on Total Capacity for Ampoules (Sample Data Set)
- Table 13.2 Small Molecules Fill / Finish Service Providers: Average Capacity per Facility for Ampoules, by Company Size (Sample Dataset)
- Table 13.3 Global Annual Small Molecules Fill / Finish Capacity for Ampoules, by Company Size (in terms of units)
- Table 13.4 Small Molecules Fill / Finish Service Providers: Information on Total Capacity for Cartridges (Sample Data Set)
- Table 13.5 Small Molecules Fill / Finish Service Providers: Average Capacity per Facility for Cartridges, by Company Size (Sample Dataset)
- Table 13.6 Global Annual Small Molecules Fill / Finish Capacity for Cartridges, by Company Size (in terms of units)
- Table 13.7 Small Molecules Fill / Finish Service Providers: Information on Total Capacity for Prefilled Syringes (Sample Data Set)
- Table 13.8 Small Molecules Fill / Finish Service Providers: Average Capacity per Facility for Prefilled Syringes, by Company Size (Sample Dataset)
- Table 13.9 Global Annual Small Molecules Fill / Finish Capacity for Prefilled Syringes, by Company Size (in terms of units)
- Table 13.10 Small Molecules Fill / Finish Service Providers: Information on Total Capacity for Vials (Sample Data Set)
- Table 13.11 Small Molecules Fill / Finish Service Providers: Average Capacity for Vials, by Company Size (Sample Dataset)
- Table 13.12 Global Annual Small Molecules Fill / Finish Capacity for Vials: Total Capacity by Company Size (in terms of units)
- Table 14.1 List of Companies Providing Robots for Use in Pharmaceutical Industry
- Table 14.2 Isolator-based Aseptic Filling Systems: Information on Compatible Primary Container
- Table 14.3 Small Molecules Fill / Finish Service Providers: Information on Fill / Finish Equipment Used
- Table 15.1 List of Companies Providing Ready-to-Use Packaging Components
- Table 25.1 Leading Industry Players: Based on the Annual Capacity Installed
- Table 27.1 Bushu Pharmaceuticals: Company Overview
- Table 28.1 Small Molecules Fill / Finish Service Providers: Distribution by Year of Establishment
- Table 28.2 Small Molecules Fill / Finish Service Providers: Distribution by Company Size
- Table 28.3 Small Molecules Fill / Finish Service Providers: Distribution by Location of Headquarters
- Table 28.4 Small Molecules Fill / Finish Service Providers: Distribution by Location of Fill / Finish Facilities
- Table 28.5 Small Molecules Fill / Finish Service Providers: Distribution by Scale of Operation
- Table 28.6 Small Molecules Fill / Finish Service Providers: Distribution by Type of Filling Service Offered
- Table 28.7 Small Molecules Fill / Finish Service Providers: Distribution by Type of Finishing Service Offered
- Table 28.8 Small Molecules Fill / Finish Service Providers: Distribution by Type of Packaging Format Used
- Table 28.9 Small Molecules Fill / Finish Service Providers: Distribution by Type of Finished Dosage Form
- Table 28.10 Small Molecules Fill / Finish Service Providers: Distribution by Degree of Automation
- Table 28.11 Pfizer (parent company of Pfizer CentreOne): Business Segment-wise Revenues and Consolidated Financial Details (USD Billion)
- Table 28.12 Fresenius Kabi: Business Segment-wise Revenues and Consolidated Financial Details (EUR Billion)
- Table 28.13 GlaxoSmithKline: Business Segment-wise Revenues and Consolidated Financial Details (EUR Billion)
- Table 28.14 WuXi AppTec: Business Segment-wise Revenues and Consolidated Financial Details (RMB Billion)
- Table 28.15 Global Annual Small Molecules Fill / Finish Capacity for Ampoules: Distribution by Company Size
- Table 28.16 Global Annual Small Molecules Fill / Finish Capacity for Ampoules: Distribution by Location of Fill / Finish Facility
- Table 28.17 Small Molecules Fill / Finish Capacity for Ampoules in North America
- Table 28.18 Small Molecules Fill / Finish Capacity for Ampoules in Europe
- Table 28.19 Small Molecules Fill / Finish Capacity for Ampoules in Asia-Pacific and Rest of the World
- Table 28.20 Global Annual Small Molecules Fill / Finish Capacity for Cartridges: Distribution by Company Size
- Table 28.21 Global Annual Small Molecules Fill / Finish Capacity for Cartridges: Distribution by Location of Fill / Finish Facility
- Table 28.22 Small Molecules Fill / Finish Capacity for Cartridges in North America
- Table 28.23 Small Molecules Fill / Finish Capacity for Cartridges in Europe
- Table 28.24 Small Molecules Fill / Finish Capacity for Cartridges in Asia-Pacific and Rest of the World
- Table 28.25 Global Annual Small Molecules Fill / Finish Capacity for Prefilled Syringes: Distribution by Company Size
- Table 28.26 Global Annual Small Molecules Fill / Finish Capacity for Prefilled Syringes: Distribution by Location of Fill / Finish Facility
- Table 28.27 Small Molecules Fill / Finish Capacity for Prefilled Syringes in North America
- Table 28.28 Small Molecules Fill / Finish Capacity for Prefilled Syringes in Europe
- Table 28.29 Small Molecules Fill / Finish Capacity for Prefilled Syringes in Asia-Pacific and Rest of the World
- Table 28.30 Global Annual Small Molecules Fill / Finish Capacity for Vials: Distribution by Company Size
- Table 28.31 Global Annual Small Molecules Fill / Finish Capacity for Vials: Distribution by Location of Fill / Finish Facility
- Table 28.32 Small Molecules Fill / Finish Capacity for Vials in North America
- Table 28.33 Small Molecules Fill / Finish Capacity for Vials in Europe
- Table 28.34 Small Molecules Fill / Finish Capacity for Vials in Asia-Pacific and Rest of the World
- Table 28.35 Global Pharmaceutical Fill / Finish Manufacturing Market: Conservative, Base, Optimistic Scenario, till 2035 (USD Billion)
- Table 28.36 Pharmaceutical Fill / Finish Manufacturing Market: Distribution by Type of Fill / Finish Service Offered, 2019, Current Year and 2035 (USD Billion)
- Table 28.37 Pharmaceutical Fill / Finish Manufacturing Market for Terminal Sterilization, till 2035 (USD Billion)
- Table 28.38 Pharmaceutical Fill / Finish Manufacturing Market for Aseptic Filling, till 2035 (USD Billion)
- Table 25.39 Pharmaceutical Fill / Finish Manufacturing Market for Blow-Fill-Seal, till 2035 (USD Billion)
- Table 28.40 Pharmaceutical Fill / Finish Manufacturing Market: Distribution by Type of FDF, 2019, Current Year and 2035 (USD Billion)
- Table 28.41 Pharmaceutical Fill / Finish Manufacturing Market for Originator FDF, till 2035 (USD Billion)
- Table 28.42 Pharmaceutical Fill / Finish Manufacturing Market for Generic FDF, till 2035 (USD Billion)
- Table 28.43 Pharmaceutical Fill / Finish Manufacturing Market: Distribution by API Potency, 2019, Current Year and 2035 (USD Billion)
- Table 28.44 Pharmaceutical Fill / Finish Manufacturing Market for Low Potent API, till 2035 (USD Billion)
- Table 28.45 Pharmaceutical Fill / Finish Manufacturing Market for High Potent API, till 2035 (USD Billion)
- Table 28.46 Pharmaceutical Fill / Finish Manufacturing Market: Distribution by Type of Primary Packaging Container, 2019, Current Year and 2035 (USD Billion)
- Table 28.47 Pharmaceutical Fill / Finish Manufacturing Market for Vials, till 2035 (USD Billion)
- Table 28.48 Pharmaceutical Fill / Finish Manufacturing Market for Prefilled Syringes, till 2035 (USD Billion)
- Table 28.49 Pharmaceutical Fill / Finish Manufacturing Market for Ampoules, till 2035 (USD Billion)
- Table 28.50 Pharmaceutical Fill / Finish Manufacturing Market for Cartridges, till 2035 (USD Billion)
- Table 28.51 Pharmaceutical Fill / Finish Manufacturing Market for Other Containers, till 2035 (USD Billion)
- Table 28.52 Pharmaceutical Fill / Finish Manufacturing Market: Distribution by Scale of Operation, 2019, Current Year and 2035 (USD Billion)
- Table 28.53 Pharmaceutical Fill / Finish Manufacturing Market for Clinical Scale, till 2035 (USD Billion)
- Table 28.54 Pharmaceutical Fill / Finish Manufacturing Market for Commercial Scale, till 2035 (USD Billion)
- Table 28.55 Pharmaceutical Fill / Finish Manufacturing Market: Distribution by Company Size, 2019, Current Year and 2035 (USD Billion)
- Table 28.56 Pharmaceutical Fill / Finish Manufacturing Market for Small and Mid-sized Companies, till 2035 (USD Billion)
- Table 28.57 Pharmaceutical Fill / Finish Manufacturing Market for Large / Very Large Companies, till 2035 (USD Billion)
- Table 28.58 Pharmaceutical Fill / Finish Manufacturing Market: Distribution by Geographical Regions 2019, Current Year and 2035 (USD Billion)
- Table 28.59 Pharmaceutical Fill / Finish Manufacturing Market in North America, till 2035 (USD Billion)
- Table 28.60 Pharmaceutical Fill / Finish Manufacturing Market in the US, till 2035 (USD Billion)
- Table 28.61 Pharmaceutical Fill / Finish Manufacturing Market in Canada, till 2035 (USD Billion)
- Table 28.62 Pharmaceutical Fill / Finish Manufacturing Market in Mexico, till 2035 (USD Billion)
- Table 28.63 Pharmaceutical Fill / Finish Manufacturing Market in Puerto Rico, till 2035 (USD Billion)
- Table 28.64 Pharmaceutical Fill / Finish Manufacturing Market in Europe, till 2035 (USD Billion)
- Table 28.65 Pharmaceutical Fill / Finish Manufacturing Market in France, till 2035 (USD Billion)
- Table 28.66 Pharmaceutical Fill / Finish Manufacturing Market in Germany, till 2035 (USD Billion)
- Table 28.67 Pharmaceutical Fill / Finish Manufacturing Market in Italy, till 2035 (USD Billion)
- Table 28.68 Pharmaceutical Fill / Finish Manufacturing Market in the UK, till 2035 (USD Billion)
- Table 28.69 Pharmaceutical Fill / Finish Manufacturing Market in Spain, till 2035 (USD Billion)
- Table 28.70 Pharmaceutical Fill / Finish Manufacturing Market in Rest of Europe, till 2035 (USD Billion)
- Table 28.71 Pharmaceutical Fill / Finish Manufacturing Market in Asia-Pacific, till 2035 (USD Billion)
- Table 28.72 Pharmaceutical Fill / Finish Manufacturing Market in India, till 2035 (USD Billion)
- Table 28.73 Pharmaceutical Fill / Finish Manufacturing Market in Japan, till 2035 (USD Billion)
- Table 28.74 Pharmaceutical Fill / Finish Manufacturing Market in China, till 2035 (USD Billion)
- Table 28.75 Pharmaceutical Fill / Finish Manufacturing Market in Rest of Asia-Pacific, till 2035 (USD Billion)
- Table 28.76 Pharmaceutical Fill / Finish Manufacturing Market in Middle East and North Africa, till 2035 (USD Billion)
- Table 28.77 Pharmaceutical Fill / Finish Manufacturing Market in Latin America, till 2035 (USD Billion)
- Table 28.78 Pharmaceutical Fill / Finish Manufacturing Market in Rest of the World, till 2035 (USD Billion)
List of Figures
- Figure 2.1 Research Methodology: Project Methodology
- Figure 2.2 Research Methodology: Data Sources for Secondary Research
- Figure 3.1 Market Dynamics: Forecast Methodology
- Figure 3.2 Market Dynamics: Key Market Segmentation
- Figure 3.3 Market Dynamics: Robust Quality Control
- Figure 4.1 Lessons Learnt from Past Recessions
- Figure 5.1 Executive Summary: Market Landscape
- Figure 5.2 Executive Summary: Market Forecast and Opportunity Analysis
- Figure 6.1 Steps involved in Fill / Finish of Small Molecules
- Figure 6.2 Blow-Fill-Seal Process
- Figure 6.3 Key Considerations for Selecting a CMO Partner
- Figure 6.4 Risks and Challenges of Outsourcing Fill / Finish Operations
- Figure 7.1 Small Molecules Fill / Finish Service Providers: Distribution by Year of Establishment
- Figure 7.2 Small Molecules Fill / Finish Service Providers: Distribution by Company Size
- Figure 7.3 Small Molecules Fill / Finish Service Providers: Distribution by Location of Headquarters
- Figure 7.4 Small Molecules Fill / Finish Service Providers: Distribution by Location of Fill / Finish Facilities
- Figure 7.5 Small Molecules Fill / Finish Service Providers: Distribution by Scale of Operation
- Figure 7.6 Small Molecules Fill / Finish Service Providers: Distribution by Type of Filling Service Offered
- Figure 7.7 Small Molecules Fill / Finish Service Providers: Distribution by Type of Finishing Service Offered
- Figure 7.8 Small Molecules Fill / Finish Service Providers: Analysis by Type of Packaging Format Used
- Figure 7.9 Small Molecules Fill / Finish Service Providers: Distribution by Type of Finished Dosage Form
- Figure 7.10 Small Molecules Fill / Finish Service Providers: Distribution by Degree of Automation
- Figure 8.1 Pfizer (parent company of Pfizer CentreOne): Business Segment-wise Revenues and Consolidated Financial Details (USD Billion)
- Figure 9.1 Fresenius: Business Segment-wise Revenues and Consolidated Financial Details (EUR Billion)
- Figure 9.2 GlaxoSmithKline: Business Segment-wise Revenues and Consolidated Financial Details (EUR Billion)
- Figure 10.1 WuXi AppTec: Business Segment-wise Revenues and Consolidated Financial Details (RMB Billion)
- Figure 12.1 Company Competitiveness Analysis: Small Molecules Fill / Finish Service Providers based in North America
- Figure 12.2 Company Competitiveness Analysis: Small Molecules Fill / Finish Service Providers based in Europe
- Figure 12.3 Company Competitiveness Analysis: Small Molecules Fill / Finish Service Providers based in Asia-Pacific and Rest of the World
- Figure 13.1 Global Annual Small Molecules Fill / Finish Capacity for Ampoules: Distribution by Company Size
- Figure 13.2 Global Annual Small Molecules Fill / Finish Capacity for Ampoules: Distribution by Location of Fill / Finish Facility
- Figure 13.3 Small Molecules Fill / Finish Capacity for Ampoules in North America
- Figure 13.4 Small Molecules Fill / Finish Capacity for Ampoules in Europe
- Figure 13.5 Small Molecules Fill / Finish Capacity for Ampoules in Asia-Pacific and Rest of the World
- Figure 13.6 Global Annual Small Molecules Fill / Finish Capacity for Cartridges: Distribution by Company Size
- Figure 13.7 Global Annual Small Molecules Fill / Finish Capacity for Cartridges: Distribution by Location of Fill / Finish Facility
- Figure 13.8 Small Molecules Fill / Finish Capacity for Cartridges in North America
- Figure 13.9 Small Molecules Fill / Finish Capacity for Cartridges in Europe
- Figure 13.10 Small Molecules Fill / Finish Capacity for Cartridges in Asia-Pacific and Rest of the World
- Figure 13.11 Global Annual Small Molecules Fill / Finish Capacity for Prefilled Syringes: Distribution by Company Size
- Figure 13.12 Global Annual Small Molecules Fill / Finish Capacity for Prefilled Syringes: Distribution by Location of Fill / Finish Facility
- Figure 13.13 Small Molecules Fill / Finish Capacity for Prefilled Syringes in North America
- Figure 13.14 Small Molecules Fill / Finish Capacity for Prefilled Syringes in Europe
- Figure 13.15 Small Molecules Fill / Finish Capacity for Prefilled Syringes in Asia-Pacific and Rest of the World
- Figure 13.16 Global Annual Small Molecules Fill / Finish Capacity for Vials: Distribution by Company Size
- Figure 13.17 Global Annual Small Molecules Fill / Finish Capacity for Vials: Distribution by Location of Fill / Finish Facility
- Figure 13.18 Small Molecules Fill / Finish Capacity for Vials in North America
- Figure 13.19 Small Molecules Fill / Finish Capacity for Vials in Europe
- Figure 13.20 Small Molecules Fill / Finish Capacity for Vials in Asia-Pacific and Rest of the World
- Figure 14.1 Key Considerations for Selecting a Robotic Systems
- Figure 14.2 Advantages of Using Robotic Systems
- Figure 15.1 Key Drivers of Ready-to- Use Components
- Figure 16.1 Pharmaceutical Fill / Finish Manufacturing: Market Drivers
- Figure 16.2 Pharmaceutical Fill / Finish Manufacturing: Market Restraints
- Figure 16.3 Pharmaceutical Fill / Finish Manufacturing: Market Opportunities
- Figure 16.4 Pharmaceutical Fill / Finish Manufacturing: Market Challenges
- Figure 17.1 Global Pharmaceutical Fill / Finish Manufacturing Market, till 2035 (USD Billion)
- Figure 17.2 Global Pharmaceutical Fill / Finish Manufacturing Market, till 2035: Conservative Scenario (USD Billion)
- Figure 17.3 Global Pharmaceutical Fill / Finish Manufacturing Market, till 2035: Optimistic Scenario (USD Billion)
- Figure 18.1 Pharmaceutical Fill / Finish Manufacturing Market: Distribution by Type of Fill / Finish Service Offered, 2019, Current Year and 2035
- Figure 18.2 Pharmaceutical Fill / Finish Manufacturing Market for Terminal Sterilization, till 2035 (USD Billion)
- Figure 18.3 Pharmaceutical Fill / Finish Manufacturing Market for Aseptic Filling, till 2035 (USD Billion)
- Figure 18.4 Pharmaceutical Fill / Finish Manufacturing Market for Blow-Fill-Seal, till 2035 (USD Billion)
- Figure 18.5 Penetration-Growth (P-G) Matrix: Type of Fill / Finish Service Offered
- Figure 19.1 Pharmaceutical Fill / Finish Manufacturing Market: Distribution by Type of FDF, 2019, Current Year and 2035
- Figure 19.2 Pharmaceutical Fill / Finish Manufacturing Market for Originator FDF, till 2035 (USD Billion)
- Figure 19.3 Pharmaceutical Fill / Finish Manufacturing Market for Generic FDF, till 2035 (USD Billion)
- Figure 19.4 Penetration-Growth (P-G) Matrix: Type of FDF
- Figure 20.1 Pharmaceutical Fill / Finish Manufacturing Market: Distribution by API Potency, 2019, Current Year and 2035
- Figure 20.2 Pharmaceutical Fill / Finish Manufacturing Market for Low Potent API, till 2035 (USD Billion)
- Figure 20.3 Pharmaceutical Fill / Finish Manufacturing Market for High Potent API, till 2035 (USD Billion)
- Figure 20.4 Penetration-Growth (P-G) Matrix: API Potency
- Figure 21.1 Pharmaceutical Fill / Finish Manufacturing Market: Distribution by Type of Primary Packaging Container, 2019, Current Year and 2035
- Figure 21.2 Pharmaceutical Fill / Finish Manufacturing Market for Vials, till 2035 (USD Billion)
- Figure 21.3 Pharmaceutical Fill / Finish Manufacturing Market for Prefilled Syringes, till 2035 (USD Billion)
- Figure 21.4 Pharmaceutical Fill / Finish Manufacturing Market for Ampoules, till 2035 (USD Billion)
- Figure 21.5 Pharmaceutical Fill / Finish Manufacturing Market for Cartridges, till 2035 (USD Billion)
- Figure 21.6 Pharmaceutical Fill / Finish Manufacturing Market for Other Containers, till 2035 (USD Billion)
- Figure 21.7 Penetration-Growth (P-G) Matrix: Type of Primary Packaging Container
- Figure 22.1 Pharmaceutical Fill / Finish Manufacturing Market: Distribution by Scale of Operation, 2019, Current Year and 2035
- Figure 22.2 Pharmaceutical Fill / Finish Manufacturing Market for Clinical Scale, till 2035 (USD Billion)
- Figure 22.3 Pharmaceutical Fill / Finish Manufacturing Market for Commercial Scale, till 2035 (USD Billion)
- Figure 22.4 Penetration-Growth (P-G) Matrix: Scale of Operation
- Figure 23.1 Pharmaceutical Fill / Finish Manufacturing Market: Distribution by Company Size, 2019, Current Year and 2035
- Figure 23.2 Pharmaceutical Fill / Finish Manufacturing Market for Small and Mid-sized Companies, till 2035 (USD Billion)
- Figure 23.3 Pharmaceutical Fill / Finish Manufacturing Market for Large / Very Large Companies, till 2035 (USD Billion)
- Figure 23.4 Penetration-Growth (P-G) Matrix: Company Size
- Figure 24.1 Pharmaceutical Fill / Finish Manufacturing Market: Distribution by Geographical Regions 2019, Current Year and 2035
- Figure 24.2 Pharmaceutical Fill / Finish Manufacturing Market in North America, till 2035 (USD Billion)
- Figure 24.3 Pharmaceutical Fill / Finish Manufacturing Market in the US, till 2035 (USD Billion)
- Figure 24.4 Pharmaceutical Fill / Finish Manufacturing Market in Canada, till 2035 (USD Billion)
- Figure 24.5 Pharmaceutical Fill / Finish Manufacturing Market in Mexico, till 2035 (USD Billion)
- Figure 24.6 Pharmaceutical Fill / Finish Manufacturing Market in Puerto Rico, till 2035 (USD Billion)
- Figure 24.7 Pharmaceutical Fill / Finish Manufacturing Market in Europe, till 2035 (USD Billion)
- Figure 24.8 Pharmaceutical Fill / Finish Manufacturing Market in France, till 2035 (USD Billion)
- Figure 24.9 Pharmaceutical Fill / Finish Manufacturing Market in Germany, till 2035 (USD Billion)
- Figure 24.10 Pharmaceutical Fill / Finish Manufacturing Market in Italy, till 2035 (USD Billion)
- Figure 24.11 Pharmaceutical Fill / Finish Manufacturing Market in the UK, till 2035 (USD Billion)
- Figure 24.12 Pharmaceutical Fill / Finish Manufacturing Market in Spain, till 2035 (USD Billion)
- Figure 24.13 Pharmaceutical Fill / Finish Manufacturing Market in Rest of Europe, till 2035 (USD Billion)
- Figure 24.14 Pharmaceutical Fill / Finish Manufacturing Market in Asia-Pacific, till 2035 (USD Billion)
- Figure 24.15 Pharmaceutical Fill / Finish Manufacturing Market in India, till 2035 (USD Billion)
- Figure 24.16 Pharmaceutical Fill / Finish Manufacturing Market in Japan, till 2035 (USD Billion)
- Figure 24.17 Pharmaceutical Fill / Finish Manufacturing Market in China, till 2035 (USD Billion)
- Figure 24.18 Pharmaceutical Fill / Finish Manufacturing Market in Rest of Asia-Pacific, till 2035 (USD Billion)
- Figure 24.19 Pharmaceutical Fill / Finish Manufacturing Market in Middle East and North Africa, till 2035 (USD Billion)
- Figure 24.20 Pharmaceutical Fill / Finish Manufacturing Market in Latin America, till 2035 (USD Billion)
- Figure 24.21 Pharmaceutical Fill / Finish Manufacturing Market in Rest of the World, till 2035 (USD Billion)
- Figure 24.22 Penetration-Growth (P-G) Matrix: Geographical Regions
- Figure 26.1 Conclusion: Small Molecules Fill / Finish Service Providers Landscape
- Figure 26.2 Conclusion: Capacity Analysis
- Figure 26.3 Conclusion: Market Forecast and Opportunity Analysis (I/II)
- Figure 26.4 Conclusion: Market Forecast and Opportunity Analysis (II/II)
 药品无菌运输市场:依产品类型、系统类型、系统配置及最终用户划分-2026-2032年全球预测
 脂质奈米颗粒(LNP)CDMO市场分析及至2035年预测:按类型、产品类型、服务、技术、应用、材料类型、製程及最终用户划分
 生物製药CMO市场规模、份额、成长及全球产业分析:按类型、应用和地区划分,并预测2026-2034年
 药品合约生产市场(第五版):趋势与预测至 2035 年 - 按产品类型、原料药类型、原料药浓度、成品製剂、剂型、口服固体製剂、最终用户、地区和主要公司划分
 奈米颗粒契约製造服务市场-全球产业规模、份额、趋势、机会及预测(按类型、应用、製造能力、最终用户、地区和竞争格局划分,2021-2031年)医用镍钛契约製造服务市场按产品类型、材料形态、製造技术、应用和最终用途划分-全球预测(2026-2032 年)生物製药CXO市场按产品类型、治疗领域、分子类型、给药途径、技术平台、最终用户和分销管道划分,全球预测,2026-2032年全球合约生产组织 (CRO) 市场:市场规模、市场占有率、成长率、行业分析、依类型、应用和地区划分的考虑因素以及未来预测 (2026-2034)
 全球生物製药合约服务市场预测至2032年:按服务类型、研究服务、技术、应用、最终用户和地区划分抗体药物偶联物 (ADC) 合约生产市场(第七版):依研发阶段、製程组件、有效载荷、抗体同型、标靶适应症、抗体来源、连接子和主要地区划分——产业趋势及全球预测至 2035 年