


 |
市场调查报告书
商品编码
1856063
到软性显示器市场:2035年前的产业趋势和全球预测 - 各显示器类型,各材料类型,各产品类型,各应用类型,各萤幕尺寸,各显示器画素,各技术,各地区Flexible Display Market, Till 2035: Distribution by Type of Display Method, Type of Material, Product, Application, Panel Size, Display Resolution, Technology, and Geographical Regions: Industry Trends and Market Forecasts |
||||||
柔性显示器市场概述
预计到 2035 年,全球柔性显示器市场规模将从目前的 306 亿美元增长至 2,850 亿美元,预测期内复合年增长率 (CAGR) 为 22.49%。
软性显示器市场机会,以下的市场区隔分布着。
显示器类型
- EPD
- LCD
- LED
- OLED
- 其他
材料类型
- 玻璃
- 塑胶
- 其他
产品类型
- 折弯型
- 弯曲,卷型
用途
- 车载用
- 电子书阅读器
- PC,笔记型电脑
- 智慧家电
- 智慧穿戴式
- 智慧型手机,平板电脑
- 电视
- 其他
萤幕尺寸
- 不满6英吋
- 50英吋以上
- 20~50英吋
- 6~20英吋
显示器解析度
- 标准解析度(SD)
- 高清晰度(HD)
- 超高清晰度(UHD)
技术类型
- 活性矩阵
- 被动式矩阵
- 量子点技术
地区
- 北美
- 美国
- 加拿大
- 墨西哥
- 其他的北美各国
- 欧洲
- 奥地利
- 比利时
- 丹麦
- 法国
- 德国
- 爱尔兰
- 义大利
- 荷兰
- 挪威
- 俄罗斯
- 西班牙
- 瑞典
- 瑞士
- 英国
- 其他欧洲各国
- 亚洲
- 中国
- 印度
- 日本
- 新加坡
- 韩国
- 其他亚洲各国
- 南美
- 巴西
- 智利
- 哥伦比亚
- 委内瑞拉
- 其他的南美各国
- 中东·北非
- 埃及
- 伊朗
- 伊拉克
- 以色列
- 科威特
- 沙乌地阿拉伯
- 阿拉伯联合大公国
- 其他的MENA各国
- 全球其他地区
- 澳洲
- 纽西兰
- 其他的国家
柔性显示器市场成长与趋势
柔性显示器代表了电子领域的突破,其特点是能够弯曲并适应各种设计。这项技术创新源于人们对更通用、更便携的电子设备的需求,这些设备可以无缝整合到日常生活中,例如可穿戴技术和智慧型手机。重要的是,这些显示器利用特定的聚合物化合物来延长设备的使用寿命。
柔性显示器的工作原理是吸收手指按压或滑动萤幕表面时产生的压力。
此外,它们还能增强家用电器、安防、农业和环境感测器、医疗保健以及环境监测等多个领域的功能。柔性显示器的关键特性包括可弯曲性、超薄、抗碎裂、抗断裂、便携性和低能耗。此外,柔性显示领域正经历着众多持续的技术发展,其重点在于可适应性设计和先进技术的整合,以提升用户体验。材料、製造方法和装置设计的最新进展,使得可以弯曲、折迭和捲曲而不牺牲影像品质的显示器成为可能。有机发光二极体 (OLED) 技术的日益普及,使得这些显示器适用于包括穿戴式装置、平板电脑和电视在内的各种应用。
此外,柔性显示器在扩增实境 (AR) 和虚拟实境 (VR) 等前沿技术领域的日益普及,也催生了可折迭智慧型手机和可捲曲电视等新趋势。
因此,预计柔性显示器市场在预测期内将稳定成长。目录
第1章 序文
第2章 调查手法
第3章 经济以及其他的计划特有的考虑事项
第4章 宏观经济指标
第5章 摘要整理
第6章 简介
第7章 竞争情形
第8章 软性显示器市场上Start-Ups生态系统
第9章 企业简介
- 章概要
- AU Optronics
- BOE Technology
- Chunghwa Picture Tubes
- Corning Incorporated
- E-ink Holdings
- FlexEnable
- Guangzhou Oed Technologies
- Huawei Technologies
- Innolux
- Japan Display
- LG Display
- Microtips
- Plastic Logic
- ROYOLE
- Samsung Electronics
- Sharp
- TCL Electronics
第10章 价值链分析
第11章 SWOT分析
第12章 全球软性显示器市场
第13章 各显示器类型的市场机会
第14章 各材料类型的市场机会
第15章 各产品类型的市场机会
第16章 各应用类型的市场机会
第17章 各萤幕尺寸市场机会
第18章 各显示器画素的市场机会
第19章 各技术的市场机会
第20章 北美软性显示器的市场机会
第21章 欧洲的软性显示器的市场机会
第22章 亚洲的软性显示器的市场机会
第23章 中东·北非的软性显示器的市场机会
第24章 南美的软性显示器的市场机会
第25章 其他地区的软性显示器的市场机会
第24章 表格形式资料
第25章 企业·团体一览
第26章 客制化的机会
第27章 ROOT的订阅服务
第28章 着者详细内容
Flexible Display Market Overview
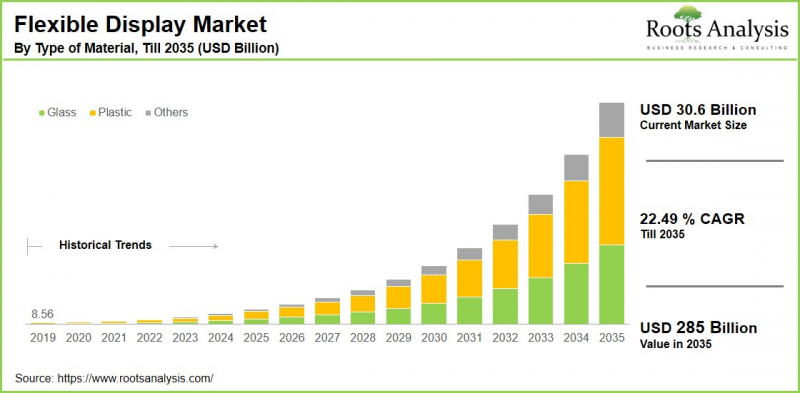
As per Roots Analysis, the global flexible display market size is estimated to grow from USD 30.6 billion in the current year USD 285 billion by 2035, at a CAGR of 22.49% during the forecast period, till 2035.
The opportunity for flexible display market has been distributed across the following segments:
Type of Display
- EPD
- LCD
- LED
- OLED
- Others
Type of Material
- Glass
- Plastic
- Others
Type of Product
- Bendable and Foldable
- Curved and Rollable
Type of Application
- Automotive
- E-reader
- PCs & Laptops
- Smart Home Appliances
- Smart Wearables
- Smartphones and Tablets
- Television
- Others
Type of Panel Size
- Up to 6"
- Above 50"
- 20-50"
- 6-20"
Type of Display Resolution
- Standard Definition (SD)
- High Definition (HD)
- Ultra-High Definition (UHD)
Type of Technology
- Active Matrix
- Passive Matrix
- Quantum Dot Technology
Geographical Regions
- North America
- US
- Canada
- Mexico
- Other North American countries
- Europe
- Austria
- Belgium
- Denmark
- France
- Germany
- Ireland
- Italy
- Netherlands
- Norway
- Russia
- Spain
- Sweden
- Switzerland
- UK
- Other European countries
- Asia
- China
- India
- Japan
- Singapore
- South Korea
- Other Asian countries
- Latin America
- Brazil
- Chile
- Colombia
- Venezuela
- Other Latin American countries
- Middle East and North Africa
- Egypt
- Iran
- Iraq
- Israel
- Kuwait
- Saudi Arabia
- UAE
- Other MENA countries
- Rest of the World
- Australia
- New Zealand
- Other countries
Flexible Display Market: Growth and Trends
Flexible displays represent a groundbreaking development in electronics, distinguished by their capability to bend and adapt in design. This innovation is fueled by the demand for more versatile and portable electronic devices that can seamlessly integrate into daily life, including wearable technologies and smartphones. Importantly, these displays utilize a specific polymer compound to enhance the longevity of the device.
Flexible displays operate by absorbing the pressure applied to the screen when fingers press and glide over the surface. Additionally, they enhance functionality across various sectors, including consumer electronics, security, agricultural and environmental sensors, healthcare, and environmental monitoring. Key characteristics of flexible displays include their bendability, ultra-thin profile, shatter resistance, unbreakable nature, portability, and low energy consumption.
Moreover, there are numerous ongoing technological developments within the flexible display sector, focusing on integrating advanced technologies for adaptable designs and an improved user experience. Recent progress in materials, manufacturing methods, and device design has led to the creation of displays that can be bent, folded, or rolled without sacrificing image quality. The increasing implementation of organic light-emitting diode (OLED) technology has made these displays appropriate for a wide array of applications, including wearable devices, tablets, and televisions.
Furthermore, new trends are emerging, such as foldable smartphones and rollable televisions, along with the rising popularity of flexible displays in cutting-edge technologies like augmented reality (AR) and virtual reality (VR). Given all the above mentioned factors, we believe that the flexible display market will grow at a steady pace during the forecast period.
Flexible Display Market: Key Segments
Market Share by Type of Display
Based on type of display, the global flexible display market is segmented into EPD, LCD, LED, OLED and others. According to our estimates, currently, the organic light emitting diode (OLED) segment captures the majority of the market share. This can be attributed to its superior image quality, broader viewing angles, and quicker response times. Its slim, lightweight, and flexible structure enables innovative designs such as foldable smartphones.
Conversely, the EPD (electrophoretic display) segment is expected to grow at a higher CAGR during the forecast period. This growth is attributed to its increasing use in e-readers and electronic shelf labels, owing to its low energy consumption and outstanding readability.
Market Share by Type of Material
Based on type of material, the global flexible display market is segmented into glass, plastic and others. According to our estimates, currently, the plastic synthesis segment captures the majority of the market share. Furthermore, this segment is anticipated to experience a higher growth rate during the forecast period. This trend can be attributed to its lightweight, flexible, and shatter-resistant characteristics, which make it particularly suitable for different uses in consumer electronics, especially in smartphones and wearables.
Market Share by Type of Product
Based on type of product, the global flexible display market is segmented into bendable and foldable and curved and rollable. According to our estimates, currently, the curved and rollable segment captures the majority of the market share. This is due to its capacity to improve viewing angles and brightness, making it a favored choice for smartphones and smartwatches.
However, the bendable and foldable segment is expected to grow at a higher CAGR during the forecast period. Key factors driving this growth include increasing demand for innovative, adaptable devices that merge portability and larger screen sizes.
Market Share by Type of Application
Based on type of application, the global flexible display market is segmented into automotive, E-reader, PC's & laptops, smart home appliances, smart wearables, smartphones and tablets, television and others. According to our estimates, currently, the smartphones and tablets segment captures the majority of the market share.
This growth is due to the increasing demand for portable, high-performance, and visually appealing electronic devices. Conversely, automotive segment is projected to experience the fastest CAGR during the forecast period. This can be attributed to several factors, including the expansion of the automotive industry and growing investments in charging infrastructure.
Market Share by Type of Panel Size
Based on type of panel size, the global flexible display market is segmented into up to 6", above 50", 20-50" and 6-20". According to our estimates, currently, the up to 6" segment captures the majority of the market share, primarily due to its compact nature, portability, affordability, and widespread use in smartphones.
Conversely, the 6-20" segment is projected to experience the fastest CAGR during the forecast period. This growth can be attributed to the rising smart devices like tablets, the benefits of OLED flexible display technology, advancements in consumer electronics, and improvements in manufacturing processes leading to lower costs.
Market Share by Type of Display Resolution
Based on type of display resolution, the global flexible display market is segmented into standard definition (SD), high definition (HD) and ultra-high definition (UHD). According to our estimates, currently, the standard definition (SD) segment captures the majority of the market share, largely due to a well-established ecosystem of devices and widespread adoption across different applications. Conversely, ultra-high definition (UHD) segment is projected to experience the fastest CAGR during the forecast period, driven by the rising demand for high-resolution content and enhanced viewing experiences.
Market Share by Type of Technology
Based on type of technology, the global flexible display market is segmented into active matrix, passive matrix and quantum dot technology. According to our estimates, currently, the active-matrix segment captures the majority of the market share, owing to its advantages such as high-resolution output, faster refresh rates, and enhanced power efficiency across electronic devices.
Conversely, quantum dot technology segment is projected to experience the fastest CAGR during the forecast period, driven by its superior display quality, continuous manufacturing advancements, and increasing emphasis on energy efficiency.
Market Share by Geographical Regions
Based on geographical regions, the flexible display market is segmented into North America, Europe, Asia, Latin America, Middle East and North Africa, and the rest of the world. According to our estimates, currently, Asia captures the majority share of the market. This trend can be attributed to the rapid technological progress, the presence of leading manufacturers such as Samsung and LG, and increasing adoption in key developing countries like China and India.
Furthermore, the market in North America is projected to experience a faster compound annual growth rate (CAGR) over the next decade, driven by strong consumer electronics adoption, a robust technological ecosystem, and substantial investments in research and development.
Example Players in Flexible Display Market
- AU Optronics
- BOE Technology
- Chunghwa Picture Tubes
- Corning Incorporated
- E-ink Holdings
- FlexEnable
- Guangzhou Oed Technologies
- Huawei Technologies
- Innolux
- Japan Display
- LG Display
- Microtips
- Plastic Logic
- ROYOLE
- Samsung Electronics
- Sharp
- TCL Electronics
Flexible Display Market: Research Coverage
The report on the flexible display market features insights on various sections, including:
- Market Sizing and Opportunity Analysis: An in-depth analysis of the flexible display market, focusing on key market segments, including [A] type of display method, [B] type of material, [C] type of product, [D] type of application, [E] type of panel size, [F] type of display resolution, [G] type of technology, and [H] geographical regions.
- Competitive Landscape: A comprehensive analysis of the companies engaged in the flexible display market, based on several relevant parameters, such as [A] year of establishment, [B] company size, [C] location of headquarters and [D] ownership structure.
- Company Profiles: Elaborate profiles of prominent players engaged in the flexible display market, providing details on [A] location of headquarters, [B] company size, [C] company mission, [D] company footprint, [E] management team, [F] contact details, [G] financial information, [H] operating business segments, [I] flexible display portfolio, [J] moat analysis, [K] recent developments, and an informed future outlook.
- Megatrends: An evaluation of ongoing megatrends in the flexible display industry.
- Patent Analysis: An insightful analysis of patents filed / granted in the flexible display domain, based on relevant parameters, including [A] type of patent, [B] patent publication year, [C] patent age and [D] leading players.
- Recent Developments: An overview of the recent developments made in the flexible display market, along with analysis based on relevant parameters, including [A] year of initiative, [B] type of initiative, [C] geographical distribution and [D] most active players.
- Porter's Five Forces Analysis: An analysis of five competitive forces prevailing in the flexible display market, including threats of new entrants, bargaining power of buyers, bargaining power of suppliers, threats of substitute products and rivalry among existing competitors.
- SWOT Analysis: An insightful SWOT framework, highlighting the strengths, weaknesses, opportunities and threats in the domain. Additionally, it provides Harvey ball analysis, highlighting the relative impact of each SWOT parameter.
Key Questions Answered in this Report
- How many companies are currently engaged in flexible display market?
- Which are the leading companies in this market?
- What factors are likely to influence the evolution of this market?
- What is the current and future market size?
- What is the CAGR of this market?
- How is the current and future market opportunity likely to be distributed across key market segments?
Reasons to Buy this Report
- The report provides a comprehensive market analysis, offering detailed revenue projections of the overall market and its specific sub-segments. This information is valuable to both established market leaders and emerging entrants.
- Stakeholders can leverage the report to gain a deeper understanding of the competitive dynamics within the market. By analyzing the competitive landscape, businesses can make informed decisions to optimize their market positioning and develop effective go-to-market strategies.
- The report offers stakeholders a comprehensive overview of the market, including key drivers, barriers, opportunities, and challenges. This information empowers stakeholders to stay abreast of market trends and make data-driven decisions to capitalize on growth prospects.
Additional Benefits
- Complimentary Excel Data Packs for all Analytical Modules in the Report
- 15% Free Content Customization
- Detailed Report Walkthrough Session with Research Team
- Free Updated report if the report is 6-12 months old or older
TABLE OF CONTENTS
1. PREFACE
- 1.1. Introduction
- 1.2. Market Share Insights
- 1.3. Key Market Insights
- 1.4. Report Coverage
- 1.5. Key Questions Answered
- 1.6. Chapter Outlines
2. RESEARCH METHODOLOGY
- 2.1. Chapter Overview
- 2.2. Research Assumptions
- 2.3. Database Building
- 2.3.1. Data Collection
- 2.3.2. Data Validation
- 2.3.3. Data Analysis
- 2.4. Project Methodology
- 2.4.1. Secondary Research
- 2.4.1.1. Annual Reports
- 2.4.1.2. Academic Research Papers
- 2.4.1.3. Company Websites
- 2.4.1.4. Investor Presentations
- 2.4.1.5. Regulatory Filings
- 2.4.1.6. White Papers
- 2.4.1.7. Industry Publications
- 2.4.1.8. Conferences and Seminars
- 2.4.1.9. Government Portals
- 2.4.1.10. Media and Press Releases
- 2.4.1.11. Newsletters
- 2.4.1.12. Industry Databases
- 2.4.1.13. Roots Proprietary Databases
- 2.4.1.14. Paid Databases and Sources
- 2.4.1.15. Social Media Portals
- 2.4.1.16. Other Secondary Sources
- 2.4.2. Primary Research
- 2.4.2.1. Introduction
- 2.4.2.2. Types
- 2.4.2.2.1. Qualitative
- 2.4.2.2.2. Quantitative
- 2.4.2.3. Advantages
- 2.4.2.4. Techniques
- 2.4.2.4.1. Interviews
- 2.4.2.4.2. Surveys
- 2.4.2.4.3. Focus Groups
- 2.4.2.4.4. Observational Research
- 2.4.2.4.5. Social Media Interactions
- 2.4.2.5. Stakeholders
- 2.4.2.5.1. Company Executives (CXOs)
- 2.4.2.5.2. Board of Directors
- 2.4.2.5.3. Company Presidents and Vice Presidents
- 2.4.2.5.4. Key Opinion Leaders
- 2.4.2.5.5. Research and Development Heads
- 2.4.2.5.6. Technical Experts
- 2.4.2.5.7. Subject Matter Experts
- 2.4.2.5.8. Scientists
- 2.4.2.5.9. Doctors and Other Healthcare Providers
- 2.4.2.6. Ethics and Integrity
- 2.4.2.6.1. Research Ethics
- 2.4.2.6.2. Data Integrity
- 2.4.3. Analytical Tools and Databases
- 2.4.1. Secondary Research
3. ECONOMIC AND OTHER PROJECT SPECIFIC CONSIDERATIONS
- 3.1. Forecast Methodology
- 3.1.1. Top-Down Approach
- 3.1.2. Bottom-Up Approach
- 3.1.3. Hybrid Approach
- 3.2. Market Assessment Framework
- 3.2.1. Total Addressable Market (TAM)
- 3.2.2. Serviceable Addressable Market (SAM)
- 3.2.3. Serviceable Obtainable Market (SOM)
- 3.2.4. Currently Acquired Market (CAM)
- 3.3. Forecasting Tools and Techniques
- 3.3.1. Qualitative Forecasting
- 3.3.2. Correlation
- 3.3.3. Regression
- 3.3.4. Time Series Analysis
- 3.3.5. Extrapolation
- 3.3.6. Convergence
- 3.3.7. Forecast Error Analysis
- 3.3.8. Data Visualization
- 3.3.9. Scenario Planning
- 3.3.10. Sensitivity Analysis
- 3.4. Key Considerations
- 3.4.1. Demographics
- 3.4.2. Market Access
- 3.4.3. Reimbursement Scenarios
- 3.4.4. Industry Consolidation
- 3.5. Robust Quality Control
- 3.6. Key Market Segmentations
- 3.7. Limitations
4. MACRO-ECONOMIC INDICATORS
- 4.1. Chapter Overview
- 4.2. Market Dynamics
- 4.2.1. Time Period
- 4.2.1.1. Historical Trends
- 4.2.1.2. Current and Forecasted Estimates
- 4.2.2. Currency Coverage
- 4.2.2.1. Overview of Major Currencies Affecting the Market
- 4.2.2.2. Impact of Currency Fluctuations on the Industry
- 4.2.3. Foreign Exchange Impact
- 4.2.3.1. Evaluation of Foreign Exchange Rates and Their Impact on Market
- 4.2.3.2. Strategies for Mitigating Foreign Exchange Risk
- 4.2.4. Recession
- 4.2.4.1. Historical Analysis of Past Recessions and Lessons Learnt
- 4.2.4.2. Assessment of Current Economic Conditions and Potential Impact on the Market
- 4.2.5. Inflation
- 4.2.5.1. Measurement and Analysis of Inflationary Pressures in the Economy
- 4.2.5.2. Potential Impact of Inflation on the Market Evolution
- 4.2.6. Interest Rates
- 4.2.6.1. Overview of Interest Rates and Their Impact on the Market
- 4.2.6.2. Strategies for Managing Interest Rate Risk
- 4.2.7. Commodity Flow Analysis
- 4.2.7.1. Type of Commodity
- 4.2.7.2. Origins and Destinations
- 4.2.7.3. Values and Weights
- 4.2.7.4. Modes of Transportation
- 4.2.8. Global Trade Dynamics
- 4.2.8.1. Import Scenario
- 4.2.8.2. Export Scenario
- 4.2.9. War Impact Analysis
- 4.2.9.1. Russian-Ukraine War
- 4.2.9.2. Israel-Hamas War
- 4.2.10. COVID Impact / Related Factors
- 4.2.10.1. Global Economic Impact
- 4.2.10.2. Industry-specific Impact
- 4.2.10.3. Government Response and Stimulus Measures
- 4.2.10.4. Future Outlook and Adaptation Strategies
- 4.2.11. Other Indicators
- 4.2.11.1. Fiscal Policy
- 4.2.11.2. Consumer Spending
- 4.2.11.3. Gross Domestic Product (GDP)
- 4.2.11.4. Employment
- 4.2.11.5. Taxes
- 4.2.11.6. R&D Innovation
- 4.2.11.7. Stock Market Performance
- 4.2.11.8. Supply Chain
- 4.2.11.9. Cross-Border Dynamics
- 4.2.1. Time Period
5. EXECUTIVE SUMMARY
6. INTRODUCTION
- 6.1. Chapter Overview
- 6.2. Overview of Flexible Display Market
- 6.2.1. Type of Display
- 6.2.2. Type of Material
- 6.2.3. Type of Product
- 6.2.4. Type of Application
- 6.2.5. Type of Panel Size
- 6.2.6. Type of Display Resolution
- 6.2.7. Type of Technology
- 6.3. Future Perspective
7. COMPETITIVE LANDSCAPE
- 7.1. Chapter Overview
- 7.2. Flexible Display: Overall Market Landscape
- 7.2.1. Analysis by Year of Establishment
- 7.2.2. Analysis by Company Size
- 7.2.3. Analysis by Location of Headquarters
- 7.2.4. Analysis by Ownership Structure
8. STARTUP ECOSYSTEM IN THE FLEXIBLE DISPLAY MARKET
- 8.1. Flexible Display Market: Market Landscape of Startups
- 8.1.1. Analysis by Year of Establishment
- 8.1.2. Analysis by Company Size
- 8.1.3. Analysis by Company Size and Year of Establishment
- 8.1.4. Analysis by Location of Headquarters
- 8.1.5. Analysis by Company Size and Location of Headquarters
- 8.1.6. Analysis by Ownership Structure
- 8.2. Key Findings
9. COMPANY PROFILES
- 9.1. Chapter Overview
- 9.2. AU Optronics*
- 9.2.1. Company Overview
- 9.2.2. Company Mission
- 9.2.3. Company Footprint
- 9.2.4. Management Team
- 9.2.5. Contact Details
- 9.2.6. Financial Performance
- 9.2.7. Operating Business Segments
- 9.2.8. Service / Product Portfolio (project specific)
- 9.2.9. MOAT Analysis
- 9.2.10. Recent Developments and Future Outlook
- 9.3. BOE Technology
- 9.4. Chunghwa Picture Tubes
- 9.5. Corning Incorporated
- 9.6. E-ink Holdings
- 9.7. FlexEnable
- 9.8. Guangzhou Oed Technologies
- 9.9. Huawei Technologies
- 9.10. Innolux
- 9.11. Japan Display
- 9.12. LG Display
- 9.13. Microtips
- 9.14. Plastic Logic
- 9.15. ROYOLE
- 9.16. Samsung Electronics
- 9.17. Sharp
- 9.18. TCL Electronics
10. VALUE CHAIN ANALYSIS
11. SWOT ANALYSIS
12. GLOBAL FLEXIBLE DISPLAY MARKET
- 12.1. Chapter Overview
- 12.2. Key Assumptions and Methodology
- 12.3. Trends Disruption Impacting Market
- 12.4. Global Flexible Display Market, Historical Trends (Since 2019) and Forecasted Estimates (Till 2035)
- 12.5. Multivariate Scenario Analysis
- 12.5.1. Conservative Scenario
- 12.5.2. Optimistic Scenario
- 12.6. Key Market Segmentations
13. MARKET OPPORTUNITIES BASED ON TYPE OF DISPLAY
- 13.1. Chapter Overview
- 13.2. Key Assumptions and Methodology
- 13.3. Revenue Shift Analysis
- 13.4. Market Movement Analysis
- 13.5. Penetration-Growth (P-G) Matrix
- 13.6. Flexible Display Market for EPD: Historical Trends (Since 2019) and Forecasted Estimates (Till 2035)
- 13.7. Flexible Display Market for LCD: Historical Trends (Since 2019) and Forecasted Estimates (Till 2035)
- 13.8. Flexible Display Market for LED: Historical Trends (Since 2019) and Forecasted Estimates (Till 2035)
- 13.9. Flexible Display Market for OLED: Historical Trends (Since 2019) and Forecasted Estimates (Till 2035)
- 13.10. Flexible Display Market for Others: Historical Trends (Since 2019) and Forecasted Estimates (Till 2035)
- 13.11. Data Triangulation and Validation
14. MARKET OPPORTUNITIES BASED ON TYPE OF MATERIAL
- 14.1. Chapter Overview
- 14.2. Key Assumptions and Methodology
- 14.3. Revenue Shift Analysis
- 14.4. Market Movement Analysis
- 14.5. Penetration-Growth (P-G) Matrix
- 14.6. Flexible Display Market for Glass: Historical Trends (Since 2019) and Forecasted Estimates (Till 2035)
- 14.7. Flexible Display Market for Plastic: Historical Trends (Since 2019) and Forecasted Estimates (Till 2035)
- 14.8. Flexible Display Market for Others: Historical Trends (Since 2019) and Forecasted Estimates (Till 2035)
- 14.9. Data Triangulation and Validation
15. MARKET OPPORTUNITIES BASED ON TYPE OF PRODUCT
- 15.1. Chapter Overview
- 15.2. Key Assumptions and Methodology
- 15.3. Revenue Shift Analysis
- 15.4. Market Movement Analysis
- 15.5. Penetration-Growth (P-G) Matrix
- 15.6. Flexible Display Market for Bendable and Foldable: Historical Trends (Since 2019) and Forecasted Estimates (Till 2035)
- 15.7. Flexible Display Market for Curved and Rollable: Historical Trends (Since 2019) and Forecasted Estimates (Till 2035)
- 15.8. Data Triangulation and Validation
16. MARKET OPPORTUNITIES BASED ON TYPE OF APPLICATION
- 16.1. Chapter Overview
- 16.2. Key Assumptions and Methodology
- 16.3. Revenue Shift Analysis
- 16.4. Market Movement Analysis
- 16.5. Penetration-Growth (P-G) Matrix
- 16.6. Flexible Display Market for Automotive: Historical Trends (Since 2019) and Forecasted Estimates (Till 2035)
- 16.7. Flexible Display Market for E-reader: Historical Trends (Since 2019) and Forecasted Estimates (Till 2035)
- 16.8. Flexible Display Market for PC's & Laptops: Historical Trends (Since 2019) and Forecasted Estimates (Till 2035)
- 16.9. Flexible Display Market for Smart Home Appliances: Historical Trends (Since 2019) and Forecasted Estimates (Till 2035)
- 16.10. Flexible Display Market for Smart Wearables: Historical Trends (Since 2019) and Forecasted Estimates (Till 2035)
- 16.11. Flexible Display Market for Smartphones and Tablets: Historical Trends (Since 2019) and Forecasted Estimates (Till 2035)
- 16.12. Flexible Display Market for Television: Historical Trends (Since 2019) and Forecasted Estimates (Till 2035)
- 16.13. Flexible Display Market for Others: Historical Trends (Since 2019) and Forecasted Estimates (Till 2035)
- 16.14. Data Triangulation and Validation
17. MARKET OPPORTUNITIES BASED ON TYPE OF PANEL SIZE
- 17.1. Chapter Overview
- 17.2. Key Assumptions and Methodology
- 17.3. Revenue Shift Analysis
- 17.4. Market Movement Analysis
- 17.5. Penetration-Growth (P-G) Matrix
- 17.6. Flexible Display Market for Up to 6": Historical Trends (Since 2019) and Forecasted Estimates (Till 2035)
- 17.7. Flexible Display Market for Above 50": Historical Trends (Since 2019) and Forecasted Estimates (Till 2035)
- 17.8. Flexible Display Market for 20-50": Historical Trends (Since 2019) and Forecasted Estimates (Till 2035)
- 17.9. Flexible Display Market for 6-20": Historical Trends (Since 2019) and Forecasted Estimates (Till 2035)
- 17.10. Data Triangulation and Validation
18. MARKET OPPORTUNITIES BASED ON DISPLAY RESOLUTION
- 18.1. Chapter Overview
- 18.2. Key Assumptions and Methodology
- 18.3. Revenue Shift Analysis
- 18.4. Market Movement Analysis
- 18.5. Penetration-Growth (P-G) Matrix
- 18.6. Flexible Display Market for Standard Definition (SD): Historical Trends (Since 2019) and Forecasted Estimates (Till 2035)
- 18.7. Flexible Display Market for High definition (HD): Historical Trends (Since 2019) and Forecasted Estimates (Till 2035)
- 18.8. Flexible Display Market for Ultra-High definition (UHD): Historical Trends (Since 2019) and Forecasted Estimates (Till 2035)
- 18.9. Data Triangulation and Validation
19. MARKET OPPORTUNITIES BASED ON TYPE OF TECHNOLOGY
- 19.1. Chapter Overview
- 19.2. Key Assumptions and Methodology
- 19.3. Revenue Shift Analysis
- 19.4. Market Movement Analysis
- 19.5. Penetration-Growth (P-G) Matrix
- 19.6. Flexible Display Market for Active Matrix: Historical Trends (Since 2019) and Forecasted Estimates (Till 2035)
- 19.7. Flexible Display Market for Passive Matrix: Historical Trends (Since 2019) and Forecasted Estimates (Till 2035)
- 19.8. Flexible Display Market for Quantum Dot Technology: Historical Trends (Since 2019) and Forecasted Estimates (Till 2035)
- 19.9. Data Triangulation and Validation
20. MARKET OPPORTUNITIES FLEXIBLE DISPLAY IN NORTH AMERICA
- 20.1. Chapter Overview
- 20.2. Key Assumptions and Methodology
- 20.3. Revenue Shift Analysis
- 20.4. Market Movement Analysis
- 20.5. Penetration-Growth (P-G) Matrix
- 20.6. Flexible Display Market in North America: Historical Trends (Since 2019) and Forecasted Estimates (Till 2035)
- 20.6.1. Flexible Display Market in the US: Historical Trends (Since 2019) and Forecasted Estimates (Till 2035)
- 20.6.2. Flexible Display Market in Canada: Historical Trends (Since 2019) and Forecasted Estimates (Till 2035)
- 20.6.3. Flexible Display Market in Mexico: Historical Trends (Since 2019) and Forecasted Estimates (Till 2035)
- 20.6.4. Flexible Display Market in Other North American Countries: Historical Trends (Since 2019) and Forecasted Estimates (Till 2035)
- 20.7. Data Triangulation and Validation
21. MARKET OPPORTUNITIES FOR FLEXIBLE DISPLAY IN EUROPE
- 21.1. Chapter Overview
- 21.2. Key Assumptions and Methodology
- 21.3. Revenue Shift Analysis
- 21.4. Market Movement Analysis
- 21.5. Penetration-Growth (P-G) Matrix
- 21.6. Flexible Display Market in Europe: Historical Trends (Since 2019) and Forecasted Estimates (Till 2035)
- 21.6.1. Flexible Display Market in Austria: Historical Trends (Since 2019) and Forecasted Estimates (Till 2035)
- 21.6.2. Flexible Display Market in Belgium: Historical Trends (Since 2019) and Forecasted Estimates (Till 2035)
- 21.6.3. Flexible Display Market in Denmark: Historical Trends (Since 2019) and Forecasted Estimates (Till 2035)
- 21.6.4. Flexible Display Market in France: Historical Trends (Since 2019) and Forecasted Estimates (Till 2035)
- 21.6.5. Flexible Display Market in Germany: Historical Trends (Since 2019) and Forecasted Estimates (Till 2035)
- 21.6.6. Flexible Display Market in Ireland: Historical Trends (Since 2019) and Forecasted Estimates (Till 2035)
- 21.6.7. Flexible Display Market in Italy: Historical Trends (Since 2019) and Forecasted Estimates (Till 2035)
- 21.6.8. Flexible Display Market in Netherlands: Historical Trends (Since 2019) and Forecasted Estimates (Till 2035)
- 21.6.9. Flexible Display Market in Norway: Historical Trends (Since 2019) and Forecasted Estimates (Till 2035)
- 21.6.10. Flexible Display Market in Russia: Historical Trends (Since 2019) and Forecasted Estimates (Till 2035)
- 21.6.11. Flexible Display Market in Spain: Historical Trends (Since 2019) and Forecasted Estimates (Till 2035)
- 21.6.12. Flexible Display Market in Sweden: Historical Trends (Since 2019) and Forecasted Estimates (Till 2035)
- 21.6.13. Flexible Display Market in Switzerland: Historical Trends (Since 2019) and Forecasted Estimates (Till 2035)
- 21.6.14. Flexible Display Market in the UK: Historical Trends (Since 2019) and Forecasted Estimates (Till 2035)
- 21.6.15. Flexible Display Market in Other European Countries: Historical Trends (Since 2019) and Forecasted Estimates (Till 2035)
- 21.7. Data Triangulation and Validation
22. MARKET OPPORTUNITIES FOR FLEXIBLE DISPLAY IN ASIA
- 22.1. Chapter Overview
- 22.2. Key Assumptions and Methodology
- 22.3. Revenue Shift Analysis
- 22.4. Market Movement Analysis
- 22.5. Penetration-Growth (P-G) Matrix
- 22.6. Flexible Display Market in Asia: Historical Trends (Since 2019) and Forecasted Estimates (Till 2035)
- 22.6.1. Flexible Display Market in China: Historical Trends (Since 2019) and Forecasted Estimates (Till 2035)
- 22.6.2. Flexible Display Market in India: Historical Trends (Since 2019) and Forecasted Estimates (Till 2035)
- 22.6.3. Flexible Display Market in Japan: Historical Trends (Since 2019) and Forecasted Estimates (Till 2035)
- 22.6.4. Flexible Display Market in Singapore: Historical Trends (Since 2019) and Forecasted Estimates (Till 2035)
- 22.6.5. Flexible Display Market in South Korea: Historical Trends (Since 2019) and Forecasted Estimates (Till 2035)
- 22.6.6. Flexible Display Market in Other Asian Countries: Historical Trends (Since 2019) and Forecasted Estimates (Till 2035)
- 22.7. Data Triangulation and Validation
23. MARKET OPPORTUNITIES FOR FLEXIBLE DISPLAY IN MIDDLE EAST AND NORTH AFRICA (MENA)
- 23.1. Chapter Overview
- 23.2. Key Assumptions and Methodology
- 23.3. Revenue Shift Analysis
- 23.4. Market Movement Analysis
- 23.5. Penetration-Growth (P-G) Matrix
- 23.6. Flexible Display Market in Middle East and North Africa (MENA): Historical Trends (Since 2019) and Forecasted Estimates (Till 2035)
- 23.6.1. Flexible Display Market in Egypt: Historical Trends (Since 2019) and Forecasted Estimates (Till 205)
- 23.6.2. Flexible Display Market in Iran: Historical Trends (Since 2019) and Forecasted Estimates (Till 2035)
- 23.6.3. Flexible Display Market in Iraq: Historical Trends (Since 2019) and Forecasted Estimates (Till 2035)
- 23.6.4. Flexible Display Market in Israel: Historical Trends (Since 2019) and Forecasted Estimates (Till 2035)
- 23.6.5. Flexible Display Market in Kuwait: Historical Trends (Since 2019) and Forecasted Estimates (Till 2035)
- 23.6.6. Flexible Display Market in Saudi Arabia: Historical Trends (Since 2019) and Forecasted Estimates (Till 2035)
- 23.6.7. Flexible Display Market in United Arab Emirates (UAE): Historical Trends (Since 2019) and Forecasted Estimates (Till 2035)
- 23.6.8. Flexible Display Market in Other MENA Countries: Historical Trends (Since 2019) and Forecasted Estimates (Till 2035)
- 23.7. Data Triangulation and Validation
24. MARKET OPPORTUNITIES FOR FLEXIBLE DISPLAY IN LATIN AMERICA
- 24.1. Chapter Overview
- 24.2. Key Assumptions and Methodology
- 24.3. Revenue Shift Analysis
- 24.4. Market Movement Analysis
- 24.5. Penetration-Growth (P-G) Matrix
- 24.6. Flexible Display Market in Latin America: Historical Trends (Since 2019) and Forecasted Estimates (Till 2035)
- 24.6.1. Flexible Display Market in Argentina: Historical Trends (Since 2019) and Forecasted Estimates (Till 2035)
- 24.6.2. Flexible Display Market in Brazil: Historical Trends (Since 2019) and Forecasted Estimates (Till 2035)
- 24.6.3. Flexible Display Market in Chile: Historical Trends (Since 2019) and Forecasted Estimates (Till 2035)
- 24.6.4. Flexible Display Market in Colombia Historical Trends (Since 2019) and Forecasted Estimates (Till 2035)
- 24.6.5. Flexible Display Market in Venezuela: Historical Trends (Since 2019) and Forecasted Estimates (Till 2035)
- 24.6.6. Flexible Display Market in Other Latin American Countries: Historical Trends (Since 2019) and Forecasted Estimates (Till 2035)
- 24.7. Data Triangulation and Validation
25. MARKET OPPORTUNITIES FOR FLEXIBLE DISPLAY IN REST OF THE WORLD
- 25.1. Chapter Overview
- 25.2. Key Assumptions and Methodology
- 25.3. Revenue Shift Analysis
- 25.4. Market Movement Analysis
- 25.5. Penetration-Growth (P-G) Matrix
- 25.6. Flexible Display Market in Rest of the World: Historical Trends (Since 2019) and Forecasted Estimates (Till 2035)
- 25.6.1. Flexible Display Market in Australia: Historical Trends (Since 2019) and Forecasted Estimates (Till 2035)
- 25.6.2. Flexible Display Market in New Zealand: Historical Trends (Since 2019) and Forecasted Estimates (Till 2035)
- 25.6.3. Flexible Display Market in Other Countries
- 25.7. Data Triangulation and Validation
24. TABULATED DATA
25. LIST OF COMPANIES AND ORGANIZATIONS
26. CUSTOMIZATION OPPORTUNITIES
27. ROOTS SUBSCRIPTION SERVICES
28. AUTHOR DETAILS
 软性显示器市场:按显示类型、柔性类型、材料和应用划分-2026-2032年全球市场预测
 软性显示器市场分析及预测(至2035年):依类型、产品类型、技术、组件、应用、材料类型、装置、製程及最终用户划分
 全球软性显示器基板市场:预测(至2034年)-按材料类型、应用、技术、最终用户和地区分類的分析
 2026年全球软性显示器市场报告电子级超薄软性玻璃市场(依产品类型、玻璃厚度、最终用途和产业划分)-2026-2032年全球预测
 软性显示器市场规模、份额及成长分析(依基板材料、应用、面板尺寸及地区划分)-2026-2033年产业预测
 柔性显示技术市场-全球产业规模、份额、趋势、机会和预测,依显示类型、技术、终端用户产业、地区和竞争格局划分,2020-2030年预测
 软性显示器:市场占有率分析、产业趋势、统计数据和成长预测(2025-2030 年)
 2025 年至 2033 年柔性显示器市场报告(按显示器类型(OLED、LCD、电子纸显示器等)、基板材料、应用和地区)
 软性显示器市场:按显示器类型、基板材料、应用和地区划分