


 |
市场调查报告书
商品编码
1891238
无细胞蛋白表达市场 - 无细胞表达试剂盒及服务提供者:产业趋势及全球预测(至 2035 年) - 依无细胞系统类型、宿主生物、表达方法、最终用户及主要地区划分Cell Free Protein Expression Market - Cell free Expression Kits and Service Providers: Industry Trends and Global Forecasts, Till 2035 - Distribution by Type of Cell Free System, Host Organism, Expression Method, End-User and Key Geographical Regions |
||||||
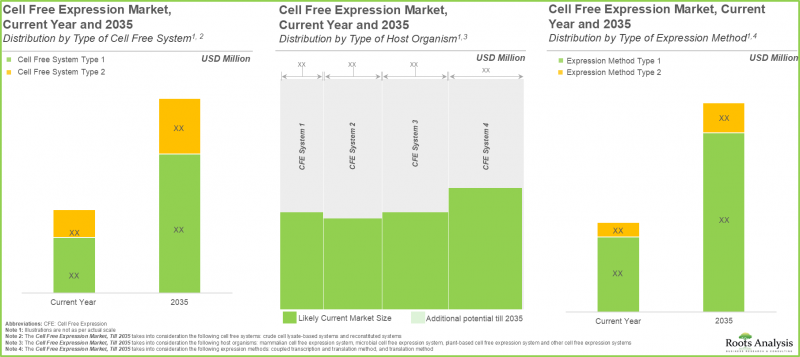
全球无细胞蛋白表现市场预计将以 6.9% 的复合年增长率成长,从目前的 3.22 亿美元成长至 2035 年的 6.27 亿美元。
无细胞系统市场
市场规模及机会分析基于以下参数进行细分:
依无细胞系统类型
- 基于粗细胞裂解液的系统
- 重组系统
依宿主生物
- 微生物无细胞蛋白质表现系统
- 哺乳动物无细胞蛋白质表现系统
- 植物无细胞蛋白质表现系统系统
- 其他
依表达方法
- 转录-翻译连接法
- 翻译方法
依最终使用者
- 製药和生技公司
- 学术和研究机构
- 其他
地理区域
- 北美
- 欧洲
- 亚太地区
- 其他地区
无细胞表现系统市场:成长与趋势
近年来,无细胞表现系统已成为传统细胞蛋白生产方法的可行替代方案。传统生物製造被认为是一个复杂的过程,需要活细胞和特定的环境来维持细胞生长所需的稳态。此外,细胞生物製造在生物製品的有效生产方面存在根本性的限制。另一方面,无细胞蛋白质表现系统是一种体外平台,它利用活细胞的转录和翻译机制,透过细胞裂解液来表达蛋白质,从而生产各种生物製品,尤其是蛋白质。多家公司正在开发用于酵素(一种蛋白质)无细胞表现的试剂盒。例如,生物技术公司 Enzymit 利用无细胞技术生产价格低廉的酵素。
一般来说,无细胞蛋白表达系统相比传统方法具有诸多优势,包括能够透过修饰合成客製化的结构单元来产生多种目标分子、提高产量、缩短开发週期以及降低生产成本。无细胞蛋白表现可以透过无细胞系统或市售的无细胞表现试剂盒进行。
无细胞蛋白表达系统已被证明能够促进多种复杂蛋白质的合成,包括毒性蛋白质、膜蛋白以及具有翻译后修饰的蛋白质,这些蛋白质在基于细胞的系统中难以生产。随着生物製剂需求的成长,无细胞表现技术已成为生物製药企业关注的重点领域。
无细胞蛋白表现市场:关键洞察
本报告深入分析了无细胞蛋白表达系统市场的现状,并指出了该行业的潜在成长机会。报告的主要发现包括:
- 目前,全球有超过35家公司声称提供用于合成各种生物分子的无细胞表现服务。
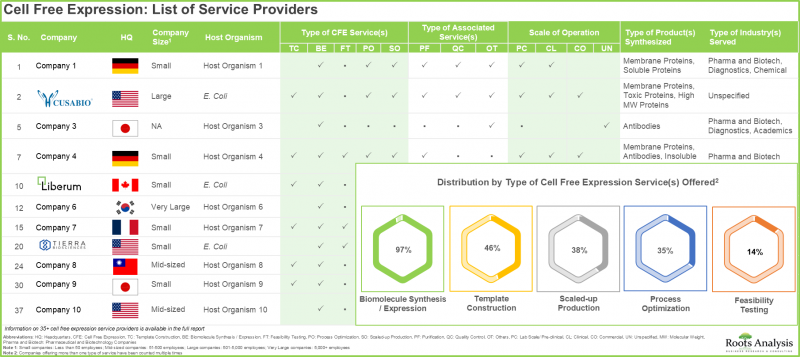
- 当前的市场格局较为分散,既有新进者,也有老牌公司,共同满足各行各业的需求。 这些公司大多位于美国。
- 为了在该领域建立竞争优势,各利益相关者正积极加强现有能力并增加新能力,以扩展各自的服务组合。
- 目前,市面上已有超过90种无细胞表现试剂盒,用于合成各种类型的生物分子。这些试剂盒利用不同类型的宿主生物进行无细胞表现。
- 无细胞表现试剂盒利用多种无细胞表现系统合成各种类型的生物药物。其中大多数含有蛋白质,其次是寡核苷酸等。
- 对难以表达的生物分子的需求不断增长,推动了无细胞表达技术的发展,迫使各利益相关者加强其产品线。
- 自2015年以来,各利害关係人已申请或获得超过430项专利,以保护该领域产生的智慧财产权。
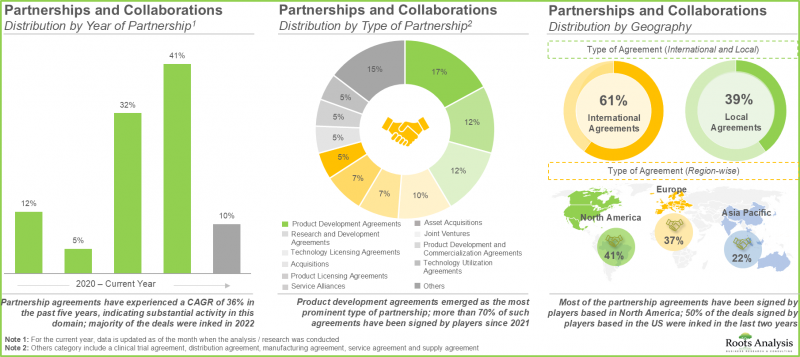
- 人们对该领域日益增长的兴趣也体现在合作活动的增加上,其中产品开发协议最为常见。
- 鑑于该领域的机遇,过去六年里,许多投资者已在多轮融资中投入超过80亿美元。
- 预计到2035年,无细胞表现市场将以6.9%的复合年增长率增长,而这一机会预计将广泛分布于各种类型的无细胞系统、宿主生物和表达方法中。
- 预计该领域的成长主要受生物製剂需求成长的驱动。北美预计将占显着的市场占有率,到2035年将超过50%。
无细胞蛋白表现市场:主要细分市场
目前,基于粗细胞裂解液的系统占了无细胞系统市场的大部分占有率。
依无细胞系统类型划分,市场分为以粗细胞裂解液为基础的系统和重组系统。基于粗细胞裂解液的系统占了大部分市场占有率(90%),预计这一比例将保持不变。预计重组系统细分市场在预测期内将以 10.3% 的复合年增长率成长。
预计基于粗细胞裂解液的系统将继续占无细胞系统市场的大部分占有率。
依表现方法划分,无细胞系统市场分为转录/翻译偶联繫统及翻译系统。预计基于粗细胞裂解液的系统将占超过 95% 的市场占有率,在预测期内以 6.6% 的复合年增长率增长。
目前,微生物无细胞表现系统占最大的市场。
依类型划分,无细胞蛋白质表现系统分为微生物、哺乳动物、植物和其他无细胞蛋白质表现系统。预计微生物无细胞蛋白表达系统将占约 60% 的市场占有率,其次是哺乳动物无细胞蛋白表达系统 (25%) 和植物无细胞蛋白表达系统 (10%)。
预计未来製药和生技公司将占无细胞系统市场最大的占有率。
依最终用户划分,无细胞系统市场可分为学术研究机构、製药和生物技术公司以及其他最终用户。製药和生物技术公司占大部分市场占有率 (65%),预计将以 7.9% 的复合年增长率成长。
预计未来北美将引领无细胞系统市场。
依地理区域划分,单细胞定序市场可分为北美、欧洲、亚太地区及世界其他地区。北美占超过 50% 的市场占有率,其次是欧洲 (31%) 和亚太地区 (12%)。
无细胞蛋白表现市场代表性公司
- BioLinker
- Biotechrabbit
- CellFreeSciences
- Creative Biolabs
- CUSABIO
- Daicel Arbor Biosciences
- LenioBio
- Promega
- Thermo Fisher Scientific
- Touchlight
无细胞蛋白表现系统市场:研究范围
- 市场规模和机会分析:本报告对无细胞蛋白表达系统市场进行了详细分析,重点关注以下关键市场细分:[A] 无细胞系统类型,[B] 宿主生物,[C] 表达方法,[D] 最终用户,以及 [E] 主要地区。
- 市场概况 1:基于以下几个相关参数,对无细胞蛋白表达服务提供者进行详细评估:[A] 成立年份,[B] 公司规模,[C] 总部所在地,[D] 提供的无细胞服务类型,[E] 提供的相关服务类型,[F] 宿主生物类型,[G] 合成业务类型,[H] 业务规模。
- 市场概况 2:基于以下相关参数,对当前无细胞蛋白表达试剂盒市场概况进行详细评估:[A] 无细胞系统类型,[B] 宿主生物类型,[C] 表达方法类型,[D] 合成产品类型,[E] 使用的模板类型,[F] 相容的启动子类型,[G] 基础的反应主要公司。
- 公司竞争力分析:对无细胞表达服务提供者进行全面的竞争分析,重点在于[A]供应能力和[B]服务能力等因素。
- 产品竞争分析:基于各种相关参数(即[A]研发能力和[B]产品竞争)对无细胞表达试剂盒进行产品竞争分析。
- 公司简介:详细介绍活跃于该领域的关键参与者。本分析重点在于目前参与无细胞系统市场的公司,内容涵盖[A]成立年份、[B]总部所在地、[C]无细胞表达服务组合、[D]近期发展和[E]未来展望。
- 合作关係:基于各种相关参数(例如[A]合作年份、[B]合作类型、[C]合作伙伴类型和[D]最活跃的参与者)对无细胞系统市场利害关係人之间达成的合作关係进行深入分析。
- 融资与投资分析:基于相关参数(例如[A]融资年份、[B]投资金额、[C]融资类型、[D]区域分布和[E]最活跃参与者)对开发公司筹集的各种资金和投资进行全面审查。
- 专利分析:对已提交和已註册的无细胞系统专利进行全面审查。 对所列各项专利进行详细分析,考虑以下参数:[A] 公开年份,[B] 专利类型,[C] 申请年份,[D] 专利管辖区,以及 [E] 主要个人受让人。
目录
第一章:前言
第二章:摘要整理
第三章:导论
- 章节概述
- 无细胞系统简介
- 无细胞生物製造概述
- 无细胞生物製造的应用
- 未来展望
第四章:市场概况:无细胞蛋白质表现服务提供者
- 章节概述
- 无细胞蛋白表达服务提供者:市场概况
第五章:市场概况:无细胞表达试剂盒
- 章节概述
- 无细胞蛋白表现试剂盒:市场概况
- 无细胞表达试剂盒供应商现状
第六章 无细胞蛋白表达服务提供者:公司竞争分析
- 章节概述
- 假设和关键参数
- 研究方法
- 公司竞争分析:无细胞蛋白质表现服务供应商
第七章 无细胞表现试剂盒:产物竞争分析
- 章节概述
- 假设和关键参数
- 研究方法
- 产物竞争分析:无细胞表现试剂盒
第八章 公司简介:无细胞蛋白表达服务提供者
- 章节概述
- BioLinker
- CUSABIO
- LenioBio
- Touchlight
第九章 公司简介:无细胞蛋白表达试剂盒供应商
- 章节概述
- biotechrabbit
- CellFree Sciences
- Creative Biolabs
- Diacel Arbor Biosciences
- Promega
- Thermo Fisher Scientific
第十章:合作与伙伴关係
- 章节概述
- 合作模式
- 无细胞系统:合作与伙伴关係
第十一章:资金与投资分析
- 章节概述
- 融资类型
- 无细胞系统:融资与投资分析
第12章 专利分析
- 章节概述
- 范围与研究方法
- 无细胞系统:专利分析
- 无细胞系统:专利基准分析
- 无细胞系统:专利评估
- 关键专利:引用分析
第13章:市场预测与机会分析
- 章节概述
- 关键假设与预测研究方法
- 2035年全球无细胞蛋白表现市场展望
第14章:高阶主管洞察
第15章:结论
第十六章:附录一:表格资料
第十七章:附录二:公司与组织清单
Cell Free Protein Expression Market
As per Roots Analysis, the global cell free expression market size is estimated to grow from USD 322 million in the current year to USD 627 million by 2035, at a CAGR of 6.9% during the forecast period, till 2035.
Cell Free Systems Market
The market sizing and opportunity analysis has been segmented across the following parameters:
Type of Cell Free System
- Crude Cell Lysate-Based Systems
- Reconstituted Systems
Type of Host Organism
- Microbial Cell Free Expression Systems
- Mammalian Cell Free Expression Systems
- Plant-based Cell Free Expression Systems
- Other Cell Free Expression Systems
Type of Expression Method
- Coupled Transcription and Translation Method
- Translation Method
End-user
- Pharmaceutical and Biotechnology Companies
- Academic and Research Institutes
- Other End-Users
Geographical Regions
- North America
- Europe
- Asia-Pacific
- Rest of the World
Cell Free Expression Systems Market: Growth and Trends
Over the years cell-free expression systems have become a viable alternative to the traditional cell-based protein production method. Traditional biomanufacturing is recognized as a complicated procedure that necessitates living cells and particular environments to sustain adequate homeostasis for cell proliferation. Additionally, cell-based biomanufacturing presents fundamental constraints on the efficient generation of biologics. Alternatively, cell-free protein expression systems are in vitro platforms that utilize the transcription and translation mechanisms of living cells, achieved through cell lysates, to produce different kinds of biologics, especially proteins. Several players have developed kits for the cell-free expression of enzymes, which are a category of proteins. Notably, Enzymit, a bioproduction company, employs cell-free technology to produce affordable enzymes.
In general, cell-free protein expression systems provide numerous benefits compared to the conventional method, such as the capacity to generate a wide variety of target molecules by modifying components tailored for their synthesis, increased yield, reduced development periods, and lower production costs. Protein expression without cells is conducted using cell-free systems or commercially available cell-free expression kits.
Cell-free protein expression systems have shown the ability to facilitate the synthesis of various complex proteins, such as toxic proteins, membrane proteins, and other proteins modified post-translationally, which are often difficult to produce with cell-based systems. With the increasing need for biologic products, cell-free expression has emerged as a major sector of interest for those involved in the biopharmaceutical sector.
Cell Free Protein Expression Market: Key Insights
The report delves into the current state of the cell free protein expression system market and identifies potential growth opportunities within industry. Some key findings from the report include:
- Presently, more than 35 players across the globe claim to offer cell free expression services for synthesis of a variety of biomolecules.
- The current market landscape is fragmented, featuring the presence of both new entrants and established players catering to needs of various industries; majority of these players are based in the US.
- In pursuit of building a competitive edge in this field, stakeholders are actively upgrading their existing capabilities and adding new competencies in order to enhance their respective service portfolios.
- More than 90 cell free expression kits are currently available in the market for the synthesis of different types of biomolecules; these kits utilize different types of host organisms for cell free expression.
- Cell free expression kits utilize a range of cell free expression systems for the synthesis of different types of biologics; majority of these include proteins, followed by oligonucleotides and others.
- Owing to the rise in demand for difficult to express biomolecules, the requirement of cell free expression is increasing, prompting the stakeholders to upgrade their product offerings.
- Since 2015, more than 430 patents have been filed / granted by various stakeholders in order to protect the intellectual property generated within this field.
- The growing interest is evident from the rise in partnership activity; product development agreements have been the most common.
- Several investors having realized the opportunity within this domain, have invested more than USD 8 billion across various funding rounds in the past six years.
- The cell free expression market is likely to grow at a CAGR of 6.9%, till 2035; this opportunity is expected to be well distributed across different types of cell free systems, host organisms and expression methods.
- Growth in this domain is anticipated to be primarily driven by the rising demand for biologics; North America is expected to capture larger share (over 50%) of the market by 2035.
Cell Free Protein Expression Market: Key Segments
Crude Cell Lysate-based Systems Capture Majority of the Current Cell Free Systems Market Share
In terms of type of cell-free system, the market is segmented across Crude Cell Lysate-Based Systems and Reconstituted Systems. Majority of the market share is captured by Crude Cell Lysate-based Systems (90%) and this trend is unlikely to change in the future. Reconstituted systems segment is likely to grow at a CAGR of 10.3% during the forecast period.
Crude Cell Lysate-based Systems is Likely to Capture Majority of the Cell Free Systems Market Share in the Future
In terms of type of expression method, the cell free systems market is segmented across coupled transcription and translation method and translation method. Over 95% of the market share is likely to be captured by crude cell lysate-based systems, growing at a CAGR of 6.6% during the forecast period.
Currently, Microbial Cell-free Expression Systems Hold the Highest Cell Free Systems Market Share
In terms of type of cell-free expression system, the cell free systems market is segmented across microbial, mammalian, plant-based and other cell-free expression systems. Around 60% of the market share is likely to be captured by microbial cell free expression systems, followed by mammalian cell free expression systems (25%) and plant-based cell free expression systems (10%).
Pharmaceutical and Biotechnology Companies are Anticipated to Hold Maximum Cell Free Systems Market Share in the Future
In terms of end-users, the cell free system market is segmented across academic and research institutes, pharmaceutical and biotechnology companies, and other end-users. Majority of the market share is likely to held by pharmaceutical and biotechnology companies (65%), growing at a CAGR of 7.9%.
North America is Likely to Propel the Cell Free Systems Market in the Future
In terms of geographical regions, the single-cell sequencing market is segmented across North America, Europe, Asia-Pacific and Rest of the World. Over 50% of the market share is captured by North America, followed by Europe (31%) and Asia-Pacific (12%).
Example Players in the Cell Free Protein Expression Market
- BioLinker
- Biotechrabbit
- CellFreeSciences
- Creative Biolabs
- CUSABIO
- Daicel Arbor Biosciences
- LenioBio
- Promega
- Thermo Fisher Scientific
- Touchlight
Cell Free Protein Expression Systems Market: Research Coverage
- Market Sizing and Opportunity Analysis: The report features an in-depth analysis of the cell free protein systems market, focusing on key market segments, including [A] type of cell free system, [B] type of host mechanism, [C] type of expression method, [D] end-user, and [E] key geographical regions.
- Market Landscape 1: A detailed assessment of cell free protein expression service providers, based on several relevant parameters, such as [A] year of establishment, [B] company size, [C] location of headquarters, [D] type of cell free service(s) offered, [E] type of associated service(s) offered, [F] type of host organism, [G] type of product(s) synthesized, [H] scale of operation and [I] type of industry served.
- Market Landscape 2: A detailed assessment of the current market landscape of cell free protein expression kits, based on several relevant parameters, such as [A] type of cell free system, [B] type of host organism, [C] type of expression method, [D] type of product(s) synthesized, [E] type of template(s) used, [F] type of compatible promoter(s), [G] type of reaction format, [H] year of establishment, [I] company size (in terms of employee count), [J] location of headquarters and [K] leading players.
- Company Competitiveness Analysis: A comprehensive competitive analysis of cell free expression service providers, examining factors, such as [A] supplier strength and [B] service strength.
- Product Competitiveness Analysis: A product competitiveness analysis of cell free expression kits based on various relevant parameters, namely [A] developer power and [B] product competitiveness.
- Company Profiles: In-depth profiles of prominent players engaged in this domain, that are currently involved in cell free systems market, focusing on [A] year of establishment, [B] location of headquarters, [C] cell free expression service portfolio, [D] recent developments and [E] an informed future outlook.
- Partnerships and Collaborations An insightful analysis of the partnerships and collaborations inked between stakeholders engaged in the cell free systems market based on various relevant parameters, including [A] year of partnership, [B] type of partnership, [C] type of partner and [D] most active players.
- Funding and Investment Analysis: A comprehensive examination of various funding and investments raised by developers, based on relevant parameters, including [A] such as year of funding, [B] amount invested [C] type of funding, [D] regional distribution, and [E] most active players.
- Patent Analysis: An in-depth analysis of various patents that have been filed / granted for cell free systems, taking into consideration parameters, such as [A] publication year, [B] type of patent, [C] application year, [D] patent jurisdiction, [E] leading individual assignees.
Key Questions Answered in this Report
- How many companies are currently engaged in this market?
- Which are the leading companies in this market?
- What is the current global capacity of developers?
- What factors are likely to influence the evolution of this market?
- What is the current and future market size?
- What is the CAGR of this market?
- How is the current and future market opportunity likely to be distributed across key market segments?
Reasons to Buy this Report
- The report provides a comprehensive market analysis, offering detailed revenue projections of the overall market and its specific sub-segments. This information is valuable to both established market leaders and emerging entrants.
- Stakeholders can leverage the report to gain a deeper understanding of the competitive dynamics within the market. By analyzing the competitive landscape, businesses can make informed decisions to optimize their market positioning and develop effective go-to-market strategies.
- The report offers stakeholders a comprehensive overview of the market, including key drivers, barriers, opportunities, and challenges. This information empowers stakeholders to stay abreast of market trends and make data-driven decisions to capitalize on growth prospects.
Additional Benefits
- Complimentary PPT Insights Packs
- Complimentary Excel Data Packs for all Analytical Modules in the Report
- 15% Free Content Customization
- Detailed Report Walkthrough Session with Research Team
- Free Updated report if the report is 6-12 months old or older
TABLE OF CONTENTS
1. PREFACE
- 1.1. Introduction
- 1.2. Key Market Insights
- 1.3. Scope of the Report
- 1.4. Research Methodology
- 1.5. Frequently Asked Questions
- 1.6. Chapter Outlines
2. EXECUTIVE SUMMARY
3. INTRODUCTION
- 3.1. Chapter Overview
- 3.2. Introduction to Cell Free Systems
- 3.3. Overview of Cell Free Biomanufacturing
- 3.3.1. Advantages
- 3.3.2. Challenges
- 3.4. Applications of Cell Free Biomanufacturing
- 3.4.1. Applications in Healthcare Domain
- 3.4.2. Applications in Other Domains
- 3.5. Future Perspectives
4. MARKET LANDSCAPE: CELL FREE EXPRESSION SERVICE PROVIDERS
- 4.1. Chapter Overview
- 4.2. Cell Free Expression Service Providers: Overall Market Landscape
- 4.2.1. Analysis by Year of Establishment
- 4.2.2. Analysis by Company Size
- 4.2.3. Analysis by Location of Headquarters
- 4.2.4. Analysis by Type of Cell Free Expression Service(s) Offered
- 4.2.5. Analysis by Type of Associated Service(s) Offered
- 4.2.6. Analysis by Type of Host Organism
- 4.2.7. Analysis by Type of Product(s) Synthesized
- 4.2.8. Analysis by Scale of Operation
- 4.2.9. Analysis by Type of Industry Served
5. MARKET LANDSCAPE: CELL FREE EXPRESSION KITS
- 5.1. Chapter Overview
- 5.2. Cell Free Expression Kits: Overall Market Landscape
- 5.2.1. Analysis by Type of Cell Free System
- 5.2.2. Analysis by Type of Host Organism
- 5.2.3. Analysis by Type of Expression Method
- 5.2.4. Analysis by Type of Product(s) Synthesized
- 5.2.5. Analysis by Type of Template(s) Used
- 5.2.6. Analysis by Type of Compatible Promoter(s)
- 5.2.7. Analysis by Type of Reaction Format
- 5.2.8. Analysis by Yield of Positive Control
- 5.2.9. Analysis by Reaction Volume
- 5.2.10. Analysis by Reaction Temperature
- 5.2.11. Analysis by Incubation Time
- 5.2.12. Analysis by Number of Reactions per Kit
- 5.2.13. Analysis by Kit Price
- 5.3. Cell Free Expression Kit Providers Landscape
- 5.3.1. Analysis by Year of Establishment
- 5.3.2. Analysis by Company Size
- 5.3.3. Analysis by Location of Headquarters
- 5.3.4. Most Active Players: Analysis by Number of Cell free Expression Kits Developed
6. CELL FREE EXPRESSION SERVICE PROVIDERS: COMPANY COMPETITIVENESS ANALYSIS
- 6.1. Chapter Overview
- 6.2. Assumptions and Key Parameters
- 6.3. Methodology
- 6.4. Company Competitiveness Analysis: Cell Free Expression Service Providers
- 6.4.1. Company Competitiveness Analysis: Small Service Providers
- 6.4.2. Company Competitiveness Analysis: Mid-sized Service Providers
- 6.4.3. Company Competitiveness Analysis: Large and Very Service Providers
7. CELL FREE EXPRESSION KITS: PRODUCT COMPETITIVENESS ANALYSIS
- 7.1. Chapter Overview
- 7.2. Assumptions and Key Parameters
- 7.3. Methodology
- 7.4. Product Competitiveness Analysis: Cell Free Expression Kits
- 7.4.1. Product Competitiveness Analysis: Cell Free Expression Kits Developed by Players based in North America
- 7.4.2. Product Competitiveness Analysis: Cell Free Expression Kits Developed by Players based in Europe
- 7.4.3. Product Competitiveness Analysis: Cell Free Expression Kits Developed by Players based in Asia-Pacific and Rest of the World
8. COMPANY PROFILES: CELL FREE EXPRESSION SERVICE PROVIDERS
- 8.1. Chapter Overview
- 8.2. BioLinker
- 8.2.1. Company Overview
- 8.2.2. Cell Free Expression Service Portfolio
- 8.2.3. Recent Developments and Future Outlook
- 8.3. CUSABIO
- 8.3.1. Company Overview
- 8.3.2. Cell Free Expression Service Portfolio
- 8.3.3. Recent Developments and Future Outlook
- 8.4. LenioBio
- 8.4.1. Company Overview
- 8.4.2. Cell Free Expression Service Portfolio
- 8.4.3. Recent Developments and Future Outlook
- 8.5. Touchlight
- 8.5.1. Company Overview
- 8.5.2. Cell Free Expression Service Portfolio
- 8.5.3. Recent Developments and Future Outlook
9. COMPANY PROFILES: CELL FREE EXPRESSION KIT PROVIDERS
- 9.1. Chapter Overview
- 9.2. biotechrabbit
- 9.2.1. Company Overview
- 9.2.2. Cell Free Expression Kit Portfolio
- 9.2.3 Recent Developments and Future Outlook
- 9.3. CellFree Sciences
- 9.3.1. Company Overview
- 9.3.2. Cell Free Expression Kit Portfolio
- 9.3.3 Recent Developments and Future Outlook
- 9.4. Creative Biolabs
- 9.4.1. Company Overview
- 9.4.2. Cell Free Expression Kit Portfolio
- 9.4.3 Recent Developments and Future Outlook
- 9.5. Diacel Arbor Biosciences
- 9.5.1. Company Overview
- 9.5.2. Cell Free Expression Kit Portfolio
- 9.5.3 Recent Developments and Future Outlook
- 9.6. Promega
- 9.6.1. Company Overview
- 9.6.2. Cell Free Expression Kit Portfolio
- 9.6.3 Recent Developments and Future Outlook
- 9.7. Thermo Fisher Scientific
- 9.7.1. Company Overview
- 9.7.2. Cell Free Expression Kit Portfolio
- 9.7.3. Recent Developments and Future Outlook
10. PARTNERSHIPS AND COLLABORATIONS
- 10.1. Chapter Overview
- 10.2. Partnership Models
- 10.3. Cell free System: Partnerships and Collaborations
- 10.3.1 Analysis by Year of Partnership
- 10.3.2. Analysis by Type of Partnership
- 10.3.3. Analysis by Year and Type of Partnership
- 10.3.4. Analysis by Focus Area
- 10.3.5. Analysis by Type of Partner
- 10.3.6. Most Active Players: Analysis by Number of Partnerships
- 10.3.7. Local and International Agreements
- 10.3.8. Intercontinental and Intracontinental Agreements
11. FUNDING AND INVESTMENT ANALYSIS
- 11.1. Chapter Overview
- 11.2. Types of Funding
- 11.3. Cell free System: Funding and Investment Analysis
- 11.3.1. Analysis of Instances by Year of Investment
- 11.3.2. Analysis of Amount Invested by Year of Investment
- 11.3.3. Analysis of Instances by Type of Funding
- 11.3.4. Analysis of Amount Invested by Type of Funding
- 11.3.5. Analysis by Instances of Type of Investor
- 11.3.6. Most Active Players: Analysis by Number of Instances
- 11.3.7. Most Active Players: Analysis by Amount Invested
- 11.3.8. Analysis of Amount Invested by Geography
- 11.3.8.1. Analysis by Region
- 11.3.8.2. Analysis by Country
12. PATENT ANALYSIS
- 12.1. Chapter Overview
- 12.2. Scope and Methodology
- 12.3. Cell free System: Patent Analysis
- 12.3.1. Analysis by Patent Publication Year
- 12.3.2. Analysis by Patent Application Year
- 12.3.3. Analysis by Annual Number of Granted Patents and Patent Applications
- 12.3.4. Analysis by Patent Jurisdiction
- 12.3.5. Analysis by CPC Symbols
- 12.3.6. Analysis by Type of Applicant
- 12.3.7. Leading Industry Players: Analysis by Number of Patents
- 12.3.8. Leading Non-Industry Players: Analysis by Number of Patents
- 12.3.9. Leading Individual Assignees: Analysis by Number of Patents
- 12.4. Cell free System: Patent Benchmarking Analysis
- 12.4.1. Analysis by Patent Characteristics
- 12.5. Cell free System: Patent Valuation
- 12.6. Leading Patents: Analysis by Number of Citations
13. MARKET FORECAST AND OPPORTUNITY ANALYSIS
- 13.1. Chapter Overview
- 13.2. Key Assumptions and Forecast Methodology
- 13.3. Global Cell Free Expression Market, Till 2035
- 13.3.1. Cell Free Expression Market: Distribution by Type of Cell Free System
- 13.3.1.1. Cell Free Expression Market for Crude Cell Lysate-based Systems, Till 2035
- 13.3.1.2. Cell Free Expression Market for Reconstituted Systems, Till 2035
- 13.3.2. Cell Free Expression Market: Distribution by Type of Host Organism
- 13.3.2.1. Cell Free Expression Market for Microbial Cell Free Expression Systems, Till 2035
- 13.3.2.2. Cell Free Expression Market for Mammalian Cell Free Expression Systems, Till 2035
- 13.3.2.3. Cell Free Expression Market for Plant-based Cell Free Expression Systems, Till 2035
- 13.3.2.4. Cell Free Expression Market for Other Cell Free Expression Systems, Till 2035
- 13.3.3. Cell Free Expression Market: Distribution by Type of Expression Method
- 13.3.3.1. Cell Free Expression Market for Coupled Transcription and Translation Method, Till 2035
- 13.3.3.2. Cell Free Expression Market for Translation Method, Till 2035
- 13.3.4. Cell Free Expression Market: Distribution by End-User
- 13.3.4.1. Cell Free Expression Market for Pharmaceutical and Biotechnology Companies, Till 2035
- 13.3.4.2. Cell Free Expression Market for Academic and Research Institutes, Till 2035
- 13.3.4.3. Cell Free Expression Market for Other End-Users, Till 2035
- 13.3.5. Cell Free Expression Market: Distribution by Key Geographical Regions
- 13.3.5.1. Cell Free Expression Market in North America, Till 2035
- 13.3.5.2. Cell Free Expression Market in Europe, Till 2035
- 13.3.5.3. Cell Free Expression Market in Asia-Pacific, Till 2035
- 13.3.5.4. Cell Free Expression Market in Rest of the World, Till 2035
- 13.3.1. Cell Free Expression Market: Distribution by Type of Cell Free System
14. EXECUTIVE INSIGHTS
- 14.1. Chapter Overview
- 14.2. Company A
- 14.2.1. Company Snapshot
- 14.2.2. Interview Transcript
- 14.3. Company B
- 14.3.1. Company Snapshot
- 14.3.2. Interview Transcript
15. CONCLUDING REMARKS
16. APPENDIX 1: TABULATED DATA
17. APPENDIX 2: LIST OF COMPANIES AND ORGANIZATIONS
List of Tables
- Table 4.1 Cell free Expression Service Providers: Information on Year of Establishment, Company Size, Location of Headquarters, Type of Host Organism, Type of Cell free Expression Service(s) Offered, and Type of Associated Service(s) Offered
- Table 4.2 Cell free Expression Service Providers: Information on Type of Product(s) Synthesized, Scale of Operation and Type of Industry Served
- Table 5.1 Cell free Expression Kits: Information on Type of Cell free System, Type of Host Organism, Type of Expression Method, and Type of Product(s) Synthesized
- Table 5.2 Cell free Expression Kits: Information on Type of Template(s) Used, Type of Compatible Promoter(s), Type of Reaction Format, Yield of Positive Control, Reaction Volume, Reaction Temperature, Incubation Time, Number of Reactions per Kit and Kit Price
- Table 5.3 Cell free Expression Kit Providers: Information on Year of Establishment, Location of Headquarters, Company Size and Type of Organization
- Table 8.1 Leading Cell free Expression Service Providers
- Table 8.2 BioLinker: Company Overview
- Table 8.3 BioLinker: Cell free Expression Service Portfolio
- Table 8.4 CUSABIO: Company Overview
- Table 8.5 CUSABIO: Cell free Expression Service Portfolio
- Table 8.6 LenioBio: Company Overview
- Table 8.7 LenioBio: Cell free Expression Service Portfolio
- Table 8.8 LenioBio: Recent Developments and Future Outlook
- Table 8.9 Touchlight: Company Overview
- Table 8.10 Touchlight: Cell free Expression Service Portfolio
- Table 8.11 Touchlight: Recent Developments and Future Outlook
- Table 9.1 Leading Cell free Expression Kit Providers
- Table 9.2 biotechrabbit: Company Overview
- Table 9.3 biotechrabbit: Cell free Expression Kit Portfolio
- Table 9.4 CellFree Sciences: Company Overview
- Table 9.5 CellFree Sciences: Cell free Expression Kit Portfolio
- Table 9.6 Creative Biolabs: Company Overview
- Table 9.7 Creative Biolabs: Cell free Expression Kit Portfolio
- Table 9.8 Daicel Arbor Biosciences: Company Overview
- Table 9.9 Daicel Arbor Biosciences: Cell free Expression Kit Portfolio
- Table 9.10 Promega: Company Overview
- Table 9.11 Promega: Cell free Expression Kit Portfolio
- Table 9.12 Thermo Fisher Scientific: Company Overview
- Table 9.13 Thermo Fisher Scientific: Cell free Expression Kit Portfolio
- Table 9.14 Thermo Fisher Scientific: Recent Developments and Future Outlook
- Table 10.1 Cell free System: List of Partnerships and Collaborations, 2018-2023
- Table 11.1 Cell free System: List of Funding and Investments, 2018-2023
- Table 12.1 Patent Analysis: Top CPC Symbols
- Table 12.2 Patent Analysis: Top CPC Codes
- Table 12.3 Patent Analysis: Summary of Benchmarking Analysis
- Table 12.4 Patent Analysis: Categorization based on Weighted Valuation Scores
- Table 12.5 Patent Portfolio: List of Leading Patents (by Highest Relative Valuation)
- Table 12.6 Patent Portfolio: List of Leading Patents (by Number of Citations)
- Table 14.1 Gene Frontier: Company Snapshot
- Table 14.2 LenioBio: Company Snapshot
- Table 14.3 Synthelis: Company Snapshot
- Table 16.1 Cell free Expression Service Providers: Distribution by Year of Establishment
- Table 16.2 Cell free Expression Service Providers: Distribution by Company Size
- Table 16.3 Cell free Expression Service Providers: Distribution by Location of Headquarters
- Table 16.4 Cell free Expression Service Providers: Distribution by Type of Cell free Expression Service(s) Offered
- Table 16.5 Cell free Expression Service Providers: Distribution by Type of Associated Service(s) Offered
- Table 16.6 Cell free Expression Service Providers: Distribution by Type of Host Organism
- Table 16.7 Cell free Expression Service Providers: Distribution by Type of Product(s) Synthesized
- Table 16.8 Cell free Expression Service Providers: Distribution by Scale of Operation
- Table 16.9 Cell free Expression Service Providers: Distribution by Type of Industry Served
- Table 16.10 Cell free Expression Kits: Distribution by Type of Cell free System
- Table 16.11 Cell free Expression Kits: Distribution by Type of Host Organism
- Table 16.12 Cell free Expression Kits: Distribution by Type of Expression Method
- Table 16.13 Cell free Expression Kits: Distribution by Type of Product(s) Synthesized
- Table 16.14 Cell free Expression Kits: Distribution by Type of Template(s) Used
- Table 16.15 Cell free Expression Kits: Distribution by Type of Compatible Promoter(s)
- Table 16.16 Cell free Expression Kits: Distribution by Type of Reaction Format
- Table 16.17 Cell free Expression Kits: Distribution by Yield of Positive Control
- Table 16.18 Cell free Expression Kits: Distribution by Reaction Volume
- Table 16.19 Cell free Expression Kits: Distribution by Reaction Temperature
- Table 16.20 Cell free Expression Kits: Distribution by Incubation Time
- Table 16.21 Cell free Expression Kits: Distribution by Number of Reactions per Kit
- Table 16.22 Cell free Expression Kits: Distribution by Kit Price
- Table 16.23 Cell free Expression Kit Providers: Distribution by Year of Establishment
- Table 16.24 Cell free Expression Kit Providers: Distribution by Company Size
- Table 16.25 Cell free Expression Kit Providers: Distribution by Location of Headquarters
- Table 16.26 Most Active Players: Distribution by Number of Cell free Expression Kits Developed
- Table 16.27 Partnerships and Collaborations: Cumulative Year-wise Trend
- Table 16.28 Partnerships and Collaborations: Distribution by Type of Partnership
- Table 16.29 Partnerships and Collaborations: Distribution by Year and Type of Partnership
- Table 16.30 Partnerships and Collaborations: Distribution by Focus Area
- Table 16.31 Partnerships and Collaborations: Distribution by Type of Partner
- Table 16.32 Most Active Players: Distribution by Number of Partnerships
- Table 16.33 Partnerships and Collaborations: Intercontinental and Intracontinental Agreements
- Table 16.34 Partnerships and Collaborations: Local and International Agreements
- Table 16.35 Funding and Investment Analysis: Cumulative Distribution of Number of Instances by Year, 2018-2023
- Table 16.36 Funding and Investment Analysis: Cumulative Distribution of Amount Invested by Year, 2018-2023 (USD Million)
- Table 16.37 Funding and Investment Analysis: Distribution of Instances by Type of Funding
- Table 16.38 Funding and Investment Analysis: Distribution of Amount Invested by Type of Funding (USD Million)
- Table 16.39 Funding and Investment Analysis: Distribution of Instances by Type of Investor
- Table 16.40 Most Active Players: Distribution by Number of Instances
- Table 16.41 Most Active Players: Distribution by Amount Invested (USD Million)
- Table 16.42 Funding and Investment Analysis: Distribution of Amount Invested by Region (USD Million)
- Table 16.43 Funding and Investment Analysis: Distribution of Amount Invested by Country (USD Million)
- Table 16.44 Patent Analysis: Distribution by Type of Patent
- Table 16.45 Patent Analysis: Distribution by Patent Publication Year
- Table 16.46 Patent Analysis: Distribution by Patent Application Year
- Table 16.47 Patent Analysis: Distribution of Granted Patents and Patent Applications by Publication Year
- Table 16.48 Patent Analysis: Distribution by Patent Jurisdiction (Region-wise)
- Table 16.49 Patent Analysis: Distribution by Patent Jurisdiction (Country-wise)
- Table 16.50 Patent Analysis: Distribution by CPC Symbols
- Table 16.51 Patent Analysis: Cumulative Year-wise Distribution by Type of Applicant
- Table 16.52 Leading Industry Players: Distribution by Number of Patents
- Table 16.53 Leading Non-Industry Players: Distribution by Number of Patents
- Table 16.54 Leading Individual Assignees: Distribution by Number of Patents
- Table 16.55 Patent Benchmarking Analysis: Distribution of Leading Industry Players by Patent Characteristics (CPC Codes)
- Table 16.56 Patent Analysis: Distribution by Patent Age
- Table 16.57 Cell free System: Patent Valuation
- Table 16.58 Global Cell free Expression Market: Conservative, Base and Optimistic Scenarios, Till 2035 (USD Million)
- Table 16.59 Cell free Expression Market: Distribution by Type of Cell free System
- Table 16.60 Cell free Expression Market for Crude Cell Lysate-based Systems: Conservative, Base and Optimistic Scenarios, Till 2035 (USD Million)
- Table 16.61 Cell free Expression Market for Reconstituted Systems: Conservative, Base and Optimistic Scenarios, Till 2035 (USD Million)
- Table 16.62 Cell free Expression Market: Distribution by Type of Host Organism
- Table 16.63 Cell free Expression Market for Microbial Cell free Expression Systems: Conservative, Base and Optimistic Scenarios, Till 2035 (USD Million)
- Table 16.64 Cell free Expression Market for Mammalian Cell free Expression Systems: Conservative, Base and Optimistic Scenarios, Till 2035 (USD Million)
- Table 16.65 Cell free Expression Market for Plant-based Cell free Expression Systems: Conservative, Base and Optimistic Scenarios, Till 2035 (USD Million)
- Table 16.66 Cell free Expression Market for Other Cell free Expression Systems: Conservative, Base and Optimistic Scenarios, Till 2035 (USD Million)
- Table 16.67 Cell free Expression Market: Distribution by Type of Expression Method
- Table 16.68 Cell free Expression Market for Coupled Transcription and Translation Method: Conservative, Base and Optimistic Scenarios, Till 2035 (USD Million)
- Table 16.69 Cell free Expression Market for Translation Method: Conservative, Base and Optimistic Scenarios, Till 2035 (USD Million)
- Table 16.70 Cell free Expression Market: Distribution by End-User
- Table 16.71 Cell free Expression Market for Pharmaceutical and Biotechnology Companies: Conservative, Base and Optimistic Scenarios, Till 2035 (USD Million)
- Table 16.72 Cell free Expression Market for Academic and Research Institutes: Conservative, Base and Optimistic Scenarios, Till 2035 (USD Million)
- Table 16.73 Cell free Expression Market for Other End-Users: Conservative, Base and Optimistic Scenarios, Till 2035 (USD Million)
- Table 16.74 Cell free Expression Market: Distribution by Key Geographical Regions
- Table 16.75 Cell free Expression Market in North America: Conservative, Base and Optimistic Scenarios, Till 2035 (USD Million)
- Table 16.76 Cell free Expression Market in Europe: Conservative, Base and Optimistic Scenarios, Till 2035 (USD Million)
- Table 16.77 Cell free Expression Market in Asia-Pacific: Conservative, Base and Optimistic Scenarios, Till 2035 (USD Million)
- Table 16.78 Cell free Expression Market in Rest of the World: Conservative, Base and Optimistic Scenarios, Till 2035 (USD Million)
List of Figures
- Figure 2.1 Executive Summary: Overall Market Landscape of Cell free Expression Service Providers
- Figure 2.2 Executive Summary: Overall Market Landscape of Cell free Expression Kits
- Figure 2.3 Executive Summary: Partnerships and Collaborations
- Figure 2.4 Executive Summary: Funding and Investment Analysis
- Figure 2.5 Executive Summary: Patent Analysis
- Figure 2.6 Executive Summary: Market Forecast and Opportunity Analysis
- Figure 3.1 Components of Cell free Reaction
- Figure 3.2 Applications of Cell free Biomanufacturing
- Figure 4.1 Cell free Expression Service Providers: Distribution by Year of Establishment
- Figure 4.2 Cell free Expression Service Providers: Distribution by Company Size
- Figure 4.3 Cell free Expression Service Providers: Distribution by Location of Headquarters
- Figure 4.4 Cell free Expression Service Providers: Distribution by Type of Cell free Biomanufacturing Service(s) Offered
- Figure 4.5 Cell free Expression Service Providers: Distribution by Type of Associated Service(s) Offered
- Figure 4.6 Cell free Expression Service Providers: Distribution by Type of Host Organism
- Figure 4.7 Cell free Expression Service Providers: Distribution by Type of Product(s) Synthesized
- Figure 4.8 Cell free Expression Service Providers: Distribution by Scale of Operation
- Figure 4.9 Cell free Expression Service Providers: Distribution by Type of Industry Served
- Figure 5.1 Cell free Expression Kits: Distribution by Type of Cell free System
- Figure 5.2 Cell free Expression Kits: Distribution by Type of Host Organism
- Figure 5.3 Cell free Expression Kits: Distribution by Type of Expression Method
- Figure 5.4 Cell free Expression Kits: Distribution by Type of Product(s) Synthesized
- Figure 5.5 Cell free Expression Kits: Distribution by Type of Template(s) Used
- Figure 5.6 Cell free Expression Kits: Distribution by Type of Compatible Promoter(s)
- Figure 5.7 Cell free Expression Kits: Distribution by Type of Reaction Format
- Figure 5.8 Cell free Expression Kits: Distribution by Yield of Positive Control
- Figure 5.9 Cell free Expression Kits: Distribution by Reaction Volume
- Figure 5.10 Cell free Expression Kits: Distribution by Reaction Temperature
- Figure 5.11 Cell free Expression Kits: Distribution by Incubation Time
- Figure 5.12 Cell free Expression Kits: Distribution by Number of Reactions per Kit
- Figure 5.13 Cell free Expression Kits: Distribution by Kit Price
- Figure 5.14 Cell free Expression Kit Providers: Distribution by Year of Establishment
- Figure 5.15 Cell free Expression Kit Providers: Distribution by Company Size
- Figure 5.16 Cell free Expression Kit Providers: Distribution by Location of Headquarters
- Figure 5.17 Most Active Players: Distribution by Number of Cell free Expression Kits Developed
- Figure 6.1 Company Competitiveness Analysis: Small Service Providers
- Figure 6.2 Company Competitiveness Analysis: Leading Small Service Providers
- Figure 6.3 Company Competitiveness Analysis: Mid-sized Service Providers
- Figure 6.4 Company Competitiveness Analysis: Large and Very Large Service Providers
- Figure 7.1 Product Competitiveness Analysis: Cell free Expression Kits Developed by Players based in North America
- Figure 7.2 Product Competitiveness Analysis: Popular Cell free Expression Kits Developed by Players based in North America
- Figure 7.3 Product Competitiveness Analysis: Cell free Expression Kits Developed by Players based in Europe
- Figure 7.4 Product Competitiveness Analysis: Popular Cell free Expression Kits Developed by Players based in Europe
- Figure 7.5 Product Competitiveness Analysis: Cell free Expression Kits Developed by Players based in Asia Pacific and Rest of the World
- Figure 7.6 Product Competitiveness Analysis: Popular Cell free Expression Kits Developed by Players based in Asia Pacific and Rest of the World
- Figure 10.1 Partnerships and Collaborations: Cumulative Year-wise Trend
- Figure 10.2 Partnerships and Collaborations: Distribution by Type of Partnership
- Figure 10.3 Partnerships and Collaborations: Distribution by Year and Type of Partnership
- Figure 10.4 Partnerships and Collaborations: Distribution by Focus Area
- Figure 10.5 Partnerships and Collaborations: Distribution by Type of Partner
- Figure 10.6 Most Active Players: Distribution by Number of Partnerships
- Figure 10.7 Partnerships and Collaborations: Intercontinental and Intracontinental Agreements
- Figure 10.8 Partnerships and Collaborations: Local and International Agreements
- Figure 11.1 Funding and Investment Analysis: Cumulative Distribution of Number of Instances by Year, 2018-2023
- Figure 11.2 Funding and Investment Analysis: Cumulative Distribution of Amount Invested by Year, 2018-2023 (USD Million)
- Figure 11.3 Funding and Investment Analysis: Distribution of Instances by Type of Funding
- Figure 11.4 Funding and Investment Analysis: Distribution of Amount Invested by Type of Funding (USD Million)
- Figure 11.5 Funding and Investment Analysis: Distribution of Instances by Type of Investor
- Figure 11.6 Most Active Players: Distribution by Number of Instances
- Figure 11.7 Most Active Players: Distribution by Amount Invested (USD Million)
- Figure 11.8 Funding and Investment Analysis: Distribution of Amount Invested by Region (USD Million)
- Figure 11.9 Funding and Investment Analysis: Distribution of Amount Invested by Country (USD Million)
- Figure 12.1 Patent Analysis: Distribution by Type of Patent
- Figure 12.2 Patent Analysis: Distribution by Patent Publication Year
- Figure 12.3 Patent Analysis: Distribution by Patent Application Year
- Figure 12.4 Patent Analysis: Distribution of Granted Patents and Patent Applications by Publication Year
- Figure 12.5 Patent Analysis: Distribution by Patent Jurisdiction (Region-wise)
- Figure 12.6 Patent Analysis: Distribution by Patent Jurisdiction (Country-wise)
- Figure 12.7 Patent Analysis: Distribution by CPC Symbols
- Figure 12.8 Patent Analysis: Cumulative Year-wise Distribution by Type of Applicant
- Figure 12.9 Leading Industry Players: Distribution by Number of Patents
- Figure 12.1 Leading Non-Industry Players: Distribution by Number of Patents
- Figure 12.11 Leading Individual Assignees: Distribution by Number of Patents
- Figure 12.12 Patent Benchmarking Analysis: Distribution of Leading Industry Players by Patent Characteristics (CPC Codes)
- Figure 12.13 Patent Analysis: Distribution by Patent Age
- Figure 12.14 Cell free System: Patent Valuation
- Figure 13.1 Global Cell free Expression Market, Till 2035 (USD Million)
- Figure 13.2 Cell free Expression Market: Distribution by Type of Cell free System
- Figure 13.3 Cell free Expression Market for Crude Cell Lysate-based Systems, Till 2035 (USD Million)
- Figure 13.4 Cell free Expression Market for Reconstituted Systems, Till 2035 (USD Million)
- Figure 13.5 Cell free Expression Market: Distribution by Type of Host Organism
- Figure 13.6 Cell free Expression Market for Microbial Cell free Expression Systems, Till 2035 (USD Million)
- Figure 13.7 Cell free Expression Market for Mammalian Cell free Expression Systems, Till 2035 (USD Million)
- Figure 13.8 Cell free Expression Market for Plant-based Cell free Expression Systems, Till 2035 (USD Million)
- Figure 13.9 Cell free Expression Market for Other Cell free Expression Systems, Till 2035 (USD Million)
- Figure 13.10 Cell free Expression Market: Distribution by Type of Expression Method
- Figure 13.11 Cell free Expression Market for Coupled Transcription and Translation Method, Till 2035 (USD Million)
- Figure 13.12 Cell free Expression Market for Translation Method, Till 2035 (USD Million)
- Figure 13.13 Cell free Expression Market: Distribution by End-User
- Figure 13.14 Cell free Expression Market for Pharmaceutical and Biotechnology Companies, Till 2035 (USD Million)
- Figure 13.15 Cell free Expression Market for Academic and Research Institutes, Till 2035 (USD Million)
- Figure 13.16 Cell free Expression Market for Other End-Users, Till 2035 (USD Million)
- Figure 13.17 Cell free Expression Market: Distribution by Key Geographical Regions
- Figure 13.18 Cell free Expression Market in North America, Till 2035 (USD Million)
- Figure 13.19 Cell free Expression Market in Europe, Till 2035 (USD Million)
- Figure 13.20 Cell free Expression Market in Asia-Pacific, Till 2035 (USD Million)
- Figure 13.21 Cell free Expression Market in Rest of the World, Till 2035 (USD Million)
- Figure 15.1 Concluding Remarks: Cell free Expression Service Providers Market Landscape
- Figure 15.2 Concluding Remarks: Cell free Expression Kits Market Landscape
- Figure 15.3 Concluding Remarks: Partnerships and Collaborations
- Figure 15.4 Concluding Remarks: Funding and Investment Analysis
- Figure 15.5 Concluding Remarks: Patent Analysis
- Figure 15.6 Concluding Remarks: Market Forecast and Opportunity Analysis
 细胞非依赖性蛋白质合成系统市场:按技术、来源类型、产品形式、应用和最终用户划分-全球预测,2026-2032年
 无细胞蛋白质表现技术市场报告:2031 年趋势、预测与竞争分析
 全球无细胞蛋白表达市场成长、规模和趋势分析(按产品、应用、方法和最终用户)—区域展望、竞争策略和细分预测(至 2034 年)
 无细胞蛋白质表现市场按产品类型、应用、最终用户和地区划分
 无细胞蛋白表达市场 - 全球产业规模、份额、趋势、机会和预测,按产品、应用、方法、最终用户、地区和竞争细分,2019-2029F无细胞蛋白表达市场,按产品、按应用、按方法、按最终用户、按国家和地区 - 2024-2032 年行业分析、市场规模、市场份额和预测