


 |
市场调查报告书
商品编码
1891241
下一代抗体疗法市场(第二版)-产业趋势及全球预测(至2035年)-依药物、新型抗体、标靶疾病、疗法、给药途径、主要地区和主要公司划分Next Generation Antibody Therapeutics Market (2nd Edition): Industry Trends and Global Forecasts, Till 2035 - Distribution by Drug, Novel Antibody, Target Indication, Therapy, Route of Administration, Key Geographical Regions and Leading Players |
||||||
下一代抗体疗法市场
预计到2035年,下一代抗体疗法的市场规模将从目前的8.43亿美元增长至21.61亿美元,预测期内(至2035年)的复合年增长率(CAGR)为9.87%。
市场规模与机会分析依下列参数分类:
药学
- Adcetris
- Kadsira
- Elzonris
- Besponsa
- Lynphia
- Fibromun
- Nidregy
- Iomab-B
- TLX 591
新型抗体
- 放射免疫偶联物
- 免疫细胞因子
- 免疫毒素
标靶适应症
- 未经治疗的系统性间变性大细胞淋巴瘤 (SALCL) 或其他表达 CD30 的周边 T 细胞淋巴瘤 (PTCL)
- 经典型何杰金氏淋巴瘤
- 原发性皮肤间变性大细胞淋巴瘤 (pcALCL) 或
- 表达 CD30 的蕈样肉芽肿 (MF)
- 瀰漫性大 B 细胞淋巴瘤
- 復发或难治性 B 细胞前驱急性淋巴性白血病
- HER2 阳性乳癌
- 浆细胞样树突状细胞肿瘤
- 局部晚期黑色素瘤/III期B/C期黑色素瘤
- 復发或难治性皮肤T细胞淋巴瘤
- 復发或难治性急性骨髓性白血病
- 白血病
- 转移性去势抵抗性摄护腺癌
- 软组织肉瘤
治疗类型
- 合併治疗
- 单药治疗
给药途径
- 肿瘤内给药
- 静脉注射
地理区域
- 北美
- 欧洲
- 亚太地区
- 中东和非洲
下一代抗体疗法市场:成长与趋势
抗体(免疫球蛋白)是免疫系统产生的蛋白质能够识别并结合细胞和组织上的特定抗原标记,作为抵抗各种疾病的第一道防线。利用抗体-抗原交互作用的精准性,创新抗体疗法展现出改善患者预后的巨大潜力。近年来,许多创新抗体疗法已获得美国食品药物管理局 (FDA) 的批准,标誌着在治疗包括代谢紊乱、心血管疾病、癌症和罕见疾病在内的多种疾病方面取得了显着进展。这些批准证明了生物技术方法在应对重大医学挑战方面的有效性,并凸显了抗体疗法在现代医学中的作用。扩大资金投入和投资,以及加强合作研究,对于研发针对各种疾病的新型抗体至关重要。此外,许多先进技术正在改变新型疗法的发现和开发,并从根本上改变治疗方法。
下一代抗体疗法市场:主要发现
本报告深入分析了全球下一代抗体疗法市场的现状,并指出了该行业的潜在成长机会。报告的主要发现包括:
- 目前已有超过70种放射免疫偶联物核准或处于不同研发阶段,用于治疗各种疾病。其中,超过80%处于早期研发阶段。
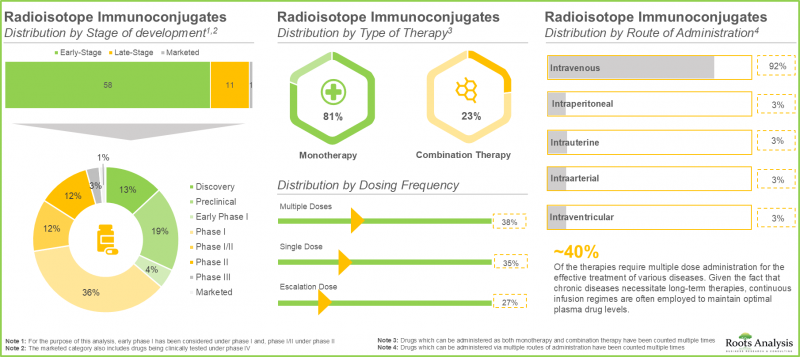
- 约70%的单药疗法可透过静脉注射给药,其中绝大多数(96%)疗法正处于临床研发阶段。
- 目前,已有超过35种免疫细胞激素核准或正在研发中,用于治疗各种疾病。其中,约60%处于早期研发阶段。
- 目前,超过45%处于早期研发阶段的免疫细胞激素与IL-2和IL-15型细胞激素合併使用。其中,绝大多数(80%)可以作为联合疗法给药。
- 目前,近60种免疫毒素已获准或处于不同研发阶段,用于治疗各种疾病。其中,超过45%的疗法处于早期研发阶段。
- 目前,约80%处于后期试验(II期和II/III期)的免疫毒素采用注射给药。此外,56%的免疫毒素与微生物毒素偶联。
- 大多数临床试验于2024年启动。尤其值得注意的是,目前有相当一部分试验(占所有试验的72%)正在招募患者,以研究下一代抗体疗法。
- 不断增长的科学文献凸显了利害关係人在下一代抗体疗法研发中的积极参与,约35%的论文发表于去年。
- 大多数专利持有者并非产业参与者。然而,在过去几年中,产业参与者对专利申请活动的贡献日益增加。
- 该领域约20%的合约为供应协议,其中44%的供应协议于2022年签署,旨在满足日益增长的新型抗体需求。
- 我们利用自主研发的预测模型,结合历史趋势、数据和广泛研究的信息,估算了全球下一代抗体疗法市场的当前规模。
- 目前,全球下一代抗体疗法市场由针对HER2阳性乳癌的药物主导,其次是经典型何杰金氏淋巴瘤。
下一代抗体疗法市场:主要细分市场
Adcetris 占下一代抗体疗法市场最大占有率
由于核准速度加快以及在血液肿瘤治疗中已证实的疗效,Adcetris 目前占约 45% 的高市场占有率。预计 LYMPHIR 在预测期内将以 18% 的复合年增长率快速成长。
免疫毒素细分市场将占下一代抗体疗法市场的大部分占有率。
根据下一代抗体疗法市场预测,由于其卓越的靶向细胞毒性和对抗药性癌细胞的疗效,免疫毒素细分市场今年将占较大的市场占有率。此外,预计免疫细胞因子领域在整个预测期内将展现出超过 40% 的最大成长潜力。
HER2 阳性乳癌将占下一代抗体治疗市场的最大占有率。
今年,HER2 阳性乳癌将在下一代抗体治疗市场中占约 45% 的显着市场。这主要归功于 HER2 阳性乳癌发病率的上升以及标靶治疗的广泛应用,这些因素显着改善了患者的预后和存活率。復发或难治性皮肤 T 细胞淋巴瘤领域在整个预测期内预计将展现出约 20% 的最大成长潜力。
单药疗法将主导下一代抗体治疗产业。
由于单药疗法能够实现高度特异性的标靶治疗且副作用极小,因此今年它将占大部分市场占有率。预计在预测期内,联合疗法细分市场将展现出最高的成长潜力,约 45%。
静脉给药途径主导下一代抗体疗法市场占有率
目前,静脉给药途径凭藉其快速起效和更高的生物利用度(这对于有效递送大分子抗体至关重要)而主导市场。肿瘤内给药途径预计将以更高的复合年增长率成长,这主要得益于其能够实现更高的局部药物浓度、降低全身毒性并增强治疗效果。
预计北美将在未来几年引领下一代抗体疗法市场
根据我们的下一代抗体疗法市场报告,预计北美今年将占大部分市场占有率 (64%),并有望保持这一地位。这得益于该地区强大的医疗保健体系、用于开发新型抗体疗法的创新平台以及对个人化医疗的高度重视,使其在新型抗体疗法领域处于领先地位。
下一代抗体疗法市场代表性公司
- Actinium Pharmaceuticals
- 辉瑞
- Philogen
- 罗氏
- Telix Pharmaceuticals
- Y-mAbs Therapies
新型抗体疗法市场:研究范围
- 市场规模和机会分析:本报告对下一代抗体疗法市场进行了详细分析,重点关注以下关键市场细分:[A] 药物,[B] 新型抗体类型,[C] 靶向适应症,[D] 疗法类型,[E] 给药途径,以及 [F] 主要公司。
- 市场概况 1:对放射免疫偶联物 (RIC) 当前市场概况的详细评估,以及基于以下方面的分析:[A] 研发阶段,[B] 治疗类型,[C] 给药途径,[D] 给药频率,[E] 放射性同位素类型,[F] 给药方法,[G] 作用,[H] 领域开发商类型,[M] 主要活跃企业。
- 市场概况 2:免疫细胞因子目前市场概况的详细评估,以及基于以下相关参数的分析:[A] 研发阶段,[B] 细胞因子类型,[C] 治疗类型,[D] 给药频率,[E] 作用机制,[F] 给药途径,[G] 抗原类型/形式,[H] 给药途径,[I] 年份,[K] 年份,[H] 治疗领域总部所在地,[M] 开发商类型,[N] 主要参与者。
- 市场概况 3:除了对免疫毒素当前市场概况进行详细评估外,本报告还基于以下相关参数提供分析:[A] 研发阶段,[B] 毒素类型,[C] 给药频率,[D] 治疗类型,[E] 给药方法,[F] 靶点类型,[G] 作用机制,[H] 给药机制,[H] 途径,[I]L] 年份,[K总部所在地,[M] 开发商类型,以及 [N] 主要参与者。
- 公司简介:详细介绍北美、欧洲和亚太地区开发下一代抗体疗法的关键公司。每家公司的简介包括:[A] 公司概况,[B] 财务信息,[C] 药物组合详情,[D] 近期进展,以及 [E] 未来展望。
- 临床试验分析:各种下一代我们基于以下相关参数,对已完成和正在进行的抗体疗法临床试验进行详细分析:[A] 研究註册年份,[B] 研究状态,[C] 研究阶段,[D] 入组患者人数,[E] 研究设计和患者性别,[F] 申办方/合作方类型,[G] 主要行业,以及 [H] 地理分布。
- 文献分析:基于相关参数(例如,[A] 出版年份,[B] 出版类型,[C] 主要出版商,[D] 主要期刊),对与下一代抗体疗法研究相关的各类同行评审科学文章进行详细审查。
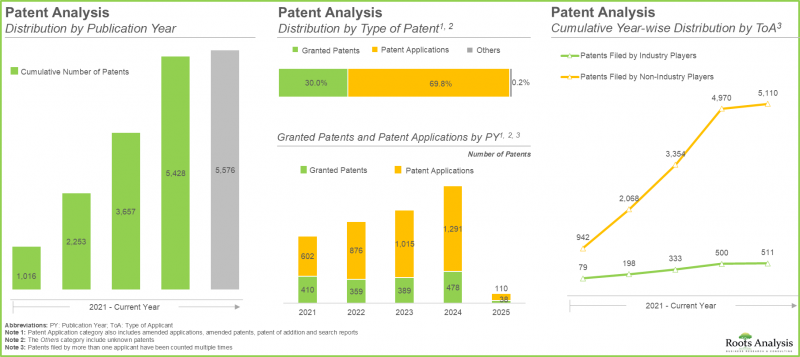
- 专利分析:基于以下参数,对已申请和已授权的下一代抗体疗法专利进行详细分析:[A] 公开年份,[B] 专利类型,[C] 申请人类型,[D] 申请年份,[E] 专利管辖区、专利年龄,[F] CPC 分类号,[G] 主要参与者。
- 合作伙伴关係与合作:基于[A]合作年份、[B]合作类型、[C]合作伙伴类型和[D]最活跃参与者等相关参数,对基因治疗、非病毒载体和病毒载体生产市场中已建立的合作伙伴关係与合作进行深入分析。
- 大型製药公司:基于[A]研发能力、[B]产品组合实力和[C]产品组合多样性等多个相关参数,对参与下一代抗体疗法领域的大型製药公司进行分析。
- 近期扩张趋势:基于[A]扩张年份、[B]扩张类型、[C]载体类型、[D]应用领域和[E]扩张地理位置等多个参数,对公司近期为增强其病毒载体和非病毒载体生产能力而进行的扩张进行分析。
- 市场影响分析:深入分析可能影响基因治疗、非病毒载体和病毒载体生产市场成长的因素。它还包括对以下方面的识别和分析:[A]关键驱动因素,[B]潜在限制因素,[C]新兴机遇,以及[D]现有挑战。
目录
第一章:背景
第二章:研究方法
第三章:市场动态
第四章:宏观经济指标
- 市场动态
第五章:摘要整理
第六章:引言
- 下一代抗体疗法概述
- 治疗性抗体:开发方法
- 未来展望
第七章:竞争格局:新型抗体疗法(放射性同位素免疫偶联物)
- 章节概述
- 市场概况:放射性同位素免疫偶联物
- 研发前景:放射性同位素免疫偶联物
第八章 竞争格局:新型抗体疗法(免疫细胞激素)
- 章节概述
- 市场概况:免疫细胞因子
- 研发前景:免疫细胞因子
第九章:竞争格局:新型抗体疗法(免疫毒素)
- 章节概述
- 市场概况:免疫毒素
- 研发前景:免疫毒素
第十章:新型抗体研发者
- 章节概述
- 锕製药公司
- 辉瑞
- Philogen
- 罗氏
- Telix Pharmaceuticals
- Y-mAbs Therapeutics
第11章 临床试验分析
- 分析方法与关键参数
- 依试验登记年分析
- 依试验状态分析
- 依试验登记年份及试验状态分析
- 依试验註册年份分析入组病患人数
- 依试验状态分析入组患者人数
- 依试验阶段分析
- 依研究设计分析
- 依目标患者族群分析
第12章:文献分析
- 分析方法与关键参数
- 下一代抗体治疗:文献分析
第十三章:专利分析
- 分析方法与关键参数
- 下一代抗体疗法:专利分析
第十四章:合作与伙伴关係
第十五章:主要药厂
- 分析研究方法与关键参数
- 下一代抗体疗法领域主要製药公司列表
- 关键参数评分标准
第十六章:市场影响分析:驱动因素、限制因素、机会与挑战
第十七章:全球下一代抗体疗法市场
第十八章:下一代抗体疗法市场(依药物分类)
第19章:下一代抗体疗法市场(以新型抗体类型分类)
第20章:下一代抗体疗法市场(依标靶疾病分类)
第21章:下一代抗体疗法市场(依疗法分类)
第22章:下一代抗体疗法市场(依给药途径分类)
第23章:下一代抗体疗法市场(依主要地区分类)
第24章:市场机会分析:北美
第25章:市场机会分析:欧洲
第26章:市场机会分析:亚太地区
第27章:市场机会分析:中东与北非
第28章:下一代抗体疗法市场(依主要公司划分)
第29章:表格资料
第30章:公司与组织清单
Next Generation Antibody Therapeutics Market
As per Roots Analysis, the next generation antibody therapeutics market is estimated to grow from USD 843 million in the current year to USD 2,161 million by 2035, at a CAGR of 9.87% during the forecast period, till 2035.
The market sizing and opportunity analysis has been segmented across the following parameters:
Drugs
- Adcetris
- Kadcyla
- ELZONRIS
- Besponsa
- LYMPHIR
- Fibromun
- Nidlegy
- Iomab-B
- TLX 591
Type of Novel Antibody
- Radioisotope Immunoconjugates
- Immunocytokines
- Immunotoxins
Target Indication
- Previously Untreated Systemic Anaplastic Large Cell Lymphoma (SALCL) or other CD30-expressing Peripheral T-cell Lymphomas (PTCL)
- Classical Hodgkin Lymphoma
- Primary Cutaneous Anaplastic Large Cell Lymphoma (pcALCL) or
- CD30-expressing Mycosis Fungoides (MF)
- Diffuse Large B-cell Lymphoma
- Relapsed or Refractory B-cell precursor Acute
- Lymphoblastic Leukemia
- HER2-positive breast cancer
- Blastic Plasmacytoid Dendritic Cell Neoplasm
- Locally Advanced, Melanoma / Stage III B / C Melanoma
- Relapsed or Refractory Cutaneous T-cell Lymphoma
- Relapsed / Refractory Acute Myeloid
- Leukemia
- Metastatic Castration-resistant Prostate Cancer
- Soft Tissue Sarcoma
Type of Therapy
- Combination Therapy
- Monotherapy
Route of Administration
- Intratumoral
- Intravenous
Geographical Regions
- North America
- Europe
- Asia-Pacific
- Middle East and Africa
Novel Antibody Therapies Market: Growth and Trends
Antibodies, or immunoglobulins, are proteins generated by the immune system that identify and attach to particular antigen markers on cells or tissues, acting as the primary defense against various ailments. Utilizing the accuracy of antibody-antigen interactions, innovative antibody treatments have shown considerable promise in enhancing patient results. In recent years, numerous innovative antibody treatments received approval from the USFDA, signifying notable progress in the treatment of a range of illnesses, such as metabolic disorders, cardiovascular issues, cancer, and rare diseases. These authorizations demonstrate the effectiveness of biotechnological methods in tackling significant healthcare issues and underscore the role of antibody therapies in contemporary medicine. Increased funding and investments, along with partnership initiatives, are vital for the research and development of new antibodies targeting various disorders. Moreover, numerous advanced technologies are transforming the identification and development of new therapies, fundamentally changing treatment approaches.
Novel Antibody Therapies Market: Key Insights
The report delves into the current state of the global novel antibody therapies market and identifies potential growth opportunities within industry. Some key findings from the report include:
- Over 70 radioisotope immunoconjugates are approved / being investigated across different stages of development for the treatment of various diseases; of these, >80% of the therapies are in early-stages of development.
- Close to 70% of the monotherapies can be administered intravenously; of these, majority (96%) of the therapies are under clinical stages of development.
- Over 35 immunocytokines are currently approved / being investigated across various stages of development for the treatment of various diseases; of these, nearly 60% of the therapies are in early-stages of development.
- Presently, over 45% of immunocytokines in early stages of development are in conjugation with IL-2 and IL-15 types of cytokine; of these, majority (80%) of the therapies can be administered as combination therapy.
- Nearly 60 immunotoxins are currently approved / being investigated across different stages of development for the treatment of various diseases; of these, more than 45% of the therapies are in early-stages of development.
- Presently, nearly 80% of the late-stage immunotoxins (phase II and phase II / III) are administered via injections; further, 56% immunotoxins are in conjugation with microbial toxins.
- Most of the trials were registered in 2024; notably, a significant proportion (72%) of the total trials are currently recruiting patients for the investigation of novel antibody therapies.
- The growing scientific literature highlights the active involvement of stakeholders in the research and development of novel antibody therapies; close to 35% of the articles were published in the previous year.
- Majority of the patent assignees are non-industry players; however, over the past few years, the contribution of industry players in the patent filing activity has also increased.
- Close to 20% deals inked in this domain are supply agreements; of these, 44% agreements were signed in 2022 in order to address the growing demand for novel antibodies.
- Using our proprietary forecast model, we estimated the current size of the global novel antibody therapies market, taking into consideration the historical trends, data and inputs obtained from exhaustive research.
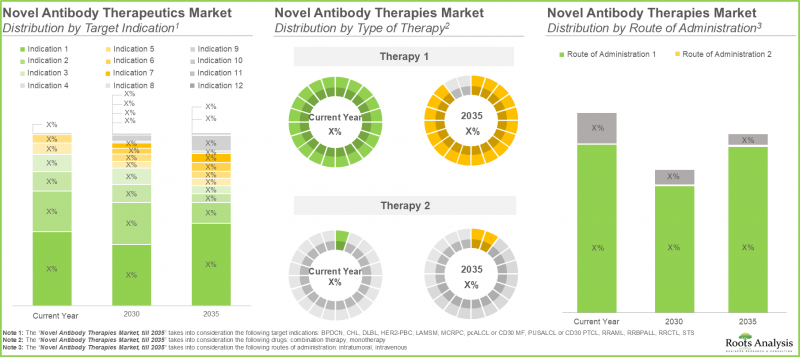
- Currently, the global novel antibody therapies market is dominated by drugs that are intended to target HER2-positive breast cancer, followed by classical Hodgkin lymphoma.
Novel Antibody Therapies Market: Key Segments
Adcetris Drug Captures the Largest Share in the Next Generation Antibody Therapeutics Market
Currently, Adcetris holds the higher market share of close to 45% due to its early approvals and proven effectiveness in hematologic cancers. LYMPHIR is expected to expand at an increased CAGR of 18% throughout the forecast period.
Immunotoxins Segment Holds the Majority of the Next Generation Antibody Therapeutics Market Share
The higher share of immunotoxins segment in the current year can be attributed to their superior targeted cytotoxicity and effectiveness against resistant cancer cells, as per next generation antibody therapeutics market forecast. Further, the immunocytokines sector is expected to exhibit the greatest growth potential, of over 40%, throughout the forecast period.
HER2-PBC Hold the Largest Share in the Next Generation Antibody Therapeutics Market
In the present year, HER2-PB captures a significant market share of nearly 45% in novel antibody therapies, driven by the growing incidence of HER2-positive breast cancer and the heightened use of targeted treatments that lead to substantial enhancements in patient outcomes and survival rates. The segment for relapsed or refractory cutaneous T-cell lymphoma is expected to exhibit the greatest growth potential of nearly 20% throughout the forecast period.
Monotherapy Dominates Next Generation Antibody Therapies Industry
Monotherapy segment holds most of the market share in the current year owing to its ability to provide highly specific targeting with fewer side effects. The combination therapy segment is likely to show the highest growth potential of close to 45%, during the forecast period.
Intravenous Route of Administration Dominates Next Generation Antibody Therapeutics Market Share
Currently, intravenous route of administration, the intravenous method dominates the market due to its capacity to provide a quick onset of action and improved bioavailability needed for effectively delivering large antibodies. The intratumoral method of delivery is expected to expand at a higher CAGR, fueled by its capacity to attain greater local drug levels, reduce systemic toxicity, and enhance treatment effectiveness
North America is Likely to Propel in the Next Generation Antibody Therapeutics Market in the Coming Years
According to our next generation antibody therapeutics market report, North America is likely to capture the majority (64%) of the market share in the current year, and this trend is unlikely to change in the future. This can be attributed to the strong healthcare system, innovative platforms for developing new antibody treatments, and a significant emphasis on personalized care, positioning this region at the forefront of novel antibody treatments.
Example Players in the Next Generation Antibody Therapeutics Market
- Actinium Pharmaceuticals
- Pfizer
- Philogen
- Roche
- Telix Pharmaceuticals
- Y-mAbs Therapies
Novel Antibody Therapies Market: Research Coverage
- Market Sizing and Opportunity Analysis: The report features an in-depth analysis of the novel antibody therapies market, focusing on key market segments, including [A] drug, [B] type of novel antibody, [C] target indication, [D] type of therapy, [E] route of administration and [F] leading players.
- Market Landscape 1: A detailed assessment of the current market landscape of radioisotope immunoconjugates, along with analyses based on several relevant parameters, including [A] stage of development, [B] type of therapy, [C] route of administration, [D] dosing frequency, [E] type of radioisotope, [F] mode of administration, [G] mechanism of action [H] therapeutic area, [I] year of establishment, [J] company size, [K] location of headquarters, [L] type of developer and [M] most active players.
- Market Landscape 2: A detailed assessment of the current market landscape of immunocytokines, along with analyses based on several relevant parameters, including [A] stage of development, [B] type of cytokine, [C] type of therapy, [D] dosing frequency, [E] mechanism of action, [F] mode of administration, [G] type of antigen / format, [H] route of administration [I] therapeutic area, [J] year of establishment, [K] company size, [L] location of headquarters, [M] type of developer and [N] most active players.
- Market Landscape 3: A detailed assessment of the current market landscape of immunotoxins, along with analyses based on several relevant parameters, including [A] stage of development, [B] type of toxin, [C] dosing frequency, [D] type of therapy, [E] mode of administration, [F] type of target, [G] mechanism of action, [H] route of administration, [I] therapeutic area, [J] year of establishment, [K] company size, [L] location of headquarters, [M] type of developer and [N] most active players.
- Company Profiles: In-depth profiles of prominent players based in regions, namely North America, Europe and Asia-Pacific that are currently involved in the engaged in the development of novel antibody therapies. Each profile features [A] a brief overview of the company, [B] its financial information, [C] details on its drug portfolio, [D] recent developments and an [E] informed future outlook.
- Clinical Trial Analysis: An in-depth analysis of completed and ongoing clinical trials investigating different novel antibody therapies, based on several relevant parameters, such as [A] trial registration year, [B] trial status, [C] trial phase, [D] patients enrolled, [E] study design, patient gender, [F] type of sponsor / collaborator, [G] most active industry and [H] geographical distribution.
- Publication Analysis: A detailed review of various peer-reviewed, scientific articles related to research on novel antibody therapies, based on relevant parameters, such as [A] year of publication, [B] type of publication, [C] popular publisher and [D] key journal.
- Patent Analysis: in-depth analysis of various patents that have been filed / granted for novel antibody therapies, taking into consideration parameters, such as [A] publication year, [B] type of patent, [C] type of applicant, [D] application year, [E] patent jurisdiction, patent age, [F] CPC symbols, [G] leading players.
- Partnerships and Collaborations An insightful analysis of the partnerships and collaborations established in gene therapy, non viral vector and viral vector manufacturing market based on various relevant parameters, including [A] year of partnership, [B] type of partnership, [C] type of partner and [D] most active players.
- Big Pharma Players: An analysis of big pharma players engaged in the field of novel antibody therapies, based on several relevant parameters, such as [A] developer strength, [B] portfolio strength, and [C] portfolio diversity.
- Recent Expansions: An analysis of the recent expansions undertaken by various companies in order to augment their respective capabilities related to viral vector and non viral vector manufacturing, based on several parameters, such as [A] year of expansion, [B] type of expansion, [C] type of vector, [D] application area and [E] geographical location of the expansion.
- Market Impact Analysis: An in-depth analysis of the factors that can impact the growth of gene therapy, non viral vector and viral vector manufacturing market. It also features identification and analysis of [A] key drivers, [B] potential restraints, [C] emerging opportunities, and [D] existing challenges.
Key Questions Answered in this Report
- How many companies are currently engaged in this market?
- Which are the leading companies in this market?
- What is the current global capacity of developers?
- What factors are likely to influence the evolution of this market?
- What is the current and future market size?
- What is the CAGR of this market?
- How is the current and future market opportunity likely to be distributed across key market segments?
Reasons to Buy this Report
- The report provides a comprehensive market analysis, offering detailed revenue projections of the overall market and its specific sub-segments. This information is valuable to both established market leaders and emerging entrants.
- Stakeholders can leverage the report to gain a deeper understanding of the competitive dynamics within the market. By analyzing the competitive landscape, businesses can make informed decisions to optimize their market positioning and develop effective go-to-market strategies.
- The report offers stakeholders a comprehensive overview of the market, including key drivers, barriers, opportunities, and challenges. This information empowers stakeholders to stay abreast of market trends and make data-driven decisions to capitalize on growth prospects.
Additional Benefits
- Complimentary PPT Insights Packs
- Complimentary Excel Data Packs for all Analytical Modules in the Report
- 15% Free Content Customization
- Detailed Report Walkthrough Session with Research Team
- Free Updated report if the report is 6-12 months old or older
TABLE OF CONTENTS
1. BACKGROUND
- 1.1. Context
- 1.2. Project Objectives
2. RESEARCH METHODOLOGY
- 2.1. Research Assumptions
- 2.1.1. Market Landscape and Market Trends
- 2.1.2. Market Forecast and Opportunity Analysis
- 2.1.3. Comparative Analysis
- 2.2. Database Building
- 2.2.1. Data Collection
- 2.2.2. Data Validation
- 2.2.3. Data Analysis
- 2.3. Project Methodology
- 2.3.1. Project Commencement
- 2.3.2. Secondary Research
- 2.3.2.1. Annual Reports
- 2.3.2.2. Academic Research Papers
- 2.3.2.3. Company Websites
- 2.3.2.4. Investor Presentations and Regulatory Filings
- 2.3.2.5. White Papers
- 2.3.2.6. Industry Publications
- 2.3.2.7. Conferences and Seminars
- 2.3.2.8. Government Portals
- 2.3.2.9. Media and Press Releases
- 2.3.2.10. Newsletters
- 2.3.2.11. Industry and Paid Databases
- 2.3.2.12. Roots Proprietary Databases
- 2.3.3. Primary Research
- 2.3.4. Data Analysis and Interpretation
- 2.3.5. Market Forecast and Validation
- 2.3.6. Report Compilation
- 2.4. Research Ethics and Integrity
- 2.5. Analytical Tools and Databases
- 2.6. Robust Quality Control Framework
3. MARKET DYNAMICS
- 3.1. Forecast Methodology
- 3.1.1. Top-Down Approach
- 3.1.2. Bottom-Up Approach
- 3.1.3. Hybrid Approach
- 3.2. Market Assessment Framework
- 3.2.1. Total Addressable Market (TAM)
- 3.2.2. Serviceable Addressable Market (SAM)
- 3.2.3. Serviceable Obtainable Market (SOM)
- 3.2.4. Currently Acquired Market (CAM)
- 3.3. Forecasting Tools and Techniques
- 3.3.1. Qualitative Forecasting
- 3.3.2. Correlation
- 3.3.3. Regression
- 3.3.4. Extrapolation
- 3.3.5. Convergence
- 3.3.6. Sensitivity Analysis
- 3.3.7. Scenario Planning
- 3.3.8. Data Visualization
- 3.3.9. Time Series Analysis
- 3.3.10. Forecast Error Analysis
- 3.4. Key Considerations
- 3.4.1. Demographics
- 3.4.2. Economic Factors
- 3.4.3. Competitive Landscape
- 3.4.4. Government Regulations and Policies
- 3.4.5. R&D Investment
- 3.4.6. Technological Factors
- 3.4.7. Industry Consolidation
- 3.4.8. Supply Chain
- 3.4.9. Market Access
- 3.4.10. Pandemics / Unforeseen Disruptions Impact
4. MACRO-ECONOMIC INDICATORS
- 4.1. Market Dynamics
- 4.1.1. Time Period
- 4.1.1.1. Historical Trends
- 4.1.1.2. Current and Forecasted Estimates
- 4.1.2. Currency Coverage
- 4.1.2.1. Overview of Major Currencies Affecting the Market
- 4.1.2.2. Impact of Currency Fluctuations on the Industry
- 4.1.3. Foreign Exchange Impact
- 4.1.3.1. Evaluation of Foreign Exchange Rates and Their Impact on Market
- 4.1.3.2. Strategies for Mitigating Foreign Exchange Risk
- 4.1.4. Recession
- 4.1.4.1. Historical Analysis of Past Recessions and Lessons Learnt
- 4.1.4.2. Assessment of Current Economic Conditions and Potential Impact on the Market
- 4.1.5. Inflation
- 4.1.5.1. Measurement and Analysis of Inflationary Pressures in the Economy
- 4.1.5.2. Potential Impact of Inflation on the Market Evolution
- 4.1.6. Other Indicators
- 4.1.6.1. War Impact Analysis
- 4.1.6.2. Cross-border Dynamics
- 4.1.6.3. Consumer Spendings and Gross Domestic Product
- 4.1.6.4. Stock Market Performance
- 4.1.1. Time Period
5. EXECUTIVE SUMMARY
6. INTRODUCTION
- 6.1. An Overview of Novel Antibody Therapies
- 6.2. Therapeutic Antibodies: Developmental Approaches
- 6.2.1. Novel Antibody Therapies: Antibody-Directed Enzyme Prodrug Therapy (ADEPT)
- 6.2.1.1. Mechanism of Action of Antibody-Directed Enzyme Prodrug Therapy (ADEPT)
- 6.2.1.2. Advantages of Antibody-Directed Enzyme Prodrug Therapy (ADEPT)
- 6.2.1.3. Disadvantages of Antibody-Directed Enzyme Prodrug Therapy (ADEPT)
- 6.2.2. Novel Antibody Therapies: TCR like Antibodies
- 6.2.2.1. Mechanism of Action of TCR like Antibodies
- 6.2.2.2. Advantages of TCR like Antibodies
- 6.2.2.3. Disadvantages of TCR like Antibodies
- 6.2.3. Novel Antibody Therapies: Radioisotope Immunoconjugates
- 6.2.3.1. Mechanism of Action of Radioisotope Immunoconjugates
- 6.2.3.2. Advantages of Radioisotope Immunoconjugates
- 6.2.3.3. Disadvantages of Radioisotope Immunoconjugates
- 6.2.4. Novel Antibody Therapies: Immunotoxins
- 6.2.4.1. Mechanism of Action of Immunotoxins
- 6.2.4.2. Advantages of Immunotoxins
- 6.2.4.3. Disadvantages of Immunotoxins
- 6.2.5. Novel Antibody Therapies: Intracellular Antibody
- 6.2.5.1. Mechanism of Action of Intracellular Antibody
- 6.2.5.2. Advantages of Intracellular Antibody
- 6.2.5.3. Disadvantages of Intracellular Antibody
- 6.2.6. Novel Antibody Therapies: Immunocytokines
- 6.2.6.1. Mechanism of Action of Immunocytokines
- 6.2.6.2. Advantages of Immunocytokines
- 6.2.6.3. Disadvantages of Immunocytokines
- 6.2.1. Novel Antibody Therapies: Antibody-Directed Enzyme Prodrug Therapy (ADEPT)
- 6.3. Future Perspectives
7. COMPETITIVE LANDSCAPE: NOVEL ANTIBODY THERAPEUTICS (RADIOISOTOPE IMMUNOCONJUGATES)
- 7.1. Chapter Overview
- 7.2. Market Landscape: Radioisotope Immunoconjugates
- 7.2.1. Analysis by Stage of Development
- 7.2.2. Analysis by Type of Therapy
- 7.2.3. Analysis by Route of Administration
- 7.2.4. Analysis by Dosing Frequency
- 7.2.5. Analysis by Type of Radioisotope
- 7.2.6. Analysis by Mode of Administration
- 7.2.7. Analysis by Mechanism of Action
- 7.2.8. Analysis by Therapeutic Area
- 7.3. Developer Landscape: Radioisotope Immunoconjugates
- 7.3.1. Analysis by Year of Establishment
- 7.3.2. Analysis by Company Size
- 7.3.3. Analysis by Location of Headquarters
- 7.3.4. Analysis by Type of Developer
- 7.3.5. Most Active Players: Analysis by Number of Therapies
8. COMPETITIVE LANDSCAPE: NOVEL ANTIBODY THERAPEUTICS (IMMUNOCYTOKINES)
- 8.1. Chapter Overview
- 8.2. Market Landscape: Immunocytokines
- 8.2.1. Analysis by Stage of Development
- 8.2.2. Analysis by Type of Cytokine
- 8.2.3. Analysis by Type of Therapy
- 8.2.4. Analysis by Dosing Frequency
- 8.2.5. Analysis by Mechanism of Action
- 8.2.6. Analysis by Mode of Administration
- 8.2.7. Analysis by Type of Antigen / Format
- 8.2.8. Analysis by Route of Administration
- 8.2.9. Analysis by Therapeutic Area
- 8.3. Developer Landscape: Immunocytokines
- 8.3.1. Analysis by Year of Establishment
- 8.3.2. Analysis by Company Size
- 8.3.3. Analysis by Location of Headquarters
- 8.3.4. Most Active Players: Analysis by Number of Therapies
9. COMPETITIVE LANDSCAPE: NOVEL ANTIBODY THERAPEUTICS (IMMUNOTOXINS)
- 9.1. Chapter Overview
- 9.2. Market Landscape: Immunotoxins
- 9.2.1. Analysis by Stage of Development
- 9.2.2. Analysis by Type of Toxin
- 9.2.3. Analysis by Dosing Frequency
- 9.2.4. Analysis by Type of Therapy
- 9.2.5. Analysis by Mode of Administration
- 9.2.6. Analysis by Type of Target
- 9.2.7. Analysis by Mechanism of Action
- 9.2.8. Analysis by Route of Administration
- 9.2.9. Analysis by Therapeutic Area
- 9.3. Developer Landscape: Immunotoxins
- 9.3.1. Analysis by Year of Establishment
- 9.3.2. Analysis by Company Size
- 9.3.3. Analysis by Location of Headquarters
- 9.3.4. Analysis by Type of Developer
- 9.3.5. Most Active Players: Analysis by Number of Therapies
10. NOVEL ANTIBODY DEVELOPERS
- 10.1. Chapter Overview
- 10.1.1. Actinium Pharmaceuticals
- 10.1.1.1. Company Overview
- 10.1.1.2. Management Team
- 10.1.1.3. Contact Details
- 10.1.1.4. Drug Portfolio
- 10.1.1.5. Recent Developments and Future Outlook
- 10.1.2. Pfizer
- 10.1.2.1. Company Overview
- 10.1.2.2. Management Team
- 10.1.2.3. Contact Details
- 10.1.2.4. Operating Business Segments
- 10.1.2.5. Financial Information
- 10.1.2.6. Drug Portfolio
- 10.1.2.7. Recent Developments and Future Outlook
- 10.1.3. Philogen
- 10.1.3.1. Company Overview
- 10.1.3.2. Management Team
- 10.1.3.3. Contact Details
- 10.1.3.4. Financial Information
- 10.1.3.5. Drug Portfolio
- 10.1.3.6. Recent Developments and Future Outlook
- 10.1.4. Roche
- 10.1.4.1. Company Overview
- 10.1.4.2. Management Team
- 10.1.4.3. Contact Details
- 10.1.4.4. Operating Business Segments
- 10.1.4.5. Financial Information
- 10.1.4.6. Drug Portfolio
- 10.1.4.7. Recent Developments and Future Outlook
- 10.1.5. Telix Pharmaceuticals
- 10.1.5.1. Company Overview
- 10.1.5.2. Management Team
- 10.1.5.3. Contact Details
- 10.1.5.4. Financial Information
- 10.1.5.5. Drug Portfolio
- 10.1.5.6. Recent Developments and Future Outlook
- 10.1.6. Y-mAbs Therapeutics
- 10.1.6.1. Company Overview
- 10.1.6.2. Management Team
- 10.1.6.3. Contact Details
- 10.1.6.4. Financial Information
- 10.1.6.5. Drug Portfolio
- 10.1.6.6. Recent Developments and Future Outlook
- 10.1.1. Actinium Pharmaceuticals
11. CLINICAL TRIAL ANALYSIS
- 11.1. Analysis Methodology and Key Parameters
- 11.2. Analysis by Trial Registration Year
- 11.3. Analysis by Trial Status
- 11.4. Analysis by Trial Registration Year and Trial Status
- 11.5. Analysis of Patients Enrolled by Trial Registration Year
- 11.6. Analysis of Patients Enrolled by Trial Status
- 11.7. Analysis by Trial Phase
- 11.8. Analysis by Study Design
- 11.9. Analysis by Target Patient Population
- 11.9.1. Analysis by Patient Gender
- 11.9.2. Analysis by Type of Sponsor / Collaborator
- 11.9.3. Most Active Industry Players: Analysis by Number of Trials
- 11.9.4. Analysis of Trials and Number of Patients Enrolled
12. PUBLICATION ANALYSIS
- 12.1. Analysis Methodology and Key Parameters
- 12.2. Novel Antibody Therapies: Publication Analysis
- 12.2.1. Analysis by Year of Publication
- 12.2.2. Analysis by Type of Publication
- 12.2.3. Analysis by Most Popular Publisher
- 12.2.4. Key Journals: Analysis by Number of Publications
- 12.2.5. Key Journals: Analysis by Impact Factor
13. PATENT ANALYSIS
- 13.1. Analysis Methodology and Key Parameters
- 13.2. Novel Antibody Therapies: Patent Analysis
- 13.2.1. Analysis by Publication Year
- 13.2.2. Analysis by Type of Patent
- 13.2.3. Analysis of Granted Patents and Patent Applications by Year
- 13.2.4. Analysis by Type of Applicant
- 13.2.5. Analysis by Application Year
- 13.2.6. Analysis by Patent Jurisdiction
- 13.2.7. Analysis by Patent Age
- 13.2.8. Leading Industry Players: Analysis by Number of Patents
- 13.2.9. Leading Non-Industry Players: Analysis by Number of Patents
- 13.2.10. Leading Individual Assignees: Analysis by Number of Patents
- 13.2.11. Patent Benchmarking: Analysis of Patent Characteristics (CPC Codes) by Leading Industry Players
- 13.2.12. Patent Benchmarking: Analysis of Leading Industry Players by Patent Characteristics (CPC Codes)
- 13.2.13. Patent Valuation: Analysis Methodology and Parameters
- 13.2.14. Patent Valuation: Analysis by Relative Valuation
14. PARTNERSHIPS AND COLLABORATIONS
- 14.1. Chapter Overview
- 14.2. Partnership Models
- 14.3. Novel Antibody Therapeutics: Partnerships and Collaborations
- 14.3.1. Analysis by Year of Partnership
- 14.3.2. Analysis by Type of Partnership
- 14.3.3. Analysis by Year and Type of Partnership
- 14.3.4. Most Popular Drug: Analysis by Number of Partnerships
- 14.3.5. Analysis by Types of Novel Antibody
- 14.3.6. Analysis by Type of Partner
- 14.3.7. Most Active Players: Analysis by Number of Partnerships
- 14.3.8. Analysis by Therapeutic Area
- 14.3.9. Analysis by Therapeutic Area and Type of Partnership
- 14.3.10. Analysis by Geography
- 14.3.10.1. Local and International Agreements
- 14.3.10.2. Intracontinental and Intercontinental Agreements
15. BIG PHARMA PLAYERS
- 15.1. Analysis Methodology and Key Parameters
- 15.2. List of Big Pharma Players in Novel Antibody Therapies Domain
- 15.3. Scoring Criteria for Key Parameters
- 15.3.1. Analysis by Developer Strength
- 15.3.2. Analysis by Portfolio Strength
- 15.3.3. Analysis by Portfolio Diversity
- 15.3.4. Benchmarking: Spider Web Analysis
- 15.3.5. Benchmarking: Harvey Ball Analysis
- 15.3.6. Benchmarking: Wind Rose Chart
16. MARKET IMPACT ANALYSIS: DRIVERS, RESTRAINTS, OPPORTUNITIES AND CHALLENGES
- 16.1. Chapter Overview
- 16.2. Market Drivers
- 16.3. Market Restraints
- 16.4. Market Opportunities
- 16.5. Market Challenges
17. GLOBAL NOVEL ANTIBODY THERAPIES MARKET
- 17.1. Chapter Overview
- 17.2. Key Assumptions and Methodology
- 17.3. Global Novel Antibody Therapies Market, Historical Trends (Since 2023) and Forecasted Estimates (Till 2035)
- 17.4. Multivariate Scenario Analysis
- 17.4.1. Conservative Scenario
- 17.4.2. Optimistic Scenario
- 17.5. Key Market Segmentations
18. NOVEL ANTIBODY THERAPIES MARKET, BY DRUGS
- 18.1. Chapter Overview
- 18.2. Key Assumptions and Methodology
- 18.3. Novel Antibody Therapies Market: Distribution by Drugs
- 18.3.1. Novel Antibody Therapies Market for Adcetris, Historical Trends (Since 2023) and Forecasted Estimates (Till 2035)
- 18.3.2. Novel Antibody Therapies Market for Kadcyla, Historical Trends (Since 2023) and Forecasted Estimates (Till 2035)
- 18.3.3. Novel Antibody Therapies Market for ELZONRIS, Historical Trends (Since 2023) and Forecasted Estimates (Till 2035)
- 18.3.4. Novel Antibody Therapies Market for Besponsa, Historical Trends (Since 2023) and Forecasted Estimates (Till 2035)
- 18.3.5. Novel Antibody Therapies Market for LYMPHIR, Historical Trends (Since 2023) and Forecasted Estimates (Till 2035)
- 18.3.6. Novel Antibody Therapies Market for Fibromun, Historical Trends (Since 2023) and Forecasted Estimates (Till 2035)
- 18.3.7. Novel Antibody Therapies Market for Nidlegy, Historical Trends (Since 2023) and Forecasted Estimates (Till 2035)
- 18.3.8. Novel Antibody Therapies Market for Iomab-B, Historical Trends (Since 2023) and Forecasted Estimates (Till 2035)
- 18.3.9. Novel Antibody Therapies Market for TLX 591, Historical Trends (Since 2023) and Forecasted Estimates (Till 2035)
- 18.4. Data Triangulation and Validation
19. NOVEL ANTIBODY THERAPIES MARKET, BY TYPE OF NOVEL ANTIBODY
- 19.1. Chapter Overview
- 19.2. Key Assumptions and Methodology
- 19.3. Novel Antibody Therapies Market: Distribution by Type of Novel Antibody
- 19.3.1. Novel Antibody Therapies Market for Immunotoxins, Historical Trends (Since 2023) and Forecasted Estimates (Till 2035)
- 19.3.2. Novel Antibody Therapies Market for Immunocytokines, Historical Trends (Since 2023) and Forecasted Estimates (Till 2035)
- 19.3.3. Novel Antibody Therapies Market for Radioisotope Immunoconjugates, Historical Trends (Since 2023) and Forecasted Estimates (Till 2035)
- 19.4. Data Triangulation and Validation
20. NOVEL ANTIBODY THERAPIES MARKET, BY TARGET INDICATION
- 20.1. Chapter Overview
- 20.2. Key Assumptions and Methodology
- 20.3. Novel Antibody Therapies Market: Distribution by Target Indication
- 20.3.1. Novel Antibody Therapies Market for HER2-PBC, Historical Trends (Since 2023) and Forecasted Estimates (Till 2035)
- 20.3.2. Novel Antibody Therapies Market for CHL, Historical Trends (Since 2023) and Forecasted Estimates (Till 2035)
- 20.3.3. Novel Antibody Therapies Market for pcALCL or CD30 MF, Historical Trends (Since 2023) and Forecasted Estimates (Till 2035)
- 20.3.4. Novel Antibody Therapies Market for PUSALCL or CD30 PTCL, Historical Trends (Since 2023) and Forecasted Estimates (Till 2035)
- 20.3.5. Novel Antibody Therapies Market for BPDCN, Historical Trends (Since 2023) and Forecasted Estimates (Till 2035)
- 20.3.6. Novel Antibody Therapies Market for RRBPALL, Historical Trends (Since 2023) and Forecasted Estimates (Till 2035)
- 20.3.7. Novel Antibody Therapies Market for RRCTL, Historical Trends (Since 2023) and Forecasted Estimates (Till 2035)
- 20.3.8. Novel Antibody Therapies Market for STS, Historical Trends (Since 2023) and Forecasted Estimates (Till 2035)
- 20.3.9. Novel Antibody Therapies Market for LAMSM, Historical Trends (Since 2023) and Forecasted Estimates (Till 2035)
- 20.3.10. Novel Antibody Therapies Market for RRAML, Historical Trends (Since 2023) and Forecasted Estimates (Till 2035)
- 20.3.11. Novel Antibody Therapies Market for DLBL, Historical Trends (Since 2023) and Forecasted Estimates (Till 2035)
- 20.3.12. Novel Antibody Therapies Market for MCRPC, Historical Trends (Since 2023) and Forecasted Estimates (Till 2035)
- 20.4. Data Triangulation and Validation
21. NOVEL ANTIBODY THERAPIES MARKET, BY TYPE OF THERAPY
- 21.1. Chapter Overview
- 21.2. Key Assumptions and Methodology
- 21.3. Novel Antibody Therapies Market: Distribution by Type of Therapy
- 21.3.1. Novel Antibody Therapies Market for Monotherapy, Historical Trends (Since 2023) and Forecasted Estimates (Till 2035)
- 21.3.2. Novel Antibody Therapies Market for Combination Therapy, Historical Trends (Since 2023) and Forecasted Estimates (Till 2035)
- 21.4. Data Triangulation and Validation
22. NOVEL ANTIBODY THERAPIES MARKET, BY ROUTE OF ADMINISTRATION
- 22.1. Chapter Overview
- 22.2. Key Assumptions and Methodology
- 22.3. Novel Antibody Therapies Market: Distribution by Route of Administration
- 22.3.1. Novel Antibody Therapies Market for Intravenous, Historical Trends (Since 2023) and Forecasted Estimates (Till 2035)
- 22.3.2. Novel Antibody Therapies Market for Intratumoral, Historical Trends (Since 2023) and Forecasted Estimates (Till 2035)
- 22.4. Data Triangulation and Validation
23. NOVEL ANTIBODY THERAPIES MARKET, BY KEY GEOGRAPHICAL REGIONS
- 23.1. Chapter Overview
- 23.2. Key Assumptions and Methodology
- 23.3. Novel Antibody Therapies Market: Distribution by Geographical Regions
- 23.3.1. Novel Antibody Therapies Market in North America, Historical Trends (Since 2023) and Forecasted Estimates (Till 2035)
- 23.3.1.1. Novel Antibody Therapies Market in the US, Historical Trends (Since 2023) and Forecasted Estimates (Till 2035)
- 23.3.1.2. Novel Antibody Therapies Market in Canada, Historical Trends (Since 2023) and Forecasted Estimates (Till 2035)
- 23.3.2. Novel Antibody Therapies Market in Europe, Historical Trends (Since 2023) and Forecasted Estimates (Till 2035)
- 23.3.2.1. Novel Antibody Therapies Market in Germany, Historical Trends (Since 2023) and Forecasted Estimates (Till 2035)
- 23.3.2.2. Novel Antibody Therapies Market in the UK, Historical Trends (Since 2023) and Forecasted Estimates (Till 2035)
- 23.3.2.3. Novel Antibody Therapies Market in France, Historical Trends (Since 2023) and Forecasted Estimates (Till 2035)
- 23.3.2.4. Novel Antibody Therapies Market in Italy, Historical Trends (Since 2023) and Forecasted Estimates (Till 2035)
- 23.3.2.5. Novel Antibody Therapies Market in Spain, Historical Trends (Since 2023) and Forecasted Estimates (Till 2035)
- 23.3.3. Novel Antibody Therapies Market in Asia-Pacific, Historical Trends (Since 2023) and Forecasted Estimates (Till 2035)
- 23.3.3.1. Novel Antibody Therapies Market in China, Historical Trends (Since 2023) and Forecasted Estimates (Till 2035)
- 23.3.3.2. Novel Antibody Therapies Market in Japan, Historical Trends (Since 2023) and Forecasted Estimates (Till 2035)
- 23.3.3.3. Novel Antibody Therapies Market in Australia, Historical Trends (Since 2023) and Forecasted Estimates (Till 2035)
- 23.3.3.4. Novel Antibody Therapies Market in New Zealand, Historical Trends (Since 2023) and Forecasted Estimates (Till 2035)
- 23.3.4. Novel Antibody Therapies Market in Middle East and North Africa, Historical Trends (Since 2023) and Forecasted Estimates (Till 2035)
- 23.3.4.1. Novel Antibody Therapies Market in Egypt, Historical Trends (Since 2023) and Forecasted Estimates (Till 2035)
- 23.3.4.2. Novel Antibody Therapies Market in South Africa, Historical Trends (Since 2023) and Forecasted Estimates (Till 2035)
- 23.3.4.3. Novel Antibody Therapies Market in Iraq, Historical Trends (Since 2023) and Forecasted Estimates (Till 2035)
- 23.3.4.4. Novel Antibody Therapies Market in Morocco, Historical Trends (Since 2023) and Forecasted Estimates (Till 2035)
- 23.3.1. Novel Antibody Therapies Market in North America, Historical Trends (Since 2023) and Forecasted Estimates (Till 2035)
- 23.4. Novel Antibody Therapies Market, By Geographical Regions: Market Dynamics Assessment
- 23.4.1. Market Movement Analysis
- 23.4.2. Penetration-Growth (P-G) Matrix
- 23.5. Data Triangulation and Validation
24. MARKET OPPORTUNITY ANALYSIS: NORTH AMERICA
- 24.1. Novel Antibody Therapies Market in North America: Distribution by Drugs
- 24.1.1. Novel Antibody Therapies Market in North America for Adcetris, Historical Trends (Since 2023) and Forecasted Estimates (Till 2035)
- 24.1.2. Novel Antibody Therapies Market in North America for Kadcyla, Historical Trends (Since 2023) and Forecasted Estimates (Till 2035)
- 24.1.3. Novel Antibody Therapies Market in North America for ELZONRIS, Historical Trends (Since 2023) and Forecasted Estimates (Till 2035)
- 24.1.4. Novel Antibody Therapies Market in North America for Besponsa, Historical Trends (Since 2023) and Forecasted Estimates (Till 2035)
- 24.1.5. Novel Antibody Therapies Market in North America for LYMPHIR, Historical Trends (Since 2023) and Forecasted Estimates (Till 2035)
- 24.1.6. Novel Antibody Therapies Market in North America for Fibromun, Historical Trends (Since 2023) and Forecasted Estimates (Till 2035)
- 24.1.7. Novel Antibody Therapies Market in North America for Nidlegy, Historical Trends (Since 2023) and Forecasted Estimates (Till 2035)
- 24.1.8. Novel Antibody Therapies Market in North America for Iomab-B, Historical Trends (Since 2023) and Forecasted Estimates (Till 2035)
- 24.1.9. Novel Antibody Therapies Market in North America for TLX 591, Historical Trends (Since 2023) and Forecasted Estimates (Till 2035)
- 24.2. Novel Antibody Therapies Market in North America: Distribution by Type of Novel Antibody
- 24.2.1. Novel Antibody Therapies Market in North America for Immunotoxins, Historical Trends (Since 2023) and Forecasted Estimates (Till 2035)
- 24.2.2. Novel Antibody Therapies Market in North America for Immunocytokines, Historical Trends (Since 2023) and Forecasted Estimates (Till 2035)
- 24.2.3. Novel Antibody Therapies Market in North America for Radioisotope Immunoconjugates, Historical Trends (Since 2023) and Forecasted Estimates (Till 2035)
- 24.3. Novel Antibody Therapies Market in North America: Distribution by Target Indication
- 24.3.1. Novel Antibody Therapies Market in North America for HER2-PBC, Historical Trends (Since 2023) and Forecasted Estimates (Till 2035)
- 24.3.2. Novel Antibody Therapies Market in North America for CHL, Historical Trends (Since 2023) and Forecasted Estimates (Till 2035)
- 24.3.3. Novel Antibody Therapies Market in North America for pcALCL or CD30 MF, Historical Trends (Since 2023) and Forecasted Estimates (Till 2035)
- 24.3.4. Novel Antibody Therapies Market in North America for PUSALCL or CD30 PTCL, Historical Trends (Since 2023) and Forecasted Estimates (Till 2035)
- 24.3.5. Novel Antibody Therapies Market in North America for BPDCN, Historical Trends (Since 2023) and Forecasted Estimates (Till 2035)
- 24.3.6. Novel Antibody Therapies Market in North America for RRBPALL, Historical Trends (Since 2023) and Forecasted Estimates (Till 2035)
- 24.3.7. Novel Antibody Therapies Market in North America for RRCTL, Historical Trends (Since 2023) and Forecasted Estimates (Till 2035)
- 24.3.8. Novel Antibody Therapies Market in North America for STS, Historical Trends (Since 2023) and Forecasted Estimates (Till 2035)
- 24.3.9. Novel Antibody Therapies Market in North America for LAMSM, Historical Trends (Since 2023) and Forecasted Estimates (Till 2035)
- 24.3.10. Novel Antibody Therapies Market in North America for RRAML, Historical Trends (Since 2023) and Forecasted Estimates (Till 2035)
- 24.3.11. Novel Antibody Therapies Market in North America for DLBL, Historical Trends (Since 2023) and Forecasted Estimates (Till 2035)
- 24.3.12. Novel Antibody Therapies Market in North America for MCRPC, Historical Trends (Since 2023) and Forecasted Estimates (Till 2035)
- 24.4. Novel Antibody Therapies Market in North America: Distribution by Type of Therapy
- 24.4.1. Novel Antibody Therapies Market in North America for Monotherapy, Historical Trends (Since 2021) and Forecasted Estimates (Till 2035)
- 24.4.2. Novel Antibody Therapies Market in North America for Combination Therapy, Historical Trends (Since 2021) and Forecasted Estimates (Till 2035)
- 24.5. Novel Antibody Therapies Market in North America: Distribution by Route of Administration
- 24.5.1. Novel Antibody Therapies Market in North America for Intravenous, Historical Trends (Since 2023) and Forecasted Estimates (Till 2035)
- 24.5.2. Novel Antibody Therapies Market in North America for Intratumoral, Historical Trends (Since 2023) and Forecasted Estimates (Till 2035)
25. MARKET OPPORTUNITY ANALYSIS: EUROPE
- 25.1. Novel Antibody Therapies Market in Europe: Distribution by Drugs
- 25.1.1. Novel Antibody Therapies Market in Europe for Adcetris, Historical Trends (Since 2023) and Forecasted Estimates (Till 2035)
- 25.1.2. Novel Antibody Therapies Market in Europe for for Kadcyla, Historical Trends (Since 2023) and Forecasted Estimates (Till 2035)
- 25.1.3. Novel Antibody Therapies Market in Europe for for ELZONRIS, Historical Trends (Since 2023) and Forecasted Estimates (Till 2035)
- 25.1.4. Novel Antibody Therapies Market in Europe for for Besponsa, Historical Trends (Since 2023) and Forecasted Estimates (Till 2035)
- 25.1.5. Novel Antibody Therapies Market in Europe for for LYMPHIR, Historical Trends (Since 2023) and Forecasted Estimates (Till 2035)
- 25.1.6. Novel Antibody Therapies Market in Europe for for Fibromun, Historical Trends (Since 2023) and Forecasted Estimates (Till 2035)
- 25.1.7. Novel Antibody Therapies Market in Europe for for Nidlegy, Historical Trends (Since 2023) and Forecasted Estimates (Till 2035)
- 25.1.8. Novel Antibody Therapies Market in Europe for for Iomab-B, Historical Trends (Since 2023) and Forecasted Estimates (Till 2035)
- 25.1.9. Novel Antibody Therapies Market in Europe for for TLX 591, Historical Trends (Since 2023) and Forecasted Estimates (Till 2035)
- 25.2. Novel Antibody Therapies Market in Europe: Distribution by Type of Novel Antibody
- 25.2.1. Novel Antibody Therapies Market in Europe for Immunotoxins, Historical Trends (Since 2023) and Forecasted Estimates (Till 2035)
- 25.2.2. Novel Antibody Therapies Market in Europe for Immunocytokines, Historical Trends (Since 2023) and Forecasted Estimates (Till 2035)
- 25.2.3. Novel Antibody Therapies Market in Europe for Radioisotope Immunoconjugates, Historical Trends (Since 2023) and Forecasted Estimates (Till 2035)
- 25.3. Novel Antibody Therapies Market in Europe: Distribution by Target Indication
- 25.3.1. Novel Antibody Therapies Market in Europe for HER2-PBC, Historical Trends (Since 2023) and Forecasted Estimates (Till 2035)
- 25.3.2. Novel Antibody Therapies Market in Europe for CHL, Historical Trends (Since 2023) and Forecasted Estimates (Till 2035)
- 25.3.3. Novel Antibody Therapies Market in Europe for pcALCL or CD30 MF, Historical Trends (Since 2023) and Forecasted Estimates (Till 2035)
- 25.3.4. Novel Antibody Therapies Market in Europe for PUSALCL or CD30 PTCL, Historical Trends (Since 2023) and Forecasted Estimates (Till 2035)
- 25.3.5. Novel Antibody Therapies Market in Europe for BPDCN, Historical Trends (Since 2023) and Forecasted Estimates (Till 2035)
- 25.3.6. Novel Antibody Therapies Market in Europe for RRBPALL, Historical Trends (Since 2023) and Forecasted Estimates (Till 2035)
- 25.3.7. Novel Antibody Therapies Market in Europe for RRCTL, Historical Trends (Since 2023) and Forecasted Estimates (Till 2035)
- 25.3.8. Novel Antibody Therapies Market in Europe for STS, Historical Trends (Since 2023) and Forecasted Estimates (Till 2035)
- 25.3.9. Novel Antibody Therapies Market in Europe for LAMSM, Historical Trends (Since 2023) and Forecasted Estimates (Till 2035)
- 25.3.10. Novel Antibody Therapies Market in Europe for RRAML, Historical Trends (Since 2023) and Forecasted Estimates (Till 2035)
- 25.3.11. Novel Antibody Therapies Market in Europe for DLBL, Historical Trends (Since 2023) and Forecasted Estimates (Till 2035)
- 25.3.12. Novel Antibody Therapies Market in Europe for MCRPC, Historical Trends (Since 2023) and Forecasted Estimates (Till 2035)
- 25.4. Novel Antibody Therapies Market in Europe: Distribution by Type of Therapy
- 25.4.1. Novel Antibody Therapies Market in Europe for Monotherapy, Historical Trends (Since 2021) and Forecasted Estimates (Till 2035)
- 25.4.2. Novel Antibody Therapies Market in Europe for Combination Therapy, Historical Trends (Since 2021) and Forecasted Estimates (Till 2035)
- 25.5. Novel Antibody Therapies Market in Europe: Distribution by Route of Administration
- 25.5.1. Novel Antibody Therapies Market in Europe for Intravenous, Historical Trends (Since 2023) and Forecasted Estimates (Till 2035)
- 25.5.2. Novel Antibody Therapies Market in Europe for Intratumoral, Historical Trends (Since 2023) and Forecasted Estimates (Till 2035)
26. MARKET OPPORTUNITY ANALYSIS: ASIA-PACIFIC
- 26.1. Novel Antibody Therapies Market in Asia-Pacific: Distribution by Drugs
- 26.1.1. Novel Antibody Therapies Market in Asia-Pacific for Adcetris, Historical Trends (Since 2023) and Forecasted Estimates (Till 2035)
- 26.1.2. Novel Antibody Therapies Market in Asia-Pacific for for Kadcyla, Historical Trends (Since 2023) and Forecasted Estimates (Till 2035)
- 26.1.3. Novel Antibody Therapies Market in Asia-Pacific for for ELZONRIS, Historical Trends (Since 2023) and Forecasted Estimates (Till 2035)
- 26.1.4. Novel Antibody Therapies Market in Asia-Pacific for for Besponsa, Historical Trends (Since 2023) and Forecasted Estimates (Till 2035)
- 26.1.5. Novel Antibody Therapies Market in Asia-Pacific for for LYMPHIR, Historical Trends (Since 2023) and Forecasted Estimates (Till 2035)
- 26.1.6. Novel Antibody Therapies Market in Asia-Pacific for for Fibromun, Historical Trends (Since 2023) and Forecasted Estimates (Till 2035)
- 26.1.7. Novel Antibody Therapies Market in Asia-Pacific for for Nidlegy, Historical Trends (Since 2023) and Forecasted Estimates (Till 2035)
- 26.1.8. Novel Antibody Therapies Market in Asia-Pacific for for Iomab-B, Historical Trends (Since 2023) and Forecasted Estimates (Till 2035)
- 26.1.9. Novel Antibody Therapies Market in Asia-Pacific for for TLX 591, Historical Trends (Since 2023) and Forecasted Estimates (Till 2035)
- 26.2. Novel Antibody Therapies Market in Asia-Pacific: Distribution by Type of Novel Antibody
- 26.2.1. Novel Antibody Therapies Market in Asia-Pacific for Immunotoxins, Historical Trends (Since 2023) and Forecasted Estimates (Till 2035)
- 26.2.2. Novel Antibody Therapies Market in Asia-Pacific for Immunocytokines, Historical Trends (Since 2023) and Forecasted Estimates (Till 2035)
- 26.2.3. Novel Antibody Therapies Market in Asia-Pacific for Radioisotope Immunoconjugates, Historical Trends (Since 2023) and Forecasted Estimates (Till 2035)
- 26.3. Novel Antibody Therapies Market in Asia-Pacific: Distribution by Target Indication
- 26.3.1. Novel Antibody Therapies Market in Asia-Pacific for HER2-PBC, Historical Trends (Since 2023) and Forecasted Estimates (Till 2035)
- 26.3.2. Novel Antibody Therapies Market in Asia-Pacific for CHL, Historical Trends (Since 2023) and Forecasted Estimates (Till 2035)
- 26.3.3. Novel Antibody Therapies Market in Asia-Pacific for pcALCL or CD30 MF, Historical Trends (Since 2023) and Forecasted Estimates (Till 2035)
- 26.3.4. Novel Antibody Therapies Market in Asia-Pacific for PUSALCL or CD30 PTCL, Historical Trends (Since 2023) and Forecasted Estimates (Till 2035)
- 26.3.5. Novel Antibody Therapies Market in Asia-Pacific for BPDCN, Historical Trends (Since 2023) and Forecasted Estimates (Till 2035)
- 26.3.6. Novel Antibody Therapies Market in Asia-Pacific for RRBPALL, Historical Trends (Since 2023) and Forecasted Estimates (Till 2035)
- 26.3.7. Novel Antibody Therapies Market in Asia-Pacific for RRCTL, Historical Trends (Since 2023) and Forecasted Estimates (Till 2035)
- 26.3.8. Novel Antibody Therapies Market in Asia-Pacific for STS, Historical Trends (Since 2023) and Forecasted Estimates (Till 2035)
- 26.3.9. Novel Antibody Therapies Market in Asia-Pacific for LAMSM, Historical Trends (Since 2023) and Forecasted Estimates (Till 2035)
- 26.3.10. Novel Antibody Therapies Market in Asia-Pacific for RRAML, Historical Trends (Since 2023) and Forecasted Estimates (Till 2035)
- 26.3.11. Novel Antibody Therapies Market in Asia-Pacific for DLBL, Historical Trends (Since 2023) and Forecasted Estimates (Till 2035)
- 26.3.12. Novel Antibody Therapies Market in Asia-Pacific for MCRPC, Historical Trends (Since 2023) and Forecasted Estimates (Till 2035)
- 26.4. Novel Antibody Therapies Market in Asia-Pacific: Distribution by Type of Therapy
- 26.4.1. Novel Antibody Therapies Market in Asia-Pacific for Monotherapy, Historical Trends (Since 2021) and Forecasted Estimates (Till 2035)
- 26.4.2. Novel Antibody Therapies Market in Asia-Pacific for Combination Therapy, Historical Trends (Since 2021) and Forecasted Estimates (Till 2035)
- 26.5. Novel Antibody Therapies Market in Asia-Pacific: Distribution by Route of Administration
- 26.5.1. Novel Antibody Therapies Market in Asia-Pacific for Intravenous, Historical Trends (Since 2023) and Forecasted Estimates (Till 2035)
- 26.5.2. Novel Antibody Therapies Market in Asia-Pacific for Intratumoral, Historical Trends (Since 2023) and Forecasted Estimates (Till 2035)
27. MARKET OPPORTUNITY ANALYSIS: MIDDLE EAST AND NORTH AFRICA
- 27.1. Novel Antibody Therapies Market in Middle East and North Africa: Distribution by Drugs
- 27.1.1. Novel Antibody Therapies Market in Middle East and North Africa for Adcetris, Historical Trends (Since 2023) and Forecasted Estimates (Till 2035)
- 27.1.2. Novel Antibody Therapies Market in Middle East and North Africa for for Kadcyla, Historical Trends (Since 2023) and Forecasted Estimates (Till 2035)
- 27.1.3. Novel Antibody Therapies Market in Middle East and North Africa for for ELZONRIS, Historical Trends (Since 2023) and Forecasted Estimates (Till 2035)
- 27.1.4. Novel Antibody Therapies Market in Middle East and North Africa for for Besponsa, Historical Trends (Since 2023) and Forecasted Estimates (Till 2035)
- 27.1.5. Novel Antibody Therapies Market in Middle East and North Africa for for LYMPHIR, Historical Trends (Since 2023) and Forecasted Estimates (Till 2035)
- 27.1.6. Novel Antibody Therapies Market in Middle East and North Africa for for Fibromun, Historical Trends (Since 2023) and Forecasted Estimates (Till 2035)
- 27.1.7. Novel Antibody Therapies Market in Middle East and North Africa for for Nidlegy, Historical Trends (Since 2023) and Forecasted Estimates (Till 2035)
- 27.1.8. Novel Antibody Therapies Market in Middle East and North Africa for for Iomab-B, Historical Trends (Since 2023) and Forecasted Estimates (Till 2035)
- 27.1.9. Novel Antibody Therapies Market in Middle East and North Africa for for TLX 591, Historical Trends (Since 2023) and Forecasted Estimates (Till 2035)
- 27.2. Novel Antibody Therapies Market in Middle East and North Africa: Distribution by Type of Novel Antibody
- 27.2.1. Novel Antibody Therapies Market in Middle East and North Africa for Immunotoxins, Historical Trends (Since 2023) and Forecasted Estimates (Till 2035)
- 27.2.2. Novel Antibody Therapies Market in Middle East and North Africa for Immunocytokines, Historical Trends (Since 2023) and Forecasted Estimates (Till 2035)
- 27.2.3. Novel Antibody Therapies Market in Middle East and North Africa for Radioisotope Immunoconjugates, Historical Trends (Since 2023) and Forecasted Estimates (Till 2035)
- 27.3. Novel Antibody Therapies Market in Middle East and North Africa: Distribution by Target Indication
- 27.3.1. Novel Antibody Therapies Market in Middle East and North Africa for HER2-PBC, Historical Trends (Since 2023) and Forecasted Estimates (Till 2035)
- 27.3.2. Novel Antibody Therapies Market in Middle East and North Africa for CHL, Historical Trends (Since 2023) and Forecasted Estimates (Till 2035)
- 27.3.3. Novel Antibody Therapies Market in Middle East and North Africa for PCALCL or CD30 MF, Historical Trends (Since 2023) and Forecasted Estimates (Till 2035)
- 27.3.4. Novel Antibody Therapies Market in Middle East and North Africa for PUSALCL or CD30 PTCL, Historical Trends (Since 2023) and Forecasted Estimates (Till 2035)
- 27.3.5. Novel Antibody Therapies Market in Middle East and North Africa for BPDCN, Historical Trends (Since 2023) and Forecasted Estimates (Till 2035)
- 27.3.6. Novel Antibody Therapies Market in Middle East and North Africa for RRBPALL, Historical Trends (Since 2023) and Forecasted Estimates (Till 2035)
- 27.3.7. Novel Antibody Therapies Market in Middle East and North Africa for RRCTL, Historical Trends (Since 2023) and Forecasted Estimates (Till 2035)
- 27.3.8. Novel Antibody Therapies Market in Middle East and North Africa for STS, Historical Trends (Since 2023) and Forecasted Estimates (Till 2035)
- 27.3.9. Novel Antibody Therapies Market in Middle East and North Africa for LAMSM, Historical Trends (Since 2023) and Forecasted Estimates (Till 2035)
- 27.3.10. Novel Antibody Therapies Market in Middle East and North Africa for RRAML, Historical Trends (Since 2023) and Forecasted Estimates (Till 2035)
- 27.3.11. Novel Antibody Therapies Market in Middle East and North Africa for DLBL, Historical Trends (Since 2023) and Forecasted Estimates (Till 2035)
- 27.3.12. Novel Antibody Therapies Market in Middle East and North Africa for MCRPC, Historical Trends (Since 2023) and Forecasted Estimates (Till 2035)
- 27.4. Novel Antibody Therapies Market in Middle East and North Africa: Distribution by Type of Therapy
- 27.4.1. Novel Antibody Therapies Market in Middle East and North Africa for Monotherapy, Historical Trends (Since 2021) and Forecasted Estimates (Till 2035)
- 27.4.2. Novel Antibody Therapies Market in Middle East and North Africa for Combination Therapy, Historical Trends (Since 2021) and Forecasted Estimates (Till 2035)
- 27.5. Novel Antibody Therapies Market in Middle East and North Africa: Distribution by Route of Administration
- 27.5.1. Novel Antibody Therapies Market in Middle East and North Africa for Intravenous, Historical Trends (Since 2023) and Forecasted Estimates (Till 2035)
- 27.5.2. Novel Antibody Therapies Market in Middle East and North Africa for Intratumoral, Historical Trends (Since 2023) and Forecasted Estimates (Till 2035)
28. NOVEL ANTIBODY THERAPIES MARKET, BY LEADING PLAYERS
- 28.1. Chapter Overview
- 28.2. Key Assumptions and Methodology
- 28.3. Novel Antibody Therapies Market: Distribution by Leading Companies
- 28.4. Data Triangulation and Validation
29. TABULATED DATA
30. LIST OF COMPANIES AND ORGANIZATIONS
List of Tables
- Table 7.1 List of Radioisotope Immunoconjugates
- Table 7.2 List of Radioisotope Immunoconjugates Developers
- Table 8.1 List of Immunocytokines
- Table 8.2 List of Immunocytokine Developers
- Table 9.1 List of Immunotoxins
- Table 9.2 List of Immunotoxin Developers
- Table 12.1 Novel Antibody Therapies: List of Publications, since 2020
- Table 13.1 Novel Antibody Therapies: List of Published Patents
- Table 14.1 Novel Antibody Therapies: List of Partnerships and Collaborations, since 2020
- Table 25.1 Radioisotope Immunoconjugates: Distribution by Stage of Development
- Table 25.2 Radioisotope Immunoconjugates: Distribution by Type of Therapy
- Table 25.3 Radioisotope Immunoconjugates: Distribution by Dosing Frequency
- Table 25.4 Radioisotope Immunoconjugates: Distribution by Route of Administration
- Table 25.5 Radioisotope Immunoconjugates: Distribution by Type of Radioisotope
- Table 25.6 Radioisotope Immunoconjugates: Distribution by Mode of Administration
- Table 25.7 Radioisotope Immunoconjugates: Distribution by Mechanism of Action
- Table 25.8 Radioisotope Immunoconjugates: Distribution by Therapeutic Area
- Table 25.9 Radioisotope Immunoconjugate Developers: Distribution by Year of Establishment
- Table 25.10 Radioisotope Immunoconjugate Developers: Distribution by Company Size
- Table 25.11 Radioisotope Immunoconjugate Developers: Distribution by Location of Headquarters
- Table 25.12 Radioisotope Immunoconjugate Developers: Distribution by Type of Developer
- Table 25.13 Most Active Players: Distribution by Number of Therapies
- Table 25.14 Immunocytokines: Distribution by Stage of Development
- Table 25.15 Immunocytokines: Distribution by Type of Cytokine
- Table 25.16 Immunocytokines: Distribution by Type of Therapy
- Table 25.17 Immunocytokines: Distribution by Dosing Frequency
- Table 25.18 Immunocytokines: Distribution by Mechanism of Action
- Table 25.19 Immunocytokines: Distribution by Mode of Administration
- Table 25.20 Immunocytokines: Distribution by Type of Antigen / Format
- Table 25.21 Immunocytokines: Distribution by Route of Administration
- Table 25.22 Immunocytokines: Distribution by Therapeutic Area
- Table 25.23 Immunocytokine Developers: Distribution by Year of Establishment
- Table 25.24 Immunocytokine Developers: Distribution by Company Size
- Table 25.25 Immunocytokine Developers: Distribution by Location of Headquarters (Region)
- Table 25.26 Immunocytokine Developers: Distribution by Location of Headquarters (Country)
- Table 25.27 Immunocytokine Developers: Distribution by Type of Developer
- Table 25.28 Most Active Players: Distribution by Number of Therapies
- Table 25.29 Immunotoxin Therapies: Distribution by Stage of Development
- Table 25.30 Immunotoxin Therapies: Distribution by Type of Toxin
- Table 25.31 Immunotoxin Therapies: Distribution by Dosing Frequency
- Table 25.32 Immunotoxin Therapies: Distribution by Type of Therapy
- Table 25.33 Immunotoxin Therapies: Distribution by Mode of Administration
- Table 25.34 Immunotoxin Therapies: Distribution by Type of Target
- Table 25.35 Immunotoxin Therapies: Distribution by Route of Administration
- Table 25.36 Immunotoxin Therapies: Distribution by Therapeutic Area
- Table 25.37 Immunotoxin Developers: Distribution by Year of Establishment
- Table 25.38 Immunotoxin Developers: Distribution by Developer Size
- Table 25.39 Immunotoxin Developers: Distribution by Location of Headquarters (Region)
- Table 25.40 Immunotoxin Developers: Distribution by Location of Headquarters (Country)
- Table 25.41 Immunotoxin Developers: Distribution by Type of Developer
- Table 25.42 Most Active Players: Distribution by Number of Therapies
- Table 25.43 Clinical Trial Analysis: Distribution by Trial Registration Year
- Table 25.44 Clinical Trial Analysis: Distribution by Trial Status
- Table 25.45 Clinical Trial Analysis: Distribution by Trial Registration Year and Trial Status
- Table 25.46 Clinical Trial Analysis: Distribution of Enrolled Patient Population by Trial Registration Year
- Table 25.47 Clinical Trial Analysis: Distribution of Enrolled Patient Population by Trial Phase
- Table 25.48 Clinical Trial Analysis: Distribution by Trial Phase
- Table 25.49 Clinical Trial Analysis: Distribution of Enrolled Patient Population by Trial Phase
- Table 25.50 Clinical Trial Analysis: Distribution by Study Design
- Table 25.51 Clinical Trial Analysis: Distribution by Target Patient Population
- Table 25.52 Clinical Trial Analysis: Distribution by Patient Gender
- Table 25.53 Clinical Trial Analysis: Distribution by Type of Sponsor / Collaborator
- Table 25.54 Most Active Players: Distribution by Number of Registered Trials
- Table 25.55 Clinical Trial Analysis: Distribution of Trials and Number of Patients Enrolled by Geography
- Table 25.56 Clinical Trial Analysis: Distribution of Enrolled Patient Population by Trial Status and Geography
- Table 25.57 Publication Analysis: Distribution by Year of Publication
- Table 25.58 Publication Analysis: Distribution by Type of Publication
- Table 25.59 Most Popular Publisher: Distribution by Number of Publications
- Table 25.60 Key Journals: Distribution by Number of Publications
- Table 25.61 Publication Analysis: Distribution by Impact Factor
- Table 25.62 Patent Analysis: Distribution by Publication Year
- Table 25.63 Patent Analysis: Distribution by Type of Patent
- Table 25.64 Patent Analysis: Distribution of Granted Patents and Patent Applications by Publication Year
- Table 25.65 Patent Analysis: Cumulative Year-wise Distribution by Type of Applicant
- Table 25.66 Patent Analysis: Distribution by Application Year
- Table 25.67 Patent Analysis: Distribution by Patent Jurisdiction (Region)
- Table 25.68 Patent Analysis: Distribution by Patent Jurisdiction (Country)
- Table 25.69 Patent Analysis: Distribution by Patent Age
- Table 25.70 Leading Industry Players: Distribution by Number of Patents
- Table 25.71 Leading Non-Industry Players: Distribution by Number of Patents
- Table 25.72 Leading Individual Assignees: Distribution by Number of Patents
- Table 25.73 Patent Benchmarking Analysis: Distribution of Patent Characteristics (CPC Codes) by Leading Industry Players
- Table 25.74 Patent Benchmarking Analysis: Distribution of Leading Industry Players by Patent Characteristics (CPC Codes)
- Table 25.75 Partnerships and Collaborations: Cumulative Year-wise Trend
- Table 25.76 Partnerships and Collaborations: Distribution by Type of Partnership
- Table 25.77 Partnerships and Collaborations: Distribution by Year and Type of Partnership
- Table 25.78 Partnerships and Collaborations: Distribution by Most Popular Drug
- Table 25.79 Partnerships and Collaborations: Distribution by Type of Partner
- Table 25.80 Most Active Players: Distribution by Number of Partnerships
- Table 25.81 Partnerships and Collaborations: Distribution by Therapeutic Area
- Table 25.82 Partnerships and Collaborations: Distribution by Therapeutic Area and Type of Partnership
- Table 25.83 Partnerships and Collaborations: Distribution by Country
- Table 25.84 Partnerships and Collaborations: Distribution by Continent
- Table 25.85 Global Novel Antibody Therapies Market, Historical Trends (since 2023) and Forecasted Estimates (till 2035) (USD Million)
- Table 25.86 Global Novel Antibody Therapies Market, Historical Trends (since 2023) and Forecasted Estimates (till 2035): Conservative Scenario (USD Million)
- Table 25.87 Global Novel Antibody Therapies Market, Historical Trends (since 2023) and Forecasted Estimates (till 2035): Optimistic Scenario (USD Million)
- Table 25.88 Novel Antibody Therapies Market: Distribution by Drug
- Table 25.89 Novel Antibody Therapies Market for Adcetris, Historical Trends (since 2023) and Forecasted Estimates (till 2035) (USD Million)
- Table 25.90 Novel Antibody Therapies Market for Kadcyla, Historical Trends (since 2023) and Forecasted Estimates (till 2035) (USD Million)
- Table 25.91 Novel Antibody Therapies Market for ELZONRIS, Historical Trends (since 2023) and Forecasted Estimates (till 2035) (USD Million)
- Table 25.92 Novel Antibody Therapies Market for Besponsa, Historical Trends (since 2023) and Forecasted Estimates (till 2035) (USD Million)
- Table 25.93 Novel Antibody Therapies Market for LYMPHIR, Historical Trends (since 2023) and Forecasted Estimates (till 2035) (USD Million)
- Table 25.94 Novel Antibody Therapies Market for Fibromun, Historical Trends (since 2023) and Forecasted Estimates (till 2035) (USD Million)
- Table 25.95 Novel Antibody Therapies Market for Nidlegy, Historical Trends (since 2023) and Forecasted Estimates (till 2035) (USD Million)
- Table 25.96 Novel Antibody Therapies Market for Iomab-B, Historical Trends (since 2023) and Forecasted Estimates (till 2035) (USD Million)
- Table 25.97 Novel Antibody Therapies Market for TLX 591, Historical Trends (since 2023) and Forecasted Estimates (till 2035) (USD Million)
- Table 25.98 Novel Antibody Therapies Market: Distribution by Type of Novel Antibody
- Table 25.99 Novel Antibody Therapies Market for Immunotoxins, Historical Trends (since 2023) and Forecasted Estimates (till 2035) (USD Million)
- Table 25.100 Novel Antibody Therapies Market for Immunocytokines, Historical Trends (since 2023) and Forecasted Estimates (till 2035) (USD Million)
- Table 25.101 Novel Antibody Therapies Market for Immunoconjugates, Historical Trends (since 2023) and Forecasted Estimates (till 2035) (USD Million)
- Table 25.102 Novel Antibody Therapies Market: Distribution by Target Indication
- Table 25.103 Novel Antibody Therapies Market for HER2-Positive Breast Cancer, Historical Trends (since 2023) and Forecasted Estimates (till 2035) (USD Million)
- Table 25.104 Novel Antibody Therapies Market for Classical Hodgkin Lymphoma, Historical Trends (since 2023) and Forecasted Estimates (till 2035) (USD Million)
- Table 25.105 Novel Antibody Therapies Market for Primary Cutaneous Anaplastic Large Cell Lymphoma or CD30-expressing Mycosis Fungoides, Historical Trends (since 2023) and Forecasted Estimates (till 2035) (USD Million)
- Table 25.106 Novel Antibody Therapies Market for Previously Untreated Systemic Anaplastic Large Cell Lymphoma or CD30-expressing Peripheral T-cell Lymphomas, Historical Trends (since 2023) and Forecasted Estimates (till 2035) (USD Million)
- Table 25.107 Novel Antibody Therapies Market for Blastic Plasmacytoid Dendritic Cell Neoplasm, Historical Trends (since 2023) and Forecasted Estimates (till 2035) (USD Million)
- Table 25.108 Novel Antibody Therapies Market for Relapsed or Refractory Cutaneous T-cell Lymphoma, Historical Trends (since 2023) and Forecasted Estimates (till 2035) (USD Million)
- Table 25.109 Novel Antibody Therapies Market for Soft Tissue Sarcoma, Historical Trends (since 2023) and Forecasted Estimates (till 2035) (USD Million)
- Table 25.110 Novel Antibody Therapies Market for Locally Advanced Melanoma / Stage III B/C Melanoma, Historical Trends (since 2023) and Forecasted Estimates (till 2035) (USD Million)
- Table 25.111 Novel Antibody Therapies Market for Relapsed/Refractory Acute Myeloid Leukemia, Historical Trends (since 2023) and Forecasted Estimates (till 2035) (USD Million)
- Table 25.112 Novel Antibody Therapies Market for Diffuse Large B-cell Lymphoma, Historical Trends (since 2023) and Forecasted Estimates (till 2035) (USD Million)
- Table 25.113 Novel Antibody Therapies Market for Metastatic Castration-resistant Prostate Cancer, Historical Trends (since 2023) and Forecasted Estimates (till 2035) (USD Million)
- Table 25.114 Novel Antibody Therapies Market: Distribution by Type of Therapy
- Table 25.115 Novel Antibody Therapies Market for Monotherapy, Historical Trends (since 2023) and Forecasted Estimates (till 2035) (USD Million)
- Table 25.116 Novel Antibody Therapies Market for Combination Therapy, Historical Trends (since 2023) and Forecasted Estimates (till 2035) (USD Million)
- Table 25.117 Novel Antibody Therapies Market: Distribution by Route of Administration
- Table 25.118 Novel Antibody Therapies Market for Intravenous Route of Administration, Historical Trends (since 2023) and Forecasted Estimates (till 2035) (USD Million)
- Table 25.119 Novel Antibody Therapies Market for Intratumoral Route of Administration, Historical Trends (since 2023) and Forecasted Estimates (till 2035) (USD Million)
- Table 25.120 Novel Antibody Therapies Market: Distribution by Key Geographical Regions
- Table 25.121 Novel Antibody Therapies Market in North America, Historical Trends (since 2023) and Forecasted Estimates (till 2035) (USD Million)
- Table 25.122 Novel Antibody Therapies Market in the US, Historical Trends (since 2023) and Forecasted Estimates (till 2035) (USD Million)
- Table 25.123 Novel Antibody Therapies Market in Canada, Historical Trends (since 2023) and Forecasted Estimates (till 2035) (USD Million)
- Table 25.124 Novel Antibody Therapies Market in Europe, Historical Trends (since 2023) and Forecasted Estimates (till 2035) (USD Million)
- Table 25.125 Novel Antibody Therapies Market in Germany, Historical Trends (since 2023) and Forecasted Estimates (till 2035) (USD Million)
- Table 25.126 Novel Antibody Therapies Market in the UK Historical Trends (since 2023) and Forecasted Estimates (till 2035) (USD Million)
- Table 25.127 Novel Antibody Therapies Market in France, Historical Trends (since 2023) and Forecasted Estimates (till 2035) (USD Million)
- Table 25.128 Novel Antibody Therapies Market in Italy, Historical Trends (since 2023) and Forecasted Estimates (till 2035) (USD Million)
- Table 25.129 Novel Antibody Therapies Market in Spain, Historical Trends (since 2023) and Forecasted Estimates (till 2035) (USD Million)
- Table 25.130 Novel Antibody Therapies Market in Asia-Pacific, Historical Trends (since 2023) and Forecasted Estimates (till 2035) (USD Million)
- Table 25.131 Novel Antibody Therapies Market in China, Historical Trends (since 2023) and Forecasted Estimates (till 2035) (USD Million)
- Table 25.132 Novel Antibody Therapies Market in Japan, Historical Trends (since 2023) and Forecasted Estimates (till 2035) (USD Million)
- Table 25.133 Novel Antibody Therapies Market in Australia, Historical Trends (since 2023) and Forecasted Estimates (till 2035) (USD Million)
- Table 25.134 Novel Antibody Therapies Market in New Zealand, Historical Trends (since 2023) and Forecasted Estimates (till 2035) (USD Million)
- Table 25.135 Novel Antibody Therapies Market in Middle East and Africa, Historical Trends (since 2023) and Forecasted Estimates (till 2035) (USD Million)
- Table 25.136 Novel Antibody Therapies Market in Egypt, Historical Trends (since 2023) and Forecasted Estimates (till 2035) (USD Million)
- Table 25.137 Novel Antibody Therapies Market in South Africa, Historical Trends (since 2023) and Forecasted Estimates (till 2035) (USD Million)
- Table 25.138 Novel Antibody Therapies Market in Iraq, Historical Trends (since 2023) and Forecasted Estimates (till 2035) (USD Million)
- Table 25.139 Novel Antibody Therapies Market in Morocco, Historical Trends (since 2023) and Forecasted Estimates (till 2035) (USD Million)
- Table 25.140 Novel Antibody Therapies Market: Distribution by Leading Players, Current Year (based on sales of therapies)
- Table 25.141 Novel Antibody Therapies Market: Distribution by Leading Players, 2035 (based on sales of therapies)
List of Figures
- Figure 2.1 Research Methodology: Project Methodology
- Figure 2.2 Research Methodology: Data Sources for Secondary Research
- Figure 2.3 Research Methodology: Robust Quality Control
- Figure 3.1 Market Dynamics: Forecast Methodology
- Figure 3.2 Market Dynamics: Market Assessment Framework
- Figure 3.3 Market Dynamics: Example List of Parameters
- Figure 4.1 Historical Analysis of Past Recessions and Lessons Learnt
- Figure 5.1 Executive Summary: Market Landscape
- Figure 5.2 Executive Summary: Market Trends
- Figure 5.3 Executive Summary: Market Forecast and Opportunity Analysis
- Figure 6.1 Therapeutic Antibodies: Developmental Approaches
- Figure 6.2 Mechanism of Action of Antibody-Directed Enzyme Prodrug Therapies
- Figure 6.3 Mechanism of Action of TCR like Antibodies
- Figure 6.4 Mechanism of Action of Radioisotope Immunoconjugates
- Figure 6.5 Mechanism of Action of Immunotoxins
- Figure 6.6 Mechanism of Action of Intracellular Antibodies
- Figure 6.7 Mechanism of Action of Immunocytokines
- Figure 7.1 Radioisotope Immunoconjugates: Distribution by Stage of Development
- Figure 7.2 Radioisotope Immunoconjugates: Distribution by Type of Therapy
- Figure 7.3 Radioisotope Immunoconjugates: Distribution by Route of Administration
- Figure 7.4 Radioisotope Immunoconjugates: Distribution by Dosing Frequency
- Figure 7.5 Radioisotope Immunoconjugates: Distribution by Type of Radioisotope
- Figure 7.6 Radioisotope Immunoconjugates: Distribution by Mode of Administration
- Figure 7.7 Radioisotope Immunoconjugates: Distribution by Mechanism of Action
- Figure 7.8 Radioisotope Immunoconjugates: Distribution by Therapeutic Area
- Figure 7.9 Radioisotope Immunoconjugate Developers: Distribution by Year of Establishment
- Figure 7.10 Radioisotope Immunoconjugate Developers: Distribution by Company Size
- Figure 7.11 Radioisotope Immunoconjugate Developers: Distribution by Location of Headquarters
- Figure 7.12 Radioisotope Immunoconjugate Developers: Distribution by Type of Developer
- Figure 7.13 Most Active Players: Distribution by Number of Therapies
- Figure 8.1 Immunocytokines: Distribution by Stage of Development
- Figure 8.2 Immunocytokines: Distribution by Type of Cytokine
- Figure 8.3 Immunocytokines: Distribution by Type of Therapy
- Figure 8.4 Immunocytokines: Distribution by Dosing Frequency
- Figure 8.5 Immunocytokines: Distribution by Mechanism of Action
- Figure 8.6 Immunocytokines: Distribution by Mode of Administration
- Figure 8.7 Immunocytokines: Distribution by Type of Antigen / Format
- Figure 8.8 Immunocytokines: Distribution by Route of Administration
- Figure 8.9 Immunocytokines: Distribution by Therapeutic Area
- Figure 8.10 Immunocytokine Developers: Distribution by Year of Establishment
- Figure 8.11 Immunocytokine Developers: Distribution by Company Size
- Figure 8.12 Immunocytokine Developers: Distribution by Location of Headquarters (Region)
- Figure 8.13 Immunocytokine Developers: Distribution by Location of Headquarters (Country)
- Figure 8.14 Immunocytokine Developers: Distribution by Type of Developer
- Figure 8.15 Most Active Players: Distribution by Number of Therapies
- Figure 9.1 Immunotoxin Therapies: Distribution by Stage of Development
- Figure 9.2 Immunotoxin Therapies: Distribution by Type of Toxin
- Figure 9.3 Immunotoxin Therapies: Distribution by Dosing Frequency
- Figure 9.4 Immunotoxin Therapies: Distribution by Type of Therapy
- Figure 9.5 Immunotoxin Therapies: Distribution by Mode of Administration
- Figure 9.6 Immunotoxin Therapies: Distribution by Type of Target
- Figure 9.7 Immunotoxin Therapies: Distribution by Mechanism of Action
- Figure 9.8 Immunotoxin Therapies: Distribution by Route of Administration
- Figure 9.9 Immunotoxin Therapies: Distribution by Therapeutic Area
- Figure 9.10 Immunotoxin Developers: Distribution by Year of Establishment
- Figure 9.11 Immunotoxin Developers: Distribution by Developer Size
- Figure 9.12 Immunotoxin Developers: Distribution by Location of Headquarters (Region)
- Figure 9.13 Immunotoxin Developers: Distribution by Location of Headquarters (Country)
- Figure 9.14 Immunotoxin Developers: Distribution by Type of Developer
- Figure 9.15 Most Active Players: Distribution by Number of Therapies
- Figure 11.1 Clinical Trial Analysis: Distribution by Trial Registration Year
- Figure 11.2 Clinical Trial Analysis: Distribution by Trial Status
- Figure 11.3 Clinical Trial Analysis: Distribution by Trial Registration Year and Trial Status
- Figure 11.4 Clinical Trial Analysis: Distribution of Enrolled Patient Population by Trial Registration Year
- Figure 11.5 Clinical Trial Analysis: Distribution of Enrolled Patient Population by Trial Phase
- Figure 11.6 Clinical Trial Analysis: Distribution by Trial Phase
- Figure 11.7 Clinical Trial Analysis: Distribution of Enrolled Patient Population by Trial Phase
- Figure 11.8 Clinical Trial Analysis: Distribution by Study Design
- Figure 11.9 Clinical Trial Analysis: Distribution by Target Patient Population
- Figure 11.10 Clinical Trial Analysis: Distribution by Patient Gender
- Figure 11.11 Clinical Trial Analysis: Distribution by Type of Sponsor / Collaborator
- Figure 11.12 Most Active Players: Distribution by Number of Registered Trials
- Figure 11.13 Clinical Trial Analysis: Distribution of Trials and Number of Patients Enrolled by Geography
- Figure 11.14 Clinical Trial Analysis: North America: Key Insights
- Figure 11.15 Clinical Trial Analysis: Europe: Key Insights
- Figure 11.16 Clinical Trial Analysis: Asia-Pacific: Key Insights
- Figure 11.17 Clinical Trial Analysis: Rest of the World: Key Insights
- Figure 11.18 Clinical Trial Analysis: Distribution of Enrolled Patient Population by Trial Status and Geography
- Figure 12.1 Publication Analysis: Distribution by Year of Publication
- Figure 12.2 Publication Analysis: Distribution by Type of Publication
- Figure 12.3 Most Popular Publisher: Distribution by Number of Publications
- Figure 12.4 Key Journals: Distribution by Number of Publications
- Figure 12.5 Publication Analysis: Distribution by Impact Factor
- Figure 13.1 Patent Analysis: Distribution by Publication Year
- Figure 13.2 Patent Analysis: Distribution by Type of Patent
- Figure 13.3 Patent Analysis: Distribution of Granted Patents and Patent Applications by Publication Year
- Figure 13.4 Patent Analysis: Cumulative Year-wise Distribution by Type of Applicant
- Figure 13.5 Patent Analysis: Distribution by Application Year
- Figure 13.6 Patent Analysis: Distribution by Patent Jurisdiction (Region)
- Figure 13.7 Patent Analysis: Distribution by Patent Jurisdiction (Country)
- Figure 13.8 Patent Analysis: Distribution by Patent Age
- Figure 13.9 Leading Industry Players: Distribution by Number of Patents
- Figure 13.10 Leading Non-Industry Players: Distribution by Number of Patents
- Figure 13.11 Leading Individual Assignees: Distribution by Number of Patents
- Figure 13.12 Patent Benchmarking Analysis: Distribution of Patent Characteristics (CPC Codes) by Leading Industry Players
- Figure 13.13 Patent Benchmarking Analysis: Distribution of Leading Industry Players by Patent Characteristics (CPC Codes)
- Figure 13.14 Patent Analysis: Distribution by CPC Symbols
- Figure 13.15 Novel Antibody Therapies Market: Patent Valuation
- Figure 14.1 Partnerships and Collaborations: Cumulative Year-wise Trend
- Figure 14.2 Partnerships and Collaborations: Distribution by Type of Partnership
- Figure 14.3 Partnerships and Collaborations: Distribution by Year and Type of Partnership
- Figure 14.4 Partnerships and Collaborations: Distribution by Most Popular Drug
- Figure 14.5 Partnerships and Collaborations: Distribution by Type of Partner
- Figure 14.6 Most Active Players: Distribution by Number of Partnerships
- Figure 14.7 Partnerships and Collaborations: Distribution by Therapeutic Area
- Figure 14.8 Partnerships and Collaborations: Distribution by Therapeutic Area and Type of Partnership
- Figure 14.9 Partnerships and Collaborations: Distribution by Country
- Figure 14.10 Partnerships and Collaborations: Distribution by Continent
- Figure 15.1 Benchmarking of Big Pharma Players: Distribution by Developer Strength
- Figure 15.2 Benchmarking of Big Pharma Players: Distribution by Portfolio Strength
- Figure 15.3 Benchmarking of Big Pharma Players: Distribution by Portfolio Diversity
- Figure 15.4 Benchmarking of Big Pharma Initiatives: Spider Web Analysis
- Figure 15.5 Big Pharma Initiatives: Harvey Ball Analysis
- Figure 15.6 Big Pharma Initiatives: Benchmarking: Wind Rose Chart
- Figure 16.1 Market Trends and Outlook: Growth Drivers
- Figure 16.2 Market Trends and Outlook: Growth Restraints
- Figure 16.3 Market Trends and Outlook: Market Opportunities
- Figure 16.4 Market Trends and Outlook: Market Challenges
- Figure 17.1 Global Novel Antibody Therapies Market, Historical Trends (since 2023) and Forecasted Estimates (till 2035) (USD Million)
- Figure 17.2 Global Novel Antibody Therapies Market, Historical Trends (since 2023) and Forecasted Estimates (till 2035): Conservative Scenario (USD Million)
- Figure 17.3 Global Novel Antibody Therapies Market, Historical Trends (since 2023) and Forecasted Estimates (till 2035): Optimistic Scenario (USD Million)
- Figure 18.1 Novel Antibody Therapies Market: Distribution by Drug
- Figure 18.2 Novel Antibody Therapies Market for Adcetris, Historical Trends (since 2023) and Forecasted Estimates (till 2035) (USD Million)
- Figure 18.3 Novel Antibody Therapies Market for Kadcyla, Historical Trends (since 2023) and Forecasted Estimates (till 2035) (USD Million)
- Figure 18.4 Novel Antibody Therapies Market for ELZONRIS, Historical Trends (since 2023) and Forecasted Estimates (till 2035) (USD Million)
- Figure 18.5 Novel Antibody Therapies Market for Besponsa, Historical Trends (since 2023) and Forecasted Estimates (till 2035) (USD Million)
- Figure 18.6 Novel Antibody Therapies Market for LYMPHIR, Historical Trends (since 2023) and Forecasted Estimates (till 2035) (USD Million)
- Figure 18.7 Novel Antibody Therapies Market for Fibromun, Historical Trends (since 2023) and Forecasted Estimates (till 2035) (USD Million)
- Figure 18.8 Novel Antibody Therapies Market for Nidlegy, Historical Trends (since 2023) and Forecasted Estimates (till 2035) (USD Million)
- Figure 18.9 Novel Antibody Therapies Market for Iomab-B, Historical Trends (since 2023) and Forecasted Estimates (till 2035) (USD Million)
- Figure 18.10 Novel Antibody Therapies Market for TLX 591, Historical Trends (since 2023) and Forecasted Estimates (till 2035) (USD Million)
- Figure 19.1 Novel Antibody Therapies Market: Distribution by Type of Novel Antibody
- Figure 19.2 Novel Antibody Therapies Market for Immunotoxins, Historical Trends (since 2023) and Forecasted Estimates (till 2035) (USD Million)
- Figure 19.3 Novel Antibody Therapies Market for Immunocytokines, Historical Trends (since 2023) and Forecasted Estimates (till 2035) (USD Million)
- Figure 19.4 Novel Antibody Therapies Market for Immunoconjugates, Historical Trends (since 2023) and Forecasted Estimates (till 2035) (USD Million)
- Figure 20.1 Novel Antibody Therapies Market: Distribution by Target Indication
- Figure 20.2 Novel Antibody Therapies Market for HER2-Positive Breast Cancer, Historical Trends (since 2023) and Forecasted Estimates (till 2035) (USD Million)
- Figure 20.3 Novel Antibody Therapies Market for Classical Hodgkin Lymphoma, Historical Trends (since 2023) and Forecasted Estimates (till 2035) (USD Million)
- Figure 20.4 Novel Antibody Therapies Market for Primary Cutaneous Anaplastic Large Cell Lymphoma or CD30-expressing Mycosis Fungoides, Historical Trends (since 2023) and Forecasted Estimates (till 2035) (USD Million)
- Figure 20.5 Novel Antibody Therapies Market for Previously Untreated Systemic Anaplastic Large Cell Lymphoma or CD30-expressing Peripheral T-cell Lymphomas, Historical Trends (since 2023) and Forecasted Estimates (till 2035) (USD Million)
- Figure 20.6 Novel Antibody Therapies Market for Blastic Plasmacytoid Dendritic Cell Neoplasm, Historical Trends (since 2023) and Forecasted Estimates (till 2035) (USD Million)
- Figure 20.7 Novel Antibody Therapies Market for Relapsed or Refractory Cutaneous T-cell Lymphoma, Historical Trends (since 2023) and Forecasted Estimates (till 2035) (USD Million)
- Figure 20.8 Novel Antibody Therapies Market for Soft Tissue Sarcoma, Historical Trends (since 2023) and Forecasted Estimates (till 2035) (USD Million)
- Figure 20.9 Novel Antibody Therapies Market for Locally Advanced Melanoma / Stage III B/C Melanoma, Historical Trends (since 2023) and Forecasted Estimates (till 2035) (USD Million)
- Figure 20.10 Novel Antibody Therapies Market for Relapsed/Refractory Acute Myeloid Leukemia, Historical Trends (since 2023) and Forecasted Estimates (till 2035) (USD Million)
- Figure 20.11 Novel Antibody Therapies Market for Diffuse Large B-cell Lymphoma, Historical Trends (since 2023) and Forecasted Estimates (till 2035) (USD Million)
- Figure 20.12 Novel Antibody Therapies Market for Metastatic Castration-resistant Prostate Cancer, Historical Trends (since 2023) and Forecasted Estimates (till 2035) (USD Million)
- Figure 21.1 Novel Antibody Therapies Market: Distribution by Type of Therapy
- Figure 21.2 Novel Antibody Therapies Market for Monotherapy, Historical Trends (since 2023) and Forecasted Estimates (till 2035) (USD Million)
- Figure 21.3 Novel Antibody Therapies Market for Combination Therapy, Historical Trends (since 2023) and Forecasted Estimates (till 2035) (USD Million)
- Figure 22.1 Novel Antibody Therapies Market: Distribution by Route of Administration
- Figure 22.2 Novel Antibody Therapies Market for Intravenous Route of Administration, Historical Trends (since 2023) and Forecasted Estimates (till 2035) (USD Million)
- Figure 22.3 Novel Antibody Therapies Market for Intratumoral Route of Administration, Historical Trends (since 2023) and Forecasted Estimates (till 2035) (USD Million)
- Figure 23.1 Novel Antibody Therapies Market: Distribution by Key Geographical Regions
- Figure 23.2 Novel Antibody Therapies Market in North America, Historical Trends (since 2023) and Forecasted Estimates (till 2035) (USD Million)
- Figure 23.3 Novel Antibody Therapies Market in the US, Historical Trends (since 2023) and Forecasted Estimates (till 2035) (USD Million)
- Figure 23.4 Novel Antibody Therapies Market in Canada, Historical Trends (since 2023) and Forecasted Estimates (till 2035) (USD Million)
- Figure 23.5 Novel Antibody Therapies Market in Europe, Historical Trends (since 2023) and Forecasted Estimates (till 2035) (USD Million)
- Figure 23.6 Novel Antibody Therapies Market in Germany, Historical Trends (since 2023) and Forecasted Estimates (till 2035) (USD Million)
- Figure 23.7 Novel Antibody Therapies Market in the UK, Historical Trends (since 2023) and Forecasted Estimates (till 2035) (USD Million)
- Figure 23.8 Novel Antibody Therapies Market in France, Historical Trends (since 2023) and Forecasted Estimates (till 2035) (USD Million)
- Figure 23.9 Novel Antibody Therapies Market in Italy, Historical Trends (since 2023) and Forecasted Estimates (till 2035) (USD Million)
- Figure 23.10 Novel Antibody Therapies Market in Spain, Historical Trends (since 2023) and Forecasted Estimates (till 2035) (USD Million)
- Figure 23.11 Novel Antibody Therapies Market in Asia-Pacific, Historical Trends (since 2023) and Forecasted Estimates (till 2035) (USD Million)
- Figure 23.12 Novel Antibody Therapies Market in China, Historical Trends (since 2023) and Forecasted Estimates (till 2035) (USD Million)
- Figure 23.13 Novel Antibody Therapies Market in Japan, Historical Trends (since 2023) and Forecasted Estimates (till 2035) (USD Million)
- Figure 23.14 Novel Antibody Therapies Market in Australia, Historical Trends (since 2023) and Forecasted Estimates (till 2035) (USD Million)
- Figure 23.15 Novel Antibody Therapies Market in New Zealand, Historical Trends (since 2023) and Forecasted Estimates (till 2035) (USD Million)
- Figure 23.16 Novel Antibody Therapies Market in Middle East and Africa, Historical Trends (since 2023) and Forecasted Estimates (till 2035) (USD Million)
- Figure 23.17 Novel Antibody Therapies Market in Egypt, Historical Trends (since 2023) and Forecasted Estimates (till 2035) (USD Million)
- Figure 23.18 Novel Antibody Therapies Market in South Africa, Historical Trends (since 2023) and Forecasted Estimates (till 2035) (USD Million)
- Figure 23.19 Novel Antibody Therapies Market in Iraq, Historical Trends (since 2023) and Forecasted Estimates (till 2035) (USD Million)
- Figure 23.20 Novel Antibody Therapies Market in Morocco, Historical Trends (since 2023) and Forecasted Estimates (till 2035) (USD Million)
- Figure 23.21 Penetration Growth (P-G) Matrix: Key Geographical Regions
- Figure 23.22 Market Movement Analysis: Key Geographical Regions
- Figure 24.1 Novel Antibody Therapies Market: Distribution by Leading Players, Current Year (based on sales of therapies)
- Figure 24.2 Novel Antibody Therapies Market: Distribution by Leading Players, 2035 (based on sales of therapies)
 对双特异性抗体药物复合体(BsADCs)的全球临床试验、监管核准、开发平台和市场机会的洞察(2026 年)
 抗CD4抗体市场报告:趋势、预测和竞争分析(至2035年)
 抗体鸡尾酒疗法市场:按类型、适应症、分销管道和地区划分
 FC 和糖基工程抗体市场分析及预测至 2035 年:按类型、产品类型、服务、技术、应用、最终用户、製程、功能、安装类型、模式抗体市场分析及预测(至2035年):类型、产品类型、服务、技术、应用、最终用户、形式、製程、功能、组件新一代抗体疗法市场分析及预测(至2035年):按类型、产品类型、技术、应用、製程、最终用户、开发阶段、实施类型、功能和模式划分全球HER2抗体市场规模、份额、趋势和成长分析报告(2026-2034年)
 抗体介导的排斥反应市场-全球、区域和国家层面的分析与预测(2025-2035 年)
 FAP抗体市场按产品类型、技术、应用、最终用户和分销管道划分,全球预测(2026-2032年)内参抗体市场按产品类型、技术、应用、最终用户和分销管道划分-2026-2032年全球预测