


 |
市场调查报告书
商品编码
1891249
外骨骼市场:产业趋势及全球预测(至 2035 年)-依身体部位、运动模式、外骨骼形态、移动性别及主要地区划分Exoskeleton Market: Industry Trends and Global Forecasts, Till 2035 Distribution by Body Part Covered, Mode of Operation, Form of Exoskeleton, Mobility and Key Geographical Regions |
||||||
外骨骼市场:概述
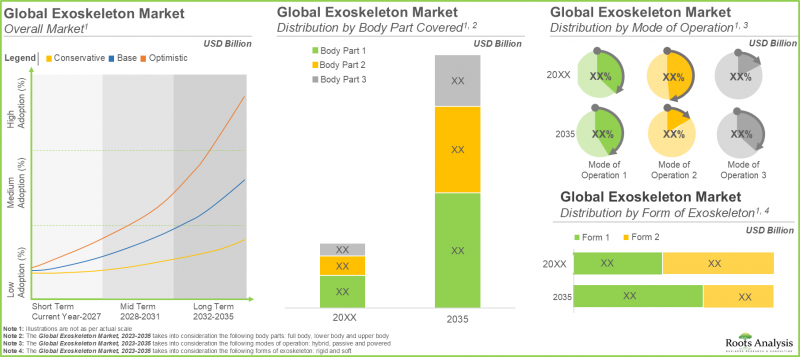
全球外骨骼市场预计将以 22.4% 的复合年增长率成长,从目前的 29 亿美元成长至 2035 年的 203 亿美元。
市场规模与机会分析依下列参数划分:
目标身体部位:
- 上肢
- 下肢
- 全身
操作方式模式:
- 动力型
- 被动型
- 混合型
形式:
- 动力型
- 非动力型
- 混合型
移动性
- 固定/支撑
- 移动型
最终使用者
- 患者
- 医疗保健提供者
主要地区
- 北美
- 欧洲
- 亚太地区
- 世界其他地区
医用外骨骼市场:成长与趋势
近年来,机器人技术取得了显着进步,提高了外骨骼在各个领域辅助和支持人类的实用性。尤其是在医疗领域,外骨骼展现出巨大的潜力,能够为病人和医护人员提供支持。然而,儘管经过数十年的研究,并拥有众多潜在应用,但由于其他移动辅助系统和义肢设备的竞争,外骨骼尚未成为利益相关者的主流选择,这些设备在临床和家庭环境中也经常使用。
在医疗领域,外骨骼主要用于脊髓损伤(SCI)、中风、神经系统疾病或老年相关残疾患者的復健、步态训练和移动辅助。此外,亚太地区等地区的人口结构变化正在推动对改善移动性和老年护理的需求。据报道,在美国一家诊所,外骨骼使復健效果提高了23%。
为了确保外骨骼的广泛应用,开发人员正致力于设计满足实际需求的外骨骼。为了解决成本效益和舒适度等问题,他们正在积极探索创新方法,旨在创造更自然、更贴合人体的 "第二层皮肤" 解决方案,而不是笨重的机器人外骨骼。 此外,目前正在努力将人工智慧 (AI) 和机器学习融入人机互动中,使设备能够透过适当的控制演算法识别使用者意图。同时,利用虚拟实境 (VR)、扩增实境 (AR)、客製化游戏或这些技术的组合进行创新,旨在透过提高患者参与度和保持其持续完成指定练习的积极性来改进机器人辅助治疗。随着技术的进步和该领域的持续发展,外骨骼有望在未来几年拥有巨大的潜力。
外骨骼市场:关键洞察
本报告深入分析了当前外骨骼市场的现状,并指出了该行业的潜在成长机会。主要发现包括:
- 目前已有超过 200 种外骨骼产品上市或正在研发中,旨在帮助行动不便的患者,并降低护理人员在照顾这些患者时发生肌肉骨骼损伤的风险。
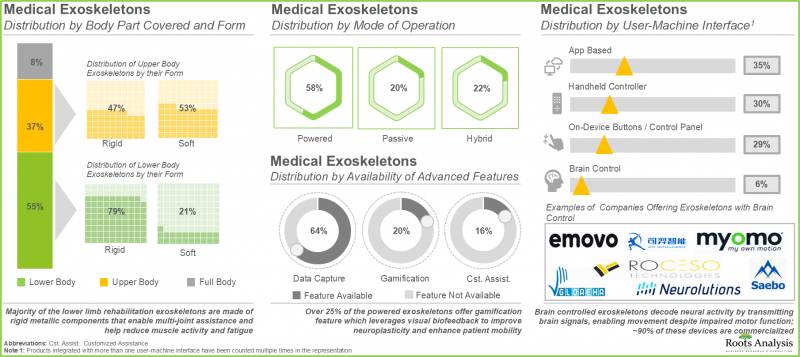
- 超过100种医用外骨骼(包括刚性和软性)覆盖身体的各个部位,通常由电池供电,为感测器和执行器供电。其中超过60%的外骨骼能够捕捉患者的运动数据。
- 医用外骨骼的开发商遍布全球,其中超过40%位于欧洲,主要集中在德国和瑞士等国家。
- 由于患者对医用外骨骼的需求不断增长,该领域已建立了多个策略合作伙伴关係。其中大部分合作伙伴关係(26%)是分销协议。
- 医疗外骨骼开发商正致力于在其产品组合中融入先进功能,同时降低成本,旨在提高用户采纳率并最大化投资回报率 (ROI)。
- 自 2016 年以来,已有约 3800 项与外骨骼相关的专利申请和授权,这表明该领域的研究人员付出了巨大的努力。
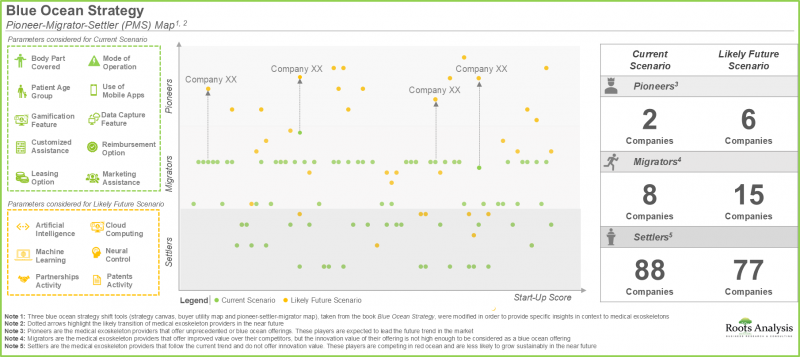
- 蓝海策略分析中的 "先锋-迁移者-先锋" 模式表明,未来几年,一些专注于提升产品功能的医疗外骨骼开发商有望成为行业先锋。
- 预计到2035年,主要用于为肌肉无力和完全或部分截瘫患者提供下肢支撑的刚性外骨骼的销售额将占外骨骼市场的约80%。
医用外骨骼市场:主要细分市场
目前,下肢外骨骼细分市场在医用外骨骼市场中占最大占有率。
根据目标身体部位,市场可细分为上肢外骨骼、下肢外骨骼及全身外骨骼。目前,下肢外骨骼细分市场在医用外骨骼市场中占最大占有率。这主要是由于下肢外骨骼价格较高,以及提供下肢医用外骨骼的公司数量不断增加。 值得注意的是,全身医用外骨骼市场预计将以更高的复合年增长率成长。
在预测期内,被动式外骨骼细分市场将是外骨骼市场中成长最快的细分市场。
依运作模式划分,市场可分为动力外骨骼、被动式外骨骼及混合式外骨骼。预计被动式外骨骼细分市场在整个预测期内将以相对较快的速度成长。这是因为它们无需驱动器或电池即可提供必要的符合人体工学的支撑,从而降低了用户的初始成本和维护成本。然而,目前动力医用外骨骼细分市场占了医用外骨骼市场的最大占有率。 这一趋势在短期内不太可能改变。
目前,刚性外骨骼在医用外骨骼市场中占最大占有率。
依类型划分,市场分为刚性外骨骼和柔性外骨骼。由于其广泛应用,刚性外骨骼在医用外骨骼市场中占主导地位。但值得注意的是,柔性外骨骼市场可望以相对较高的复合年增长率成长。
目前,移动式医用外骨骼在医用外骨骼市场中占最大占有率。
就移动性而言,市场分为固定式外骨骼和移动式外骨骼。值得注意的是,移动式/地面行走式医用外骨骼目前在医用外骨骼市场中占更大的占有率。 这是因为外骨骼能够帮助患者参与恢復功能独立性所需的活动,例如站立、爬楼梯和行走。此外,移动式外骨骼可在多种环境中使用,包括门诊诊所、家庭和公共场所,使患者能够在传统医疗机构之外继续进行復健治疗。
目前,面向患者的外骨骼预计将占医疗外骨骼市场最大的占有率。
依最终用户划分,市场分为患者和医疗保健专业人员。值得注意的是,面向患者的外骨骼占了现有医疗外骨骼市场的大部分占有率。
北美占最大的市占率。
依主要地区划分,市场分为北美、欧洲、亚太地区及世界其他地区。值得注意的是,预计未来几年世界其他地区的复合年增长率将更高。
外骨骼市场代表性公司
- Bionic Yantra
- CYBERDYNE
- Ekso Bionics
- ExoAtlet
- Fourier Intelligence
- Gloreha
- 广州益康医疗器械
- Hexar Humancare
- Hocoma
- MediTouch
- Milebot Robotics
- Myomo
- Neofect
- NextStep Robotics
- Panasonic
- ReWalk Robotics
- Rex Bionics
- Roam Robotics
- Trexo Robotics
- Tyromotion
- U&O Technologies
主要研究概述
本研究中提出的观点和见解是透过与多位利害关係人的讨论而形成的。 本研究报告包含对以下行业专业人士的详细访谈:
- A公司联合创办人兼首席执行官
- B公司业务规划与发展总监
- C公司销售与行销副总裁
- D公司行销与设计总监
- E公司创办人兼董事
医用外骨骼市场:研究范围
- 市场规模与机会分析:本报告对医用外骨骼市场进行了详细分析,重点关注以下关键细分市场:[A] 目标身体部位,[B] 操作模式,[C] 移动性,[D] 最终用户,以及 [F] 主要地区。
- 市场概况:本报告对医用外骨骼设备进行了全面评估,内容涵盖[A]研发现状、[B]目标身体部位、[C]操作模式、[D]外骨骼形态、[E]设备移动性、[F]人机界面、[G]外骨骼高级功能、[H]最终用户、[I]患者人口统计特征、[JK]患者人口统计特征、[JK]。本部分还包括以下资讯:[L]外骨骼技术/软体、[M]外骨骼最大重量、[N]最大承重能力以及[O]外骨骼尺寸。 本章还列出了参与医疗外骨骼开发和商业化的主要公司,并根据以下指标重点介绍了最活跃的公司:[P] 成立年份,[Q] 公司规模,[R] 总部所在地,[S] 公司所有权,[T] 提供的附加服务,以及 [U] 提供的医疗外骨骼数量。
- 产品竞争力:对医疗外骨骼进行全面的竞争分析,具体包括:[A] 供应商优势,[B] 产品竞争力,以及 [C] 最终用户。我们将考虑以下因素:
- 公司简介(详细简介):提供医疗外骨骼的主要公司的详细简介。重点关注:[A] 公司概况,[B] 财务资讯(如有),[C] 产品组合,[D] 近期发展,以及 [E] 未来展望。
- 公司简介(表格):提供医疗外骨骼的主要公司的简要概述。主要关注:[A] 公司概况和 [B] 产品组合。
- 合作伙伴关係:我们将根据以下参数分析自 2017 年以来该领域达成的合作伙伴关係:[A] 合作年份,[B] 合作类型(併购、产品开发和商业化协议、许可协议、服务协议、产品开发和製造协议、合资企业、製造和供应协议、产品分销协议),[C] 合作伙伴(本节也涵盖了该市场合作活动的区域分布。
- 专利分析:基于[A]专利类型、[B]专利申请年份、[C]专利公开年份、[D]地理位置、[E]申请人类型、[F]公开时间、[G]主要CPC分类号和[H]主要公司(基于专利申请/授权数量)对各类专利申请/授权註册进行详细分析,并[I]提供详细的专利基准分析。
- 蓝海策略:基于蓝海策略对当前和未来市场进行全面分析。为新兴医疗外骨骼公司提供全面的策略计画/指南,帮助其开拓未开发的市场。重点介绍了13种策略工具,可协助其转型进入蓝海市场,从而获得市场竞争优势。
- 市场影响分析:本报告分析影响市场成长的各种因素,包括驱动因素、限制因素、机会与挑战。
目录
第一章:引言
第二章:研究方法
第三章:经济及其他专案特定考量
- 章节概述
- 市场动态
第四章:摘要整理
第五章:导论
- 章节概述
- 外骨骼概述
- 外骨骼发展史
- 外骨骼分类
- 外骨骼特性
- 外骨骼局限性
- 外骨骼应用
- 未来展望外骨骼
第六章 医用外骨骼:市场概况
- 章节概述
- 医用外骨骼:市场概况
- 医用外骨骼:开发商概况
第七章 非医用外骨骼:市场概况
- 章节概述
- 非医用外骨骼:市场概况
- 非医用外骨骼:开发商概况
第八章 医用外骨骼:产品竞争分析
- 章节概述
- 假设和关键参数
- 研究方法
- 医用外骨骼:产品竞争分析
第九章外骨骼开发商:公司简介
- 章节概述
- CYBERDYNE
- Ekso Bionics
- ExoAtlet
- Fourier Intelligence
- Gloreha
- 广州益康
- Hexar Humancare
- Hocoma
- Panasonic
- Tyromotion
第十章 外骨骼开发商:公司简介
- 章节概述
- Bionic Yantra
- MediTouch
- Milebot Robotics
- Myomo
- Neofect
- NextStep机器人
- ReWalk Robotics
- Rex Bionics
- Roam Robotics
- Trexo Robotics
- U&O Technologies
第11章 医疗外骨骼:合作与伙伴关係
- 章节概述
- 合作模式
- 医疗外骨骼:合作与伙伴关係列表
第12章:专利分析
第13章:蓝海战略
- 蓝海策略概述
第14章:市场影响分析:驱动因素、限制因素、机会与挑战
章节第15章:全球外骨骼市场
第16章:依身体部位划分的外骨骼市场
第17章:依运动模式划分的外骨骼市场
第18章:依形态划分的外骨骼市场
第19章:依性别划分的外骨骼市场
第20章:依最终使用者划分的外骨骼市场
第21章:按地区划分的外骨骼市场
第22章:结论
第23章:高阶主管洞察
第24章:附录一:蓝海策略与转型工具
- 章节概述
- 蓝海策略及转型工具
- 蓝海策略流程
第25章:附录二:表格资料
第26章:附录三:公司及组织列表
Exoskeleton Market: Overview
As per Roots Analysis, the global exoskeleton market is estimated to grow from USD 2.9 billion in the current year to USD 20.3 billion by 2035, at a CAGR of 22.4% during the forecast period, till 2035.
The market sizing and opportunity analysis has been segmented across the following parameters:
Body Part Covered:
- Upper Extremity
- Lower Extremity
- Full Body
Mode of Operation:
- Powered
- Passive
- Hybrid
Form:
- Powered
- Passive
- Hybrid
Mobility
- Fixed / Supported
- Mobile
End Users
- Patients
- Healthcare Providers
Key Geographical Regions
- North America
- Europe
- Asia-Pacific
- Rest of the World
Medical Exoskeleton Market: Growth and Trends
Over the years, significant advancements have occurred in robotic technologies, leading to enhanced usability of exoskeletons across different sectors for aiding and supporting humans. Especially in healthcare, these devices have demonstrated significant potential in aiding both patients and medical professionals. It is important to mention that even after decades of study and numerous possible applications, exoskeletons have not become the favored choice for stakeholders because of competition from other mobility systems and prosthetic devices often used in clinical and domestic environments.
Exoskeletons in healthcare mainly support rehabilitation, gait training, and mobility for those with spinal cord injuries (SCI), strokes, neurological conditions, or age-related disabilities. Further, demographic changes, especially in areas such as Asia-Pacific, heighten the demand for mobility improvements and elder care, with exoskeletons boosting rehabilitation results by 23% in motor function recovery at certain US clinics.
To ensure widespread approval, developers are concentrating on meeting real needs with their exoskeleton designs. They are actively seeking innovations to address issues related to cost-efficiency and user discomfort, striving to turn exoskeletons into more organic and integrated second skin solutions instead of cumbersome robotic suits. Additionally, developers are incorporating artificial intelligence and machine learning to allow devices to recognize the user's intentions and enhance human-robot interactions via suitable control algorithms. Moreover, innovations such as virtual reality (VR), augmented reality (AR), tailored games, or a mix of these methods are being implemented to improve robotic therapy by boosting patient involvement and ensuring they stay dedicated to completing their assigned exercises. Due to technological progress and continual developments in this area, exoskeleton devices are expected to have significant potential in the years to come.
Exoskeleton Market: Key Insights
The report delves into the current state of the exoskeleton market and identifies potential growth opportunities within the industry. Some key findings from the report include:
- Presently, over 200 exoskeletons are available / under development to provide support to patients with mobility impairments or reduce the risk of musculoskeletal injuries among caregivers dealing with disabled patients.
- Over 100 medical exoskeletons, both rigid and soft, cover different parts of the body and are typically operated using batteries that power the sensors and actuators; over 60% of them capture the motion metrics of patients.
- Developers of medical exoskeletons have established a global presence; more than 40% of these players are based in Europe, primarily in countries, such as Germany and Switzerland.
- With the growing demand for medical exoskeletons amongst patients, several types of strategic deals have been inked in this domain; majority (26%) of partnerships signed were distribution agreements.
- In order to increase adoption rates and maximize return on investment (ROI) for the users, developers of medical exoskeletons are striving to reduce costs while incorporating advanced features into their portfolio of devices.
- Nearly 3,800 patents related to exoskeletons have been filed / granted since 2016, indicating the substantial efforts made by researchers engaged in this domain.
- The pioneer-migrator-settler map in blue ocean strategy analysis suggests that several medical exoskeleton developers focused on enhancing their product features are likely to emerge as pioneers in the coming years.
- In 2035, nearly 80% of the exoskeleton market is likely to be driven by the sales of rigid exoskeletons primarily supporting the lower body, in patients with muscle weaknesses or complete / partial paraplegia.
Medical Exoskeleton Market: Key Segments
Currently, Lower Body Exoskeleton Segment Occupies the Largest Share of the Medical Exoskeleton Market
In terms of the body part covered, the market is segmented into upper body exoskeletons, lower body exoskeletons and full body exoskeletons. At present, the lower body exoskeleton segment holds the maximum share of the medical exoskeleton market. This is due to the steep price of lower body exoskeletons and an increase in the number of companies providing lower body medical exoskeletons. It is worth highlighting that the exoskeleton market for full body medical exoskeletons is anticipated to grow at a higher CAGR.
Passive Exoskeletons Segment is the Fastest Growing Segment of the Exoskeleton Market During the Forecast Period
In terms of the mode of operation, the market is segmented into powered exoskeletons, passive exoskeletons and hybrid exoskeletons. The passive exoskeletons segment is expected to expand at a comparatively faster growth rate throughout the forecast period. This is due to the devices offering necessary ergonomic assistance without requiring actuators or batteries, resulting in decreased initial costs and lower maintenance expenses for the users. However, currently, the powered medical exoskeleton segment holds the maximum share of the medical exoskeleton market. This trend is unlikely to change in the near future.
Currently, Rigid Exoskeletons Segment Occupies the Largest Share of the Medical Exoskeleton Market
In terms of their form, the market is segmented into rigid exoskeletons and soft exoskeletons. Due to their extensive use, rigid exoskeletons dominate the medical exoskeleton market. It is worth noting that soft exoskeletons segment is likely to grow at a relatively higher CAGR.
Currently, Mobile Medical Exoskeletons Occupy the Largest Share of the Medical Exoskeleton Market
In terms of mobility, the market is segmented into stationary exoskeletons and mobile exoskeletons. It is worth highlighting that, at present, mobile / overground walking medical exoskeleton holds a larger share of the medical exoskeleton market. This is owing to the fact that exoskeletons enable patients to engage in activities such as standing, climbing stairs, or walking, which are vital for restoring functional independence. Moreover, mobile exoskeletons can be utilized in different settings, such as outpatient clinics, residential areas, and communal spaces, allowing patients to pursue their rehabilitation beyond conventional healthcare environments.
Currently, Patient-Focused Exoskeletons are Expected to Capture the Largest Share of the Medical Exoskeleton Market
In terms of the end-user, the market is segmented into patients and healthcare professionals. It is important to note that a significant share of the existing medical exoskeleton market is dominated by patient-oriented exoskeletons.
North America Accounts for the Largest Share of the Market
Based on key geographical regions, the market is segmented into North America, Europe, Asia-Pacific and Rest of the world. It is worth highlighting that, over the years, the market in the rest of the world is expected to grow at a higher CAGR.
Example Players in the Exoskeleton Market
- Bionic Yantra
- CYBERDYNE
- Ekso Bionics
- ExoAtlet
- Fourier Intelligence
- Gloreha
- Guangzhou Yikang Medical Equipment
- Hexar Humancare
- Hocoma
- MediTouch
- Milebot Robotics
- Myomo
- Neofect
- NextStep Robotics
- Panasonic
- ReWalk Robotics
- Rex Bionics
- Roam Robotics
- Trexo Robotics
- Tyromotion
- U&O Technologies
Primary Research Overview
The opinions and insights presented in this study were influenced by discussions conducted with multiple stakeholders. The research report features detailed transcripts of interviews held with the following industry stakeholders:
- Co-Founder and Chief Executive Officer, Company A
- Director of Business Planning and Development, Company B
- Vice President of Sales and Marketing, Company C
- Marketing and Design Manager, Company D
- Founder and Director, Company E
Medical Exoskeleton Market: Research Coverage
- Market Sizing and Opportunity Analysis: The report features an in-depth analysis of the exoskeleton market, focusing on key market segments, including [A] body part covered, [B] mode of operation, [C] mobility, [D] end users and [F] key geographical regions.
- Market Landscape: A comprehensive evaluation of medical exoskeletons, considering various parameters, such as [A] status of development, [B] body part covered, [C] mode of operation, [D] form of exoskeleton, [E] device mobility, [F] user-machine interface, [G] advanced features of exoskeleton, [H] end users, [I] patient age group, [J] exoskeleton setting for patients and [K] grant of breakthrough device designation. Additionally, it includes information on [L] exoskeleton technology / software, [M] maximum weight of exoskeleton, [N] maximum weight carrying capacity and [O] exoskeleton dimensions. Further, the chapter presents a list of players engaged in the development / commercialization of medical exoskeletons, along with information on their [P] year of establishment, [Q] company size, [R] location of headquarters, [S] company ownership, [T] additional services offered and [U] most active companies (in terms of number of medical exoskeleton offered).
- Product Competitiveness: A comprehensive competitive analysis of medical exoskeletons, examining factors, such as [A] supplier strength, [B] product competitiveness and [C] end users.
- Company Profiles (Detailed Profiles): In-depth profiles of key players offering medical exoskeletons, focusing on [A] company overviews, [B] financial information (if available), [C] product portfolio, [D] recent developments and [E] an informed future outlook.
- Company Profiles (Tabulated Profiles): Short profiles of key players offering medical exoskeletons, focusing on [A] company overviews and [B] product portfolio.
- Partnerships and Collaborations: An analysis of partnerships established in this sector, since 2017, based on several parameters, such as [A] year of partnership, [B] type of partnership (mergers and acquisitions, product development and commercialization agreements, licensing agreements, service agreements, product development and manufacturing agreements, joint ventures, manufacturing and supply agreements, and product distribution agreements), [C] type of partner (industry and non-industry), [D] business globalization and [E] most active players. This section also highlights the regional distribution of partnership activity in this market.
- Patent Analysis: Detailed analysis of various patents filed / granted based on [A] type of patent, [B] patent application year, [C] patent publication year, [D] geographical location, [E] type of applicant, [F] publication time, [G] top CPC symbols, [H] leading players (in terms of number of patents filed / granted), along with [I] a detailed patent benchmarking analysis.
- Blue Ocean Strategy: A comprehensive analysis of current and future market based on blue ocean strategy, covering a strategic plan / guide for emerging medical exoskeleton companies to help unlock an uncontested market, highlighting thirteen strategic tools that can help to shift towards blue ocean to gain a competitive edge in the market.
- Market Impact Analysis: The report analyzes various factors such as drivers, restraints, opportunities, and challenges affecting market growth.
Key Questions Answered in this Report
- How many companies are currently engaged in this market?
- What factors are likely to influence the evolution of this market?
- What is the current and future market size?
- What is the CAGR of this market?
- How is the current and future market opportunity likely to be distributed across key market segments?
Reasons to Buy this Report
- The report provides a comprehensive market analysis, offering detailed revenue projections of the overall market and its specific sub-segments. This information is valuable to both established market leaders and emerging entrants.
- Stakeholders can leverage the report to gain a deeper understanding of the competitive dynamics within the market. By analyzing the competitive landscape, businesses can make informed decisions to optimize their market positioning and develop effective go-to-market strategies.
- The report offers stakeholders a comprehensive overview of the market, including key drivers, barriers, opportunities, and challenges. This information empowers stakeholders to stay abreast of market trends and make data-driven decisions to capitalize on growth prospects.
Additional Benefits
- Complimentary PPT Insights Packs
- Complimentary Excel Data Packs for all Analytical Modules in the Report
- 15% Free Content Customization
- Detailed Report Walkthrough Session with Research Team
- Free Updated report if the report is 6-12 months old or older
TABLE OF CONTENTS
1. PREFACE
- 1.1. Introduction
- 1.2. Key Market Insights
- 1.3. Scope of the Report
- 1.4. Research Methodology
- 1.5. Key Questions Answered
- 1.6. Chapter Outlines
2. RESEARCH METHODOLOGY
- 2.1. Chapter Overview
- 2.2. Research Assumptions
- 2.3. Project Methodology
- 2.4. Forecast Methodology
- 2.5. Robust Quality Control
- 2.6. Key Market Segmentations
- 2.7. Key Considerations
- 2.7.1. Demographics
- 2.7.2. Economic Factors
- 2.7.3. Government Regulations
- 2.7.4. Supply Chain
- 2.7.5. COVID Impact / Related Factors
- 2.7.6. Market Access
- 2.7.7. Healthcare Policies
- 2.7.8. Industry Consolidation
3. ECONOMIC AND OTHER PROJECT SPECIFIC CONSIDERATIONS
- 3.1. Chapter Overview
- 3.2. Market Dynamics
- 3.2.1. Time Period
- 3.2.1.1. Historical Trends
- 3.2.1.2. Current and Forecasted Estimates
- 3.2.2. Currency Coverage
- 3.2.2.1. Overview of Major Currencies Affecting the Market
- 3.2.2.2. Impact of Currency Fluctuations on the Industry
- 3.2.3. Foreign Exchange Impact
- 3.2.3.1. Evaluation of Foreign Exchange Rates and Their Impact on Market
- 3.2.3.2. Strategies for Mitigating Foreign Exchange Risk
- 3.2.4. Recession
- 3.2.4.1. Historical Analysis of Past Recessions and Lessons Learnt
- 3.2.4.2. Assessment of Current Economic Conditions and Potential Impact on the Market
- 3.2.5. Inflation
- 3.2.5.1. Measurement and Analysis of Inflationary Pressures in the Economy
- 3.2.5.2. Potential Impact of Inflation on the Market Evolution
- 3.2.1. Time Period
4. EXECUTIVE SUMMARY
5. INTRODUCTION
- 5.1. Chapter Overview
- 5.2. Overview of Exoskeletons
- 5.3. History of Exoskeletons
- 5.4. Classification of Exoskeletons
- 5.4.1. Based on Body Part Supported
- 5.4.2. Based on Form of Exoskeleton
- 5.4.3. Based on Mode of Operation
- 5.4.4 Based on Mobility
- 5.5. Features of Exoskeletons
- 5.6. Limitations of Exoskeletons
- 5.7. Applications of Exoskeletons
- 5.8. Future Aspects of Exoskeletons
6. MEDICAL EXOSKELETONS: MARKET LANDSCAPE
- 6.1. Chapter Overview
- 6.2. Medical Exoskeletons: Overall Market Landscape
- 6.2.1. Analysis by Status of Development
- 6.2.2. Analysis by Type of Body Part Covered
- 6.2.3. Analysis by Mode of Operation
- 6.2.4. Analysis by Type of Body Part Covered and Mode of Operation
- 6.2.5. Analysis by Form of Exoskeleton
- 6.2.6. Analysis by Mode of Operation and Form of Exoskeleton
- 6.2.7. Analysis by Type of Body Part Covered and Form of Exoskeleton
- 6.2.8. Analysis by Device Mobility
- 6.2.9. Analysis by Mode of Operation and Device Mobility
- 6.2.10. Analysis by Form of Exoskeleton and Device Mobility
- 6.2.11. Analysis by Type of Body Part Covered and Device Mobility
- 6.2.12. Analysis by User-Machine Interface
- 6.2.13. Analysis by Type of Body Part Covered and User-Machine Interface
- 6.2.14. Analysis by Mode of Operation and User-Machine Interface
- 6.2.15. Analysis by Availability of Advanced Features
- 6.2.16. Analysis by End User
- 6.2.17. Analysis by Patient Age Group
- 6.2.18. Analysis by Exoskeleton Setting for Patients
- 6.2.19. Analysis by Breakthrough Designation
- 6.3. Medical Exoskeletons: Developer: Landscape
- 6.3.1. Analysis by Year of Establishment
- 6.3.2. Analysis by Company Size
- 6.3.3. Analysis by Location of Headquarters
- 6.3.4. Analysis by Company Size and Location of Headquarters (Region)
- 6.3.5. Analysis by Company Ownership
- 6.3.6. Analysis by Location of Headquarters (Region) and Company Ownership
- 6.3.7. Analysis by Additional Services Offered
- 6.3.8. Most Active Players: Analysis by Number of Medical Exoskeletons
7. NON-MEDICAL EXOSKELETONS: MARKET LANDSCAPE
- 7.1. Chapter Overview
- 7.2. Non-Medical Exoskeletons: Overall Market Landscape
- 7.2.1. Analysis by Status of Development
- 7.2.2. Analysis by Type of Body Part Covered
- 7.2.3. Analysis by Body Part Supported
- 7.2.4. Analysis by Mode of Operation
- 7.2.5. Analysis by Form of Exoskeleton
- 7.2.6. Analysis by Type of Body Part Covered and Mode of Operation
- 7.2.7. Analysis by Type of Body Part Covered and Form of Exoskeleton
- 7.2.8. Analysis by Mode of Operation and Form of Exoskeleton
- 7.2.9. Analysis by Application Area
- 7.2.10. Analysis by Mode of Operation and Application Area
- 7.3. Non-Medical Exoskeletons: Developer Landscape
- 7.3.1. Analysis by Year of Establishment
- 7.3.2. Analysis by Company Size
- 7.3.3. Analysis by Company Size and Employee Count
- 7.3.4. Analysis by Location of Headquarters
- 7.3.5. Analysis by Company Size and Location of Headquarters (Region)
- 7.3.6. Analysis by Company Ownership
- 7.3.7. Analysis by Location of Headquarters (Region) and Company Ownership
- 7.3.8. Most Active Players: Analysis by Number of Non-Medical Exoskeletons
- 7.3.9. Most Active Players: Analysis by Number of Exoskeletons
8. MEDICAL EXOSKELETONS: PRODUCT COMPETITIVENESS ANALYSIS
- 8.1. Chapter Overview
- 8.2. Assumptions and Key Parameters
- 8.3. Methodology
- 8.4. Medical Exoskeletons: Product Competitiveness Analysis
- 8.4.1. Product Competitiveness Analysis: Upper Body Medical Exoskeletons
- 8.4.1.1. Product Competitiveness Analysis: Powered Upper Body Exoskeletons
- 8.4.1.2. Product Competitiveness Analysis: Passive Upper Body Exoskeletons
- 8.4.1.3. Product Competitiveness Analysis: Hybrid Upper Body Exoskeletons
- 8.4.2. Product Competitiveness Analysis: Lower Body Exoskeletons
- 8.4.2.1. Product Competitiveness Analysis: Powered Lower Body Exoskeletons
- 8.4.2.2. Product Competitiveness Analysis: Passive Lower Body Exoskeletons
- 8.4.2.3. Product Competitiveness Analysis: Hybrid Lower Body Exoskeletons
- 8.4.3. Product Competitiveness Analysis: Full Body Medical Exoskeletons
- 8.4.1. Product Competitiveness Analysis: Upper Body Medical Exoskeletons
9. EXOSKELETON DEVELOPERS: DETAILED COMPANY PROFILES
- 9.1. Chapter Overview
- 9.2. CYBERDYNE
- 9.2.1. Company Overview
- 9.2.2. Financial Information
- 9.2.3. Product Portfolio
- 9.2.4 Recent Developments and Future Outlook
- 9.3. Ekso Bionics
- 9.3.1. Company Overview
- 9.3.2. Financial Information
- 9.3.3. Product Portfolio
- 9.3.4 Recent Developments and Future Outlook
- 9.4. ExoAtlet
- 9.4.1. Company Overview
- 9.4.2. Product Portfolio
- 9.4.3. Recent Developments and Future Outlook
- 9.5. Fourier Intelligence
- 9.5.1. Company Overview
- 9.5.2. Product Portfolio
- 9.5.3. Recent Developments and Future Outlook
- 9.6. Gloreha
- 9.6.1. Company Overview
- 9.6.2. Product Portfolio
- 9.6.3. Recent Developments and Future Outlook
- 9.7. Guangzhou Yikang
- 9.7.1. Company Overview
- 9.7.2. Product Portfolio
- 9.7.3. Recent Developments and Future Outlook
- 9.8. Hexar Humancare
- 9.8.1. Company Overview
- 9.8.2. Product Portfolio
- 9.8.3. Recent Developments and Future Outlook
- 9.9. Hocoma
- 9.9.1. Company Overview
- 9.9.2. Product Portfolio
- 9.9.3. Recent Developments and Future Outlook
- 9.10. Panasonic
- 9.10.1. Company Overview
- 9.10.2. Financial Information
- 9.10.3. Product Portfolio
- 9.10.4. Recent Developments and Future Outlook
- 9.11. Tyromotion
- 9.11.1. Company Overview
- 9.11.2. Product Portfolio
- 9.11.3. Recent Developments and Future Outlook
10. EXOSKELETON DEVELOPERS: TABULATED COMPANY PROFILES
- 10.1. Chapter Overview
- 10.2. Bionic Yantra
- 10.2.1. Company Overview
- 10.2.2. Product Portfolio
- 10.3. MediTouch
- 10.3.1. Company Overview
- 10.3.2. Product Portfolio
- 10.4. Milebot Robotics
- 10.4.1. Company Overview
- 10.4.2. Product Portfolio
- 10.5. Myomo
- 10.5.1. Company Overview
- 10.5.2. Product Portfolio
- 10.6. Neofect
- 10.6.1. Company Overview
- 10.6.2. Product Portfolio
- 10.7. NextStep Robotics
- 10.7.1. Company Overview
- 10.7.2. Product Portfolio
- 10.8. ReWalk Robotics
- 10.8.1. Company Overview
- 10.8.2. Product Portfolio
- 10.9. Rex Bionics
- 10.9.1. Company Overview
- 10.9.2. Product Portfolio
- 10.10. Roam Robotics
- 10.10.1. Company Overview
- 10.10.2. Product Portfolio
- 10.11. Trexo Robotics
- 10.11.1. Company Overview
- 10.11.2. Product Portfolio
- 10.12. U&O Technologies
- 10.12.1. Company Overview
- 10.12.2. Product Portfolio
11. MEDICAL EXOSKELETONS: PARTNERSHIPS AND COLLABORATIONS
- 11.1. Chapter Overview
- 11.2. Partnership Models
- 11.3. Medical Exoskeletons: List of Partnerships and Collaborations
- 11.3.1. Analysis by Year of Partnership
- 11.3.2. Analysis by Type of Partnership
- 11.3.3. Analysis by Year and Type of Partnership
- 11.3.4. Analysis by Purpose of Partnership
- 11.3.5. Analysis by Type and Purpose of Partnership
- 11.3.6. Analysis by Type of Partner
- 11.3.7. Analysis by Year of Partnership and Type of Partner
- 11.3.8. Analysis by Type of Non-Industry Players
- 11.3.9. Most Active Players: Distribution by Number of Partnerships
- 11.3.10. Analysis by Geography
- 11.3.10.1. Local and International Agreements
- 11.3.10.2. Intracontinental and Intercontinental Agreements
12. PATENT ANALYSIS
- 12.1. Chapter Overview
- 12.2. Scope and Methodology
- 12.3. Exoskeletons: Patent Analysis
- 12.3.1. Analysis by Patent Application Year
- 12.3.2. Analysis by Patent Publication Year
- 12.3.3. Analysis by Type of Patent and Patent Publication Year
- 12.3.4. Analysis by Publication Time
- 12.3.5. Analysis by Patent Jurisdiction
- 12.3.6. Analysis by CPC symbols
- 12.3.7. Analysis by Type of Applicant
- 12.3.8. Leading Industry Players: Analysis by Number of Patents
- 12.3.9. Leading Non-Industry Players: Analysis by Number of Patents
- 12.3.10. Leading Patent Assignees: Analysis by Number of Patents
- 12.4. Exoskeletons: Patent Benchmarking
- 12.4.1. Analysis by Patent Characteristics
- 12.4.2. Exoskeleton: Patent Valuation
- 12.5. Leading Players by Number of Citations
13. BLUE OCEAN STRATEGY
- 13.1. Overview of Blue Ocean Strategy
- 13.1.1. Red Oceans
- 13.1.2. Blue Oceans
- 13.1.3. Comparison of Red Ocean Strategy and Blue Ocean Strategy
- 13.1.4. Medical Exoskeletons: Blue Ocean Strategy and Shift Tools
- 13.1.4.1. Strategy Canvas
- 13.1.4.2. Pioneer-Migrator-Settler (PMS) Map
- 13.1.4.3. Buyer Utility Map
14. MARKET IMPACT ANALYSIS: DRIVERS, RESTRAINTS, OPPORTUNITIES AND CHALLENGES
- 14.1. Chapter Overview
- 14.2. Market Drivers
- 14.3. Market Restraints
- 14.4. Market Opportunities
- 14.5. Market Challenges
- 14.6. Conclusion
15. GLOBAL EXOSKELETONS MARKET
- 15.1. Chapter Overview
- 15.2. Forecast Methodology and Key Assumptions
- 15.3. Global Exoskeletons Market, Historical Trends (since 2018) and Forecasted Estimates (till 2035)
- 15.3.1. Scenario Analysis
- 15.3.1.1. Conservative Scenario
- 15.3.1.2. Optimistic Scenario
- 15.3.1. Scenario Analysis
- 15.4. Key Market Segmentations
16. EXOSKELETONS MARKET, BY BODY PART COVERED
- 16.1. Chapter Overview
- 16.2. Forecast Methodology and Key Assumptions
- 16.3. Overall Exoskeletons Market: Distribution by Body Part Covered
- 16.3.1. Overall Upper Body Exoskeletons: Historical Trends (since 2018) and Forecasted Estimates (till 2035)
- 16.3.2. Overall Lower Body Exoskeletons: Historical Trends (since 2018) and Forecasted Estimates (till 2035)
- 16.3.3. Overall Full Body Exoskeletons: Historical Trends (since 2018) and Forecasted Estimates (till 2035)
- 16.4. Medical Exoskeletons Market: Distribution by Body Part Covered
- 16.4.1 Medical Upper Body Exoskeletons: Historical Trends (since 2018) and Forecasted Estimates (till 2035)
- 16.4.2. Medical Lower Body Exoskeletons: Historical Trends (since 2018) and Forecasted Estimates (till 2035)
- 16.4.3. Medical Full Body Exoskeletons: Historical Trends (since 2018) and Forecasted Estimates (till 2035)
- 16.5. Non-Medical Exoskeletons Market: Distribution by Body Part Covered
- 16.5.1. Non-Medical Upper Body Exoskeletons: Historical Trends (since 2018) and Forecasted Estimates (till 2035)
- 16.5.2. Non-Medical Lower Body Exoskeletons: Historical Trends (since 2018) and Forecasted Estimates (till 2035)
- 16.5.3. Non-Medical Full Body Exoskeletons: Historical Trends (since 2018) and Forecasted Estimates (till 2035)
- 16.6. Data Triangulation and Validation
17. EXOSKELETONS MARKET, BY MODE OF OPERATION
- 17.1. Chapter Overview
- 17.2. Forecast Methodology and Key Assumptions
- 17.3. Overall Exoskeletons Market: Distribution by Mode of Operation
- 17.3.1. Overall Powered Exoskeletons Market: Historical Trends (since 2018) and Forecasted Estimates (till 2035)
- 17.3.2. Overall Passive Exoskeletons Market: Historical Trends (since 2018) and Forecasted Estimates (till 2035)
- 17.3.3. Overall Hybrid Exoskeletons Market: Historical Trends (since 2018) and Forecasted Estimates (till 2035)
- 17.4. Medical Exoskeletons Market: Distribution by Mode of Operation
- 17.4.1. Medical Powered Exoskeletons Market: Historical Trends (since 2018) and Forecasted Estimates (till 2035)
- 17.4.2. Medical Passive Exoskeletons Market: Historical Trends (since 2018) and Forecasted Estimates (till 2035)
- 17.4.3. Medical Hybrid Exoskeletons Market: Historical Trends (since 2018) and Forecasted Estimates (till 2035)
- 17.5. Non-Medical Exoskeletons Market: Distribution by Mode of Operation
- 17.5.1. Non-Medical Powered Exoskeletons Market: Historical Trends (since 2018) and Forecasted Estimates (till 2035)
- 17.5.2. Non-Medical Passive Exoskeletons Market: Historical Trends (since 2018) and Forecasted Estimates (till 2035)
- 17.5.3. Non-Medical Hybrid Exoskeletons Market: Historical Trends (since 2018) and Forecasted Estimates (till 2035)
- 17.6. Data Triangulation and Validation
18. EXOSKELETON MARKETS, BY THEIR FORM
- 18.1. Chapter Overview
- 18.2. Forecast Methodology and Key Assumptions
- 18.3. Overall Exoskeletons Market: Distribution by Form
- 18.3.1. Overall Rigid Exoskeletons: Historical Trends (since 2018) and Forecasted Estimates (till 2035)
- 18.3.2. Overall Soft Exoskeletons: Historical Trends (since 2018) and Forecasted Estimates (till 2035)
- 18.4. Medical Exoskeletons Market: Distribution by Form
- 18.4.1. Medical Rigid Exoskeletons: Historical Trends (since 2018) and Forecasted Estimates (till 2035)
- 18.4.2. Medical Soft Exoskeletons: Historical Trends (since 2018) and Forecasted Estimates (till 2035)
- 18.5. Non-Medical Exoskeletons Market: Distribution by Form
- 18.5.1. Non-Medical Rigid Exoskeletons: Historical Trends (since 2018) and Forecasted Estimates (till 2035)
- 18.5.2. Non-Medical Soft Exoskeletons: Historical Trends (since 2018) and Forecasted Estimates (till 2035)
- 18.6. Data Triangulation and Validation
19. EXOSKELETON MARKETS, BY THEIR MOBILITY
- 19.1. Chapter Overview
- 19.2. Forecast Methodology and Key Assumptions
- 19.3. Medical Exoskeletons Market: Distribution by Mobility
- 19.3.1. Medical Fixed/ Supported Exoskeleton: Historical Trends (since 2018) and Forecasted Estimates (till 2035)
- 19.3.2. Medical Mobile / Overground Walking Exoskeleton: Historical Trends (since 2018) and Forecasted Estimates (till 2035)
- 19.4. Data Triangulation and Validation
20. EXOSKELETONS MARKET, BY END USERS
- 20.1. Chapter Overview
- 20.2. Forecast Methodology and Key Assumptions
- 20.3. Overall Exoskeletons Market: Distribution by End Users
- 20.4. Exoskeletons Market for Patients: Historical Trends (since 2018) and Forecasted Estimates (till 2035)
- 20.5. Exoskeletons Market for Healthcare Providers: Historical Trends (since 2018) and Forecasted Estimates (till 2035)
- 20.6. Exoskeletons Market for Industry Workers: Historical Trends (since 2018) and Forecasted Estimates (till 2035)
- 20.7. Exoskeletons Market for Military Personnel: Historical Trends (since 2018) and Forecasted Estimates (till 2035)
- 20.8. Exoskeletons Market for Other End Users: Historical Trends (since 2018) and Forecasted Estimates (till 2035)
- 20.9. Data Triangulation and Validation
21. EXOSKELETONS MARKET, BY GEOGRAPHY
- 21.1. Chapter Overview
- 21.2. Forecast Methodology and Key Assumptions
- 21.3. Overall Exoskeletons Market: Distribution by Geography
- 21.3.1. North America, Historical Trends (since 2018) and Forecasted Estimates (till 2035)
- 21.3.2 Europe, Historical Trends (since 2018) and Forecasted Estimates (till 2035)
- 21.3.3. Asia-Pacific, Historical Trends (since 2018) and Forecasted Estimates (till 2035)
- 21.3.4. Rest of the World, Historical Trends (since 2018) and Forecasted Estimates (till 2035)
- 21.4. Data Triangulation and Validation
22. CONCLUSION
23. EXECUTIVE INSIGHTS
- 23.1. Chapter Overview
- 23.2. Company A
- 23.2.1. Company Snapshot
- 23.2.2. Interview Transcript: Co-Founder and Chief Executive Officer
- 23.3. Company B
- 23.3.1. Company Snapshot
- 23.3.2. Interview Transcript: Director of Business Planning and Development
- 23.4. Company C
- 23.4.1. Company Snapshot
- 23.4.2. Interview Transcript: Vice President of Sales and Marketing
- 23.5. Company D
- 23.5.1. Company Snapshot
- 23.5.2. Interview Transcript: Founder and Director
- 23.6. Company E
- 23.6.1. Company Snapshot
- 23.6.2. Interview Transcript: Marketing and Design Manager
24. APPENDIX I: BLUE OCEAN STRATEGY AND SHIFT TOOLS
- 24.1. Chapter Overview
- 24.2. Blue Ocean Strategy and Shift Tools
- 24.2.1. Value Innovation
- 24.2.2. Four Action Framework
- 24.2.3. Eliminate-Raise-Reduce-Create (ERRC) Grid
- 24.2.4. Six Path Framework
- 24.2.5. Three Tiers of Non-customers
- 24.3 Sequence of Blue Ocean Strategy
- 24.3.1. The Price Corridor of the Mass
- 24.3.2. Four Hurdles to Strategy Execution
- 24.3.3. Tipping Point Leadership
- 24.3.4. Fair Process
25. APPENDIX II: TABULATED DATA
26. APPENDIX III: LIST OF COMPANIES AND ORGANIZATION
List of Tables
- Table 5.1 Degrees of Freedom in Each Joint of Lower Exoskeletons
- Table 5.2 Contrasting Characteristics: Medical and Non-Medical Exoskeletons
- Table 5.3 Distinguishing Characteristics: Medical and Non-medical Exoskeletons
- Table 6.1 Medical Exoskeletons: Information on Status of Development, Type of Body Part Covered and Mode of Operation
- Table 6.2 Medical Exoskeletons: Information on Form, Device Mobility and User-Machine Interface
- Table 6.3 Medical Exoskeletons: Information on Advanced Features and End Users
- Table 6.4 Medical Exoskeletons: Information on Patient Age Group, Exoskeleton Setting for Patients and Breakthrough Designation
- Table 6.5 Medical Exoskeletons: Information on Technology / Software, Maximum Weight of Exoskeleton, Maximum Weight Carrying Capacity and Dimensions
- Table 6.6 Medical Exoskeletons: List of Developers
- Table 6.7 Medical Exoskeletons: Information on Additional Services Offered
- Table 7.1 Non-Medical Exoskeletons: Information on Status of Development, Type of Body Part Covered and Body Part Supported
- Table 7.2 Non-Medical Exoskeletons: Information on Mode of Operation and Form of Exoskeleton
- Table 7.3 Non-Medical Exoskeletons: Information on Application Area
- Table 7.4 Non-Medical Exoskeletons: Information on Technology / Software, Maximum Weight of Exoskeleton, Maximum Weight Carrying Capacity and Dimensions
- Table 7.5 Non-Medical Exoskeletons: List of Developers
- Table 9.1 List of Exoskeleton Companies Profiled
- Table 9.2 CYBERDYNE: Company Snapshot
- Table 9.3 CYBERDYNE: Medical Exoskeleton Portfolio
- Table 9.4 CYBERDYNE: Non-Medical Exoskeleton Portfolio
- Table 9.5 CYBERDYNE: Recent Developments and Future Outlook
- Table 9.6 Ekso Bionics: Company Snapshot
- Table 9.7 Ekso Bionics: Medical Exoskeleton Portfolio
- Table 9.8 Ekso Bionics: Non-Medical Exoskeleton Portfolio
- Table 9.9 Ekso Bionics: Recent Developments and Future Outlook
- Table 9.10 ExoAtlet: Company Snapshot
- Table 9.11 ExoAtlet: Medical Exoskeleton Portfolio
- Table 9.12 ExoAtlet: Non-Medical Exoskeleton Portfolio
- Table 9.13 ExoAtlet: Recent Developments and Future Outlook
- Table 9.14 Fourier Intelligence: Company Snapshot
- Table 9.15 Fourier Intelligence: Medical Exoskeleton Portfolio
- Table 9.16 Fourier Intelligence: Recent Developments and Future Outlook
- Table 9.17 Gloreha: Company Snapshot
- Table 9.18 Gloreha: Medical Exoskeleton Portfolio
- Table 9.19 Gloreha: Recent Developments and Future Outlook
- Table 9.20 Guangzhou YiKang: Company Snapshot
- Table 9.21 Guangzhou YiKang: Medical Exoskeleton Portfolio
- Table 9.22 Guangzhou YiKang: Recent Developments and Future Outlook
- Table 9.23 Hexar Humancare: Company Snapshot
- Table 9.24 Hexar Humancare: Medical Exoskeleton Portfolio
- Table 9.25 Hexar Humancare: Non-Medical Exoskeleton Portfolio
- Table 9.26 Hexar Humancare: Recent Developments and Future Outlook
- Table 9.27 Hocoma: Company Snapshot
- Table 9.28 Hocoma: Medical Exoskeleton Portfolio
- Table 9.29 Hocoma: Recent Developments and Future Outlook
- Table 9.30 Panasonic: Company Snapshot
- Table 9.31 Panasonic: Medical Exoskeleton Portfolio
- Table 9.32 Panasonic: Non-Medical Exoskeleton Portfolio
- Table 9.33 Panasonic: Recent Developments and Future Outlook
- Table 9.34 Tyromotion: Company Snapshot
- Table 9.35 Tyromotion: Medical Exoskeleton Portfolio
- Table 9.36 Tyromotion: Recent Developments and Future Outlook
- Table 10.1 Exoskeleton Developers: List of Companies Profiled
- Table 10.2 Bionic Yantra: Company Snapshot
- Table 10.3 Bionic Yantra: Medical Exoskeleton Portfolio
- Table 10.4 MediTouch: Company Snapshot
- Table 10.5 MediTouch: Medical Exoskeleton Portfolio
- Table 10.6 Milebot Robotics: Company Snapshot
- Table 10.7 Milebot Robotics: Medical Exoskeleton Portfolio
- Table 10.8 Milebot Robotics: Non- Medical Exoskeleton Portfolio
- Table 10.9 Myomo: Company Snapshot
- Table 10.10 Myomo: Medical Exoskeleton Portfolio
- Table 10.11 Neofect: Company Snapshot
- Table 10.12 Neofect: Medical Exoskeleton Portfolio
- Table 10.13 NextStep Robotics: Company Snapshot
- Table 10.14 NextStep Robotics: Medical Exoskeleton Portfolio
- Table 10.15 ReWalk Robotics: Company Snapshot
- Table 10.16 ReWalk Robotics: Medical Exoskeleton Portfolio
- Table 10.17 REX Bionics: Company Snapshot
- Table 10.18 REX Bionics: Medical Exoskeleton Portfolio
- Table 10.19 Roam Robotics: Company Snapshot
- Table 10.20 Roam Robotics: Medical Exoskeleton Portfolio
- Table 10.21 Roam Robotics: Non-Medical Exoskeleton Portfolio
- Table 10.22 Trexo Robotics: Company Snapshot
- Table 10.23 Trexo Robotics: Medical Exoskeleton Portfolio
- Table 10.24 U&O Technologies: Company Snapshot
- Table 10.25 U&O Technologies: Medical Exoskeleton Portfolio
- Table 11.1 Medical Exoskeletons: List of Partnerships and Collaborations, Since 2017
- Table 12.1 Patent Analysis: Top CPC Sections
- Table 12.2 Patent Analysis: Top CPC Symbols
- Table 12.3 Patent Analysis: Top CPC Codes
- Table 12.4 Patent Analysis: Summary of Benchmarking Analysis
- Table 12.5 Patent Analysis: Categorization based on Weighted Valuation Scores
- Table 12.6 Patent Portfolio: List of Leading Patents (by Highest Relative Valuation)
- Table 12.7 Patent Portfolio: List of Leading Patents (by Number of Citations)
- Table 15.1 Average Price of Powered Exoskeletons Used across Different Application Areas
- Table 16.1 Estimated Revenues of Medical Exoskeletons, based on Body Part Covered
- Table 16.2 Estimated Revenues of Non-Medical Exoskeletons, based on Body Part Covered
- Table 17.1 Estimated Revenues of Powered, Passive and Hybrid Exoskeletons from Various Application Areas
- Table 18.1 Estimated Revenues of Medical Exoskeletons, based on Form
- Table 18.2 Estimated Revenues of Non-Medical Exoskeletons, based on Form
- Table 19.1 Estimated Revenues of Medical Exoskeletons, based on Mobility
- Table 20.1 Estimated Revenues for Medical Exoskeletons from Various End Users
- Table 20.2 Estimated Revenues for Non-Medical Exoskeletons from Various End Users
- Table 23.1 ABLE Human Motion: Key Highlights
- Table 23.2 Archelis: Key Highlights
- Table 23.3 Biomotum: Key Highlights
- Table 23.4 Bionic Yantra: Key Highlights
- Table 23.5 Bionic Power: Key Highlights
- Table 25.1 Medical Exoskeletons: Distribution by Status of Development
- Table 25.2 Medical Exoskeletons: Distribution by Type of Body Part Covered
- Table 25.3 Medical Exoskeletons: Distribution by Mode of Operation
- Table 25.4 Medical Exoskeletons: Distribution by Type of Body Part Covered and Mode of Operation
- Table 25.5 Medical Exoskeletons: Distribution by Form of Exoskeleton
- Table 25.6 Medical Exoskeletons: Distribution by Mode of Operation and Form of Exoskeleton
- Table 25.7 Medical Exoskeletons: Distribution by Type of Body Part Covered and Form of Exoskeleton
- Table 25.8 Medical Exoskeletons: Distribution by Device Mobility
- Table 25.9 Medical Exoskeletons: Distribution by Mode of Operation and Device Mobility
- Table 25.10 Medical Exoskeletons: Distribution by Form of Exoskeleton and Device Mobility
- Table 25.11 Medical Exoskeletons: Distribution by Type of Body Part Covered and Device Mobility
- Table 25.12 Medical Exoskeletons: Distribution by User-Machine Interface
- Table 25.13 Medical Exoskeletons: Distribution by Type of Body Part Covered and User-Machine Interface
- Table 25.14 Medical Exoskeletons: Distribution by Mode of Operation and User-Machine Interface
- Table 25.15 Medical Exoskeletons: Distribution by Availability of Advanced Features
- Table 25.16 Medical Exoskeletons: Distribution by End User
- Table 25.17 Medical Exoskeletons: Distribution by Patient Age Group
- Table 25.18 Medical Exoskeletons: Distribution by Exoskeleton Setting for Patients
- Table 25.19 Medical Exoskeletons: Distribution by Breakthrough Designation
- Table 25.20 Medical Exoskeleton Developers: Distribution by Year of Establishment
- Table 25.21 Medical Exoskeleton Developers: Distribution by Company Size
- Table 25.22 Medical Exoskeleton Developers: Distribution by Company Size and Employee Count
- Table 25.23 Medical Exoskeleton Developers: Distribution by Location of Headquarters (Region)
- Table 25.24 Medical Exoskeleton Developers: Distribution by Location of Headquarters (Country)
- Table 25.25 Medical Exoskeleton Developers: Distribution by Company Size and Location of Headquarters
- Table 25.26 Medical Exoskeleton Developers: Distribution by Company Ownership
- Table 25.27 Medical Exoskeleton Developers: Distribution by Location of Headquarters and Company Ownership
- Table 25.28 Medical Exoskeleton Developers: Distribution by Additional Services Offered
- Table 25.29 Most Active Players: Distribution by Number of Medical Exoskeletons
- Table 25.30 Non-Medical Exoskeletons: Distribution by Status of Development
- Table 25.31 Non-Medical Exoskeletons: Distribution by Type of Body Part Covered
- Table 25.32 Non-Medical Exoskeletons: Distribution by Body Part Supported
- Table 25.33 Non-Medical Exoskeletons: Distribution by Mode of Operation
- Table 25.34 Non-Medical Exoskeletons: Distribution by Form of Exoskeleton
- Table 25.35 Non-Medical Exoskeletons: Distribution by Mode of Operation and Form of Exoskeleton
- Table 25.36 Non-Medical Exoskeletons: Distribution by Type of Body Part Covered and Mode of Operation
- Table 25.37 Non-Medical Exoskeletons: Distribution by Mode of Operation and Form of Exoskeleton
- Table 25.38 Non-Medical Exoskeletons: Distribution by Type of Body Part Covered and Form of Exoskeleton
- Table 25.39 Non-Medical Exoskeletons: Distribution by Application Area
- Table 25.40 Non-Medical Exoskeletons: Distribution by Mode of Operation and Application Area
- Table 25.41 Non-Medical Exoskeletons Developers: Distribution by Year of Establishment
- Table 25.42 Non-Medical Exoskeleton Developers: Distribution by Company Size
- Table 25.43 Non-Medical Exoskeleton Developers: Distribution by Company Size and Employee Count
- Table 25.44 Non-Medical Exoskeleton Developers: Distribution by Location of Headquarters (Region)
- Table 25.45 Non-Medical Exoskeleton Developers: Distribution by Location of Headquarters (Country)
- Table 25.46 Non-Medical Exoskeleton Developers: Distribution by Company Size and Location of Headquarters
- Table 25.47 Non-Medical Exoskeleton Developers: Distribution by Company Ownership
- Table 25.48 Non-Medical Exoskeleton Developers: Distribution by Location of Headquarters and Company Ownership
- Table 25.49 Most Active Players: Distribution by Number of Non-Medical Exoskeletons
- Table 25.50 Most Active Players: Distribution by Number of Medical and Non-Medical Exoskeletons
- Table 25.51 CYBERDYNE: Annual Revenues, Since FY2019 (JPY Billion)
- Table 25.52 CYBERDYNE: Distribution of Annual Revenues by Business Segment, Since FY 2021 (JPY Billion)
- Table 25.53 Ekso Bionics: Annual Revenues, Since 2018 (USD Billion)
- Table 25.54 Ekso Bionics: Distribution of Annual Revenues by Business Segment, FY 2023
- Table 25.55 Panasonic: Annual Revenues, FY 2018- FY 2023 (JPY Billion)
- Table 25.56 Partnerships and Collaborations: Cumulative Year-wise Trend, Since 2017
- Table 25.57 Partnerships and Collaborations: Distribution by Type of Partnership
- Table 25.58 Partnerships and Collaborations: Distribution by Year and Type of Partnership
- Table 25.59 Partnerships and Collaborations: Distribution by Purpose of Partnership
- Table 25.60 Partnerships and Collaborations: Distribution by Type and Purpose of Partnership
- Table 25.61 Partnerships and Collaborations: Distribution by Type of Partner
- Table 25.62 Partnerships and Collaborations: Distribution by Type of Partnership and Type of Partner
- Table 25.63 Partnerships and Collaborations: Type of Non-Industry Partner
- Table 25.64 Most Active Players: Distribution by Number of Partnerships
- Table 25.65 Partnerships and Collaborations: Local and International Agreements
- Table 25.66 Partnerships and Collaborations: Intracontinental and Intercontinental Agreements
- Table 25.67 Patent Analysis: Distribution by Type of Patent
- Table 25.68 Patent Analysis: Cumulative Year-wise Trend by Patent Application Year, Since 2016
- Table 25.69 Patent Analysis: Cumulative Year-wise Trend by Patent Publication Year, Since 2016
- Table 25.70 Patent Analysis: Distribution by Type of Patent and Patent Publication Year, Since 2016
- Table 25.71 Patent Analysis: Distribution by Publication Time
- Table 25.72 Patent Analysis: Distribution by Patent Jurisdiction (Region)
- Table 25.73 Patent Analysis: Distribution by Patent Jurisdiction (Country)
- Table 25.74 Patent Analysis: Distribution by Type of Applicant
- Table 25.75 Leading Industry Players: Distribution by Number of Patents
- Table 25.76 Leading Non-Industry Players: Distribution by Number of Patents
- Table 25.77 Leading Individual Assignees: Distribution by Number of Patents
- Table 25.78 Leading Industry Players: Benchmarking by Patent Characteristics (CPC Codes)
- Table 25.79 Leading Non-Industry Players: Benchmarking by Patent Characteristics (CPC Codes)
- Table 25.80 Patent Analysis: Distribution by Patent Age
- Table 25.81 Patent Analysis: Patent Valuation
- Table 25.82 Global Exoskeletons Market, Historical Trends (Since 2018) and Forecasted Estimates (Till 2035) (USD Billion)
- Table 25.83 Global Exoskeletons Market, Forecasted Estimates (Till 2035) Conservative Scenario (USD Billion)
- Table 25.84 Global Exoskeletons Market, Forecasted Estimates (Till 2035), Optimistic Scenario (USD Billion)
- Table 25.85 Medical Exoskeletons Market: Distribution by Body Part Covered (USD Billion)
- Table 25.86 Medical Upper Body Exoskeleton Market: Historical Trends (Since 2018) and Forecasted Estimates (Till 2035) (USD Billion)
- Table 25.87 Medical Lower Body Exoskeleton Market: Historical Trends (Since 2018) and Forecasted Estimates (Till 2035) (USD Billion)
- Table 25.88 Medical Full Body Exoskeleton Market: Historical Trends (Since 2018) and Forecasted Estimates (Till 2035) (USD Billion)
- Table 25.89 Non-Medical Upper Body Exoskeletons Market: Historical Trends (Since 2018) and Forecasted Estimates (Till 2035) (USD Billion)
- Table 25.90 Non-Medical Lower Body Exoskeleton Market: Historical Trends (Since 2018) and Forecasted Estimates (Till 2035) (USD Billion)
- Table 25.91 Non-Medical Full Body Exoskeleton Market Historical Trends (Since 2018) and Forecasted Estimates (Till 2035)
- Table 25.92 Overall Exoskeletons Market: Distribution by Body Part Covered (USD Billion)
- Table 25.93 Overall Upper Body Exoskeletons Market: Historical Trends (Since 2018) and Forecasted Estimates (Till 2035) (USD Billion)
- Table 25.94 Overall Lower Body Exoskeletons Market: Historical Trends (Since 2018) and Forecasted Estimates (Till 2035) (USD Billion)
- Table 25.95 Overall Full Body Exoskeletons Market: Historical Trends (Since 2018) and Forecasted Estimates (Till 2035) (USD Billion)
- Table 25.96 Medical Exoskeletons Market: Distribution by Mode of Operation (USD Billion)
- Table 25.97 Medical Powered Exoskeletons Market: Historical Trends (Since 2018) and Forecasted Estimates (Till 2035) (USD Billion)
- Table 25.98 Medical Passive Exoskeletons Market: Historical Trends (Since 2018) and Forecasted Estimates (Till 2035) (USD Billion)
- Table 25.99 Medical Hybrid Exoskeletons Market: Historical Trends (Since 2018) and Forecasted Estimates (Till 2035) (USD Billion)
- Table 25.100 Non-Medical Exoskeletons Market: Distribution by Mode of Operation (USD Billion)
- Table 25.101 Non-Medical Powered Exoskeletons Market: Historical Trends (Since 2018) and Forecasted Estimates (Till 2035) (USD Billion)
- Table 25.102 Non-Medical Passive Exoskeletons Market: Historical Trends (Since 2018) and Forecasted Estimates (Till 2035) (USD Billion)
- Table 25.103 Non-Medical Hybrid Exoskeletons Market: Historical Trends (Since 2018) and Forecasted Estimates (Till 2035) (USD Billion)
- Table 25.104 Overall Powered Exoskeletons Market: Historical Trends (Since 2018) and Forecasted Estimates (Till 2035) (USD Billion)
- Table 25.105 Overall Passive Exoskeletons Market: Historical Trends (Since 2018) and Forecasted Estimates (Till 2035) (USD Billion)
- Table 25.106 Overall Hybrid Exoskeletons Market: Historical Trends (Since 2018) and Forecasted Estimates (Till 2035) (USD Billion)
- Table 25.107 Medical Exoskeletons Market: Distribution by Form (USD Billion)
- Table 25.108 Medical Rigid Exoskeletons Market: Historical Trends (Since 2018) and Forecasted Estimates (Till 2035) (USD Billion)
- Table 25.109 Medical Soft Exoskeletons Market: Historical Trends (Since 2018) and Forecasted Estimates (Till 2035) (USD Billion)
- Table 25.110 Non-Medical Exoskeletons Market: Distribution by Form (USD Billion)
- Table 25.111 Non-Medical Rigid Exoskeletons Market: Historical Trends (Since 2018) and Forecasted Estimates (Till 2035) (USD Billion)
- Table 25.112 Non-Medical Soft Exoskeletons Market: Historical Trends (Since 2018) and Forecasted Estimates (Till 2035) (USD Billion)
- Table 25.113 Overall Exoskeletons Market: Distribution by Form (USD Billion)
- Table 25.114 Overall Rigid Exoskeletons Market: Historical Trends (Since 2018) and Forecasted Estimates (Till 2035)
- Table 25.115 Overall Soft Exoskeletons Market: Historical Trends (Since 2018) and Forecasted Estimates (Till 2035) (USD Billion)
- Table 25.116 Medical Fixed / Supported Exoskeletons Market: Historical Trends (Since 2018) and Forecasted Estimates (Till 2035) (USD Billion)
- Table 25.117 Medical Mobile / Overground Walking Exoskeletons Market: Historical Trends (Since 2018) and Forecasted Estimates (Till 2035) (USD Billion)
- Table 25.118 Overall Exoskeletons Market: Distribution by End Users (USD Billion)
- Table 25.119 Medical Exoskeletons Market by Patients: Historical Trends (Since 2018) and Forecasted Estimates (Till 2035) (USD Billion)
- Table 25.120 Medical Exoskeletons Market by Healthcare Professionals: Historical Trends (Since 2018) and Forecasted Estimates (Till 2035) (USD Billion)
- Table 25.121 Non-Medical Exoskeletons Market by Industry Workers: Historical Trends (Since 2018) and Forecasted Estimates (Till 2035) (USD Billion)
- Table 25.122 Non-Medical Exoskeletons Market by Military Personnel: Historical Trends (Since 2018) and Forecasted Estimates (Till 2035) (USD Billion)
- Table 25.123 Non-Medical Exoskeletons Market by Other End Users: Historical Trends (Since 2018) and Forecasted Estimates (Till 2035) (USD Billion)
- Table 25.124 Exoskeletons Market in North America: Historical Trends (Since 2018) Forecasted Estimates (Till 2035) (USD Billion)
- Table 25.125 Exoskeletons Market in Europe: Historical Trends (Since 2018) Forecasted Estimates (Till 2035) (USD Billion)
- Table 25.126 Exoskeleton Market in Asia-Pacific: Historical Trends (Since 2018) Forecasted Estimates (Till 2035) (USD Billion)
- Table 25.127 Exoskeleton Market in Rest of the World: Historical Trends (Since 2018) Forecasted Estimates (Till 2035) (USD Billion)
List of Figures
- Figure 2.1 Research Methodology: Project Assumptions
- Figure 2.2 Research Methodology: Forecast Methodology
- Figure 2.3 Research Methodology: Robust Quality Control
- Figure 2.4 Research Methodology: Key Market Segmentations
- Figure 3.1 Lessons Learnt from Past Recessions
- Figure 4.1 Executive Summary: Medical Exoskeletons Market Landscape
- Figure 4.2 Executive Summary: Non-Medical Exoskeletons Market Landscape
- Figure 4.3 Executive Summary: Partnerships and Collaborations
- Figure 4.4 Executive Summary: Patent Analysis
- Figure 4.5 Executive Summary: Overall Market Forecast and Opportunity Analysis
- Figure 4.6 Executive Summary: Medical Exoskeletons Market Forecast and Opportunity Analysis
- Figure 4.7 Executive Summary: Non-Medical Exoskeletons Market Forecast and Opportunity Analysis
- Figure 5.1 Types of Mobility Assistive Devices
- Figure 5.2 Historical Events Related to Exoskeletons
- Figure 5.3 Classification of Exoskeletons
- Figure 5.4 Movements Supported by Lower Body, Upper Body and Full Body Exoskeletons
- Figure 5.5 Components of a Powered / Robotic Exoskeletons
- Figure 5.6 Features of Exoskeletons
- Figure 5.7 Limitations of Exoskeletons
- Figure 5.8 Applications of Exoskeleton
- Figure 6.1 Medical Exoskeletons: Distribution by Status of Development
- Figure 6.2 Medical Exoskeletons: Distribution by Type of Body Part Covered
- Figure 6.3 Medical Exoskeletons: Distribution by Mode of Operation
- Figure 6.4 Medical Exoskeletons: Distribution Type of Body Part Covered and Mode of Operation
- Figure 6.5 Medical Exoskeletons: Distribution by Form of Exoskeleton
- Figure 6.6 Medical Exoskeletons: Distribution by Mode of Operation and Form of Exoskeleton
- Figure 6.7 Medical Exoskeletons: Distribution Type of Body Part Covered and Form of Exoskeleton
- Figure 6.8 Medical Exoskeletons: Distribution by Device Mobility
- Figure 6.9 Medical Exoskeletons: Distribution by Mode of Operation and Device Mobility
- Figure 6.10 Medical Exoskeletons: Distribution by Form and Device Mobility
- Figure 6.11 Medical Exoskeletons: Distribution by Type of Body Part Covered and Device Mobility
- Figure 6.12 Medical Exoskeletons: Distribution by User-Machine Interface
- Figure 6.13 Medical Exoskeletons: Distribution by Type of Body Part Covered and User-Machine Interface
- Figure 6.14 Medical Exoskeletons: Distribution by Mode of Operation and User-Machine Interface
- Figure 6.15 Medical Exoskeletons: Distribution by Availability of Advanced Features
- Figure 6.16 Medical Exoskeletons: Distribution by End User
- Figure 6.17 Medical Exoskeletons: Distribution by Patient Age Group
- Figure 6.18 Medical Exoskeletons: Distribution by Exoskeleton Setting for Patients
- Figure 6.19 Medical Exoskeletons: Distribution by Breakthrough Designation
- Figure 6.20 Medical Exoskeleton Developers: Distribution by Year of Establishment
- Figure 6.21 Medical Exoskeleton Developers: Distribution by Company Size
- Figure 6.22 Medical Exoskeleton Developers: Distribution by Company Size and Employee Count
- Figure 6.23 Medical Exoskeleton Developers: Distribution by Location of Headquarters (Region)
- Figure 6.24 Medical Exoskeleton Developers: Distribution by Location of Headquarters (Country)
- Figure 6.25 Medical Exoskeleton Developers: Distribution by Company Size and Location of Headquarters
- Figure 6.26 Medical Exoskeleton Developers: Distribution by Company Ownership
- Figure 6.27 Medical Exoskeleton Developers: Distribution by Location of Headquarters and Company Ownership
- Figure 6.28 Medical Exoskeleton Developers: Distribution by Additional Services Offered
- Figure 6.29 Most Active Players: Distribution by Number of Medical Exoskeleton
- Figure 7.1 Non-Medical Exoskeletons: Distribution by Status of Development
- Figure 7.2 Non-Medical Exoskeletons: Distribution by Type of Body Part Covered
- Figure 7.3 Non-Medical Exoskeletons: Distribution by Body Part Supported
- Figure 7.4 Non-Medical Exoskeletons: Distribution by Mode of Operation
- Figure 7.5 Non-Medical Exoskeletons: Distribution by Form of Exoskeleton
- Figure 7.6 Non-Medical Exoskeletons: Distribution by Type of Body Part Covered and Mode of Operation
- Figure 7.7 Non-Medical Exoskeletons: Distribution by Type of Body Part Covered and Form of Exoskeleton
- Figure 7.8 Non-Medical Exoskeletons: Distribution by Mode of Operation and Form of Exoskeleton
- Figure 7.9 Non-Medical Exoskeletons: Distribution by Application Area
- Figure 7.10 Non-Medical Exoskeletons: Distribution by Mode of Operation and Application Area
- Figure 7.11 Non-Medical Exoskeleton Developers: Distribution by Year of Establishment
- Figure 7.12 Non-Medical Exoskeleton Developers: Distribution by Company Size
- Figure 7.13 Non-Medical Exoskeleton Developers: Distribution by Company Size and Employee Count
- Figure 7.14 Non-Medical Exoskeleton Developers: Distribution by Location of Headquarters (Region)
- Figure 7.15 Non-Medical Exoskeleton Developers: Distribution by Location of Headquarters (Country)
- Figure 7.16 Non-Medical Exoskeleton Developers: Distribution by Company Size and Location of Headquarters
- Figure 7.17 Non-Medical Exoskeleton Developers: Distribution by Company Ownership
- Figure 7.18 Non-Medical Exoskeleton Developers: Distribution by Location of Headquarters and Company Ownership
- Figure 7.19 Most Active Players: Distribution by Number of Exoskeletons
- Figure 7.20 Most Active Players: Distribution by Number of Medical and Non-Medical Exoskeletons
- Figure 8.1 Product Competitiveness Analysis: Powered Upper Body Exoskeletons (Peer Group I)
- Figure 8.2 Product Competitiveness Analysis: Passive Upper Body Exoskeletons (Peer Group II)
- Figure 8.3 Product Competitiveness Analysis: Hybrid Upper Body Exoskeletons (Peer Group III)
- Figure 8.4 Product Competitiveness Analysis: Powered Lower Body Exoskeletons (Peer Group IV)
- Figure 8.5 Product Competitiveness Analysis: Passive Lower Body Exoskeletons (Peer Group V)
- Figure 8.6 Product Competitiveness Analysis: Hybrid Lower Body Exoskeletons (Peer Group VI)
- Figure 8.7 Product Competitiveness Analysis: Full Body Exoskeleton (Peer Group VII)
- Figure 9.1 CYBERDYNE: Annual Revenues, Since FY 2019 (JPY Billion)
- Figure 9.2 CYBERDYNE: Distribution of Revenues by Business Segment, Since FY 2021
- Figure 9.3 Ekso Bionics: Annual Revenues, 2018 - Q1 2023 (USD Billion)
- Figure 9.4 Ekso Bionics: Distribution of Revenues by Business Segment, FY 2023
- Figure 9.5 Panasonic: Annual Revenues, Since FY 2018 (JPY Billion)
- Figure 11.1 Partnerships and Collaborations: Cumulative Year-wise Trend, Since 2017
- Figure 11.2 Partnerships and Collaborations: Distribution by Type of Partnership
- Figure 11.3 Partnerships and Collaborations: Distribution by Year and Type of Partnership
- Figure 11.4 Partnerships and Collaborations: Distribution by Purpose of Partnership
- Figure 11.5 Partnerships and Collaborations: Distribution by Type and Purpose of Partnership
- Figure 11.6 Partnerships and Collaborations: Distribution by Type of Partner
- Figure 11.7 Partnerships and Collaborations: Distribution by Type of Partnership and Type of Partner
- Figure 11.8 Partnerships and Collaborations: Distribution by Type of Non-Industry Partner
- Figure 11.9 Most Active Players: Distribution by Number of Partnerships
- Figure 11.10 Partnerships and Collaborations: Local and International Agreements
- Figure 11.11 Partnerships and Collaborations: Intracontinental and Intercontinental Agreements
- Figure 12.1 Patent Analysis: Distribution by Type of Patent
- Figure 12.2 Patent Analysis: Cumulative Year-wise Trend by Patent Application Year, Since Pre
- Figure 12.3 Patent Analysis: Cumulative Year-wise Trend by Patent Publication Year, Since 2016
- Figure 12.4 Patent Analysis: Distribution by Type of Patent and Patent Publication Year, Since 2016
- Figure 12.5 Patent Analysis: Distribution by Publication Time
- Figure 12.6 Patent Analysis: Distribution by Patent Jurisdiction (Region)
- Figure 12.7 Patent Analysis: Distribution by Patent Jurisdiction (Country)
- Figure 12.8 Patent Analysis: Distribution by CPC Symbols
- Figure 12.9 Patent Analysis: Distribution by Type of Applicant
- Figure 12.10 Leading Industry Players: Distribution by Number of Patents
- Figure 12.11 Leading Non-Industry Players: Distribution by Number of Patents
- Figure 12.12 Leading Individual Assignees: Distribution by Number of Patents
- Figure 12.13 Patent Benchmarking Analysis: Distribution of CPC Codes by Leading Industry Players
- Figure 12.14 Patent Benchmarking Analysis: Distribution of CPC Codes by Leading Non- Industry Players
- Figure 12.15 Patent Analysis: Distribution by Patent Age
- Figure 12.16 Patent Analysis: Patent Valuation
- Figure 13.1 Differences Between Red Ocean Strategy and Blue Ocean Strategy
- Figure 13.2 Blue Ocean Strategy: Strategy Canvas
- Figure 13.3 Blue Ocean Strategy: Pioneer-Migrator-Settler (PMS) Map
- Figure 13.4 Blue Ocean Strategy: Buyer Utility Map
- Figure 15.1 Standard Demand-Price Curve for Exoskeleton
- Figure 15.2 Global Exoskeletons Market, Historical Trends (Since 2018) and Forecasted Estimates (Till 2035) (USD Billion)
- Figure 15.3 Global Exoskeletons Market, Forecasted Estimates (Since 2023), Conservative Scenario (USD Billion)
- Figure 15.4 Global Exoskeletons Market, Forecasted Estimates (Since 2023), Optimistic Scenario (USD Billion)
- Figure 16.1 Overall Exoskeletons Market: Distribution by Body Part Covered (USD Billion)
- Figure 16.2 Overall Exoskeletons Market for Upper Body Exoskeletons: Historical Trends (Since 2018) and Future Estimates (Till 2035) (USD Billion)
- Figure 16.3 Overall Exoskeletons Market for Lower Body Exoskeletons: Historical Trends (Since 2018) and Future Estimates (2023- 2035) (USD Billion)
- Figure 16.4 Overall Exoskeletons Market for Full Body Exoskeletons: Historical Trends (Since 2018) and Future Estimates (Till 2035) (USD Billion)
- Figure 16.5 Medical Exoskeletons Market: Distribution by Body Part Covered, 2018, 2023 and 2035 (USD Billion)
- Figure 16.6 Medical Exoskeletons Market for Upper Body Exoskeletons: Historical Trends (Since 2018) and Future Estimates (Till 2035) (USD Billion)
- Figure 16.7 Medical Exoskeletons Market for Lower Body Exoskeletons: Historical Trends (Since 2018) and Future Estimates (Till 2035) (USD Billion)
- Figure 16.8 Medical Exoskeletons Market for Full Body Exoskeletons: Historical Trends (Since 2018) and Future Estimates (Till 2035) (USD Billion)
- Figure 16.9 Non-Medical Exoskeletons Market: Distribution by Body Part Covered (USD Billion)
- Figure 16.10 Non-Medical Exoskeletons Market for Upper Body Exoskeletons: Historical Trends (Since 2018) and Future Estimates (Till 2035) (USD Billion)
- Figure 16.11 Non-Medical Exoskeletons Market for Lower Body Exoskeletons: Historical Trends (Since 2018) and Future Estimates (2023- 2035) (USD Billion)
- Figure 16.12 Non-Medical Exoskeletons Market for Full Body Exoskeletons: Historical Trends (Since 2018) and Future Estimates (Till 2035) (USD Billion)
- Figure 17.1 Overall Exoskeletons Market: Distribution by Mode of Operation (USD Billion)
- Figure 17.2 Overall Exoskeletons Market for Powered Exoskeletons, Historical Trends (Since 2018) and Future Estimates (Till 2035) (USD Billion)
- Figure 17.3 Overall Exoskeletons Market for Passive Exoskeletons, Historical Trends (Since 2018) and Future Estimates (Till 2035) (USD Billion)
- Figure 17.4 Overall Exoskeletons Market for Hybrid Exoskeletons, Historical Trends (Since 2018) and Future Estimates (Till 2035) (USD Billion)
- Figure 17.5 Medical Exoskeletons Market: Distribution by Mode of Operation (USD Billion)
- Figure 17.6 Medical Powered Exoskeletons Market, Historical Trends (Since 2018) and Future Estimates (Till 2035) (USD Billion)
- Figure 17.7 Medical Passive Exoskeletons Market, Historical Trends (Since 2018) and Future Estimates (Till 2035) (USD Billion)
- Figure 17.8 Medical Hybrid Exoskeletons Market, Historical Trends (Since 2018) and Future Estimates (Till 2035) (USD Billion)
- Figure 17.9 Non-Medical Exoskeletons Market: Distribution by Mode of Operation (USD Billion)
- Figure 17.10 Non-Medical Powered Exoskeletons Market, Historical Trends (Since 2018) and Future Estimates (Till 2035) (USD Billion)
- Figure 17.11 Non-Medical Passive Exoskeletons Market, Historical Trends (Since 2018) and Future Estimates (Till 2035) (USD Billion)
- Figure 17.12 Non-Medical Hybrid Exoskeletons Market, Historical Trends (Since 2018) and Future Estimates (Till 2035) (USD Billion)
- Figure 18.1 Overall Exoskeletons Market: Distribution by Form (USD Billion)
- Figure 18.2 Overall Exoskeletons Market for Rigid Exoskeletons, Historical Trends (Since 2018) and Future Estimates (Till 2035) (USD Billion)
- Figure 18.3 Overall Exoskeletons Market for Soft Exoskeletons, Historical Trends (Since 2018) and Future Estimates (Till 2035) (USD Billion)
- Figure 18.4 Medical Exoskeletons Market: Distribution by Form (USD Billion)
- Figure 18.5 Medical Rigid Exoskeletons Market, Historical Trends (Since 2018) and Future Estimates (Till 2035) (USD Billion)
- Figure 18.6 Medical Soft Exoskeletons Market, Historical Trends (Since 2018) and Future Estimates (Till 2035) (USD Billion)
- Figure 18.7 Non-Medical Exoskeletons Market: Distribution by Form (USD Billion)
- Figure 18.8 Non-Medical Rigid Exoskeletons Market, Historical Trends (Since 2018) and Future Estimates (Till 2035) (USD Billion)
- Figure 18.9 Non-Medical Soft Exoskeletons Market, Historical Trends (Since 2018) and Future Estimates (Till 2035) (USD Billion)
- Figure 19.1 Medical Exoskeletons Market: Distribution by Mobility (USD Billion)
- Figure 19.2 Medical Fixed / Supported Exoskeletons Market: Historical Trends (Since 2018) and Future Estimates (Till 2035) (USD Billion)
- Figure 19.3 Medical Mobile / Overground Walking Exoskeletons Market: Historical Trends (Since 2018) and Future Estimates (Till 2035) (USD Billion)
- Figure 20.1 Overall Exoskeletons Market: Distribution by End Users (USD Billion)
- Figure 20.2 Exoskeletons Market for Patients, Historical Trends (Since 2018) and Future Estimates (Till 2035) (USD Billion)
- Figure 20.3 Exoskeletons Market for Healthcare Professionals, Historical Trends (Since 2018) and Future Estimates (Till 2035) (USD Billion)
- Figure 20.4 Exoskeletons Market for Industry Workers, Historical Trends (Since 2018) and Future Estimates (Till 2035) (USD Billion)
- Figure 20.5 Exoskeletons Market for Military Personnel, Historical Trends (Since 2018) and Future Estimates (Till 2035) (USD Billion)
- Figure 20.6 Exoskeletons Market for Other End Users, Historical Trends (Since 2018) and Future Estimates (Till 2035) (USD Billion)
- Figure 21.1 Overall Exoskeletons Market: Distribution by Geography
- Figure 21.2 Exoskeletons Market in North America, Historical Trends (Since 2018) and Future Estimates (Till 2035) (USD Billion)
- Figure 21.3 Exoskeletons Market in Europe, Historical Trends (Since 2018) and Future Estimates (Till 2035) (USD Billion)
- Figure 21.4 Exoskeletons Market in Asia-Pacific, Historical Trends (Since 2018) and Future Estimates (Till 2035) (USD Billion)
- Figure 21.5 Exoskeletons Market in Rest of the World, Historical Trends (Since 2018) and Future Estimates (Till 2035) (USD Billion)
- Figure 22.1 Concluding Remarks: Overall Medical Exoskeletons Market Landscape
- Figure 22.2 Concluding Remarks: Overall Non-Medical Exoskeletons Market Landscape
- Figure 22.3 Concluding Remarks: Partnerships and Collaborations
- Figure 22.4 Concluding Remarks: Patent Analysis
- Figure 22.5 Concluding Remarks: Market Forecast and Opportunity Analysis (I/II)
- Figure 22.6 Concluding Remarks: Market Forecast and Opportunity Analysis (II/II)
- Figure 24.1 Blue Ocean Strategy: Three Tiers of Non-customers
- Figure 24.2 Blue Ocean Strategy: Sequence of Blue Ocean Strategy
- Figure 24.3 Blue Ocean Strategy: The Price Corridor of The Mass
 2026年全球建筑外骨骼市场报告
 外骨骼机器人市场:2026-2032年全球市场预测(依产品类型、应用、最终用户、技术和驱动系统划分)建筑外骨骼市场:2026-2032年全球市场预测(依产品类型、目标部位、动力来源、应用及销售管道)腰椎辅助外骨骼市场依产品类型、动力来源、最终用户和通路划分,全球预测(2026-2032年)被动式外骨骼机器人市场:按应用、类型、最终用户和电源划分,全球预测(2026-2032年)
 美国外骨骼市场规模、份额和趋势分析报告:按移动性、技术、目标部位、应用、地区和细分市场划分,预测期为2026-2033年2026年全球外骨骼復健市场报告外骨骼市场规模、份额和趋势分析报告:按移动性、技术、目标部位、应用、地区和细分市场预测(2026-2033 年)
 外骨骼机器人:全球市场份额和排名、总收入和需求预测(2025-2031年)外骨骼机器人:全球市场份额和排名、总收入和需求预测(2025-2031 年)