


 |
市场调查报告书
商品编码
1958445
智慧粉尘市场(至 2035 年):依粉尘类型、组件、製造流程、最终用户和地区划分的产业趋势和全球预测Smart Dust Market, Till 2035: Distribution by Type of Dust, Type of Component, Type of Manufacturing Process, End User, and Geographical Regions: Industry Trends and Global Forecasts |
||||||
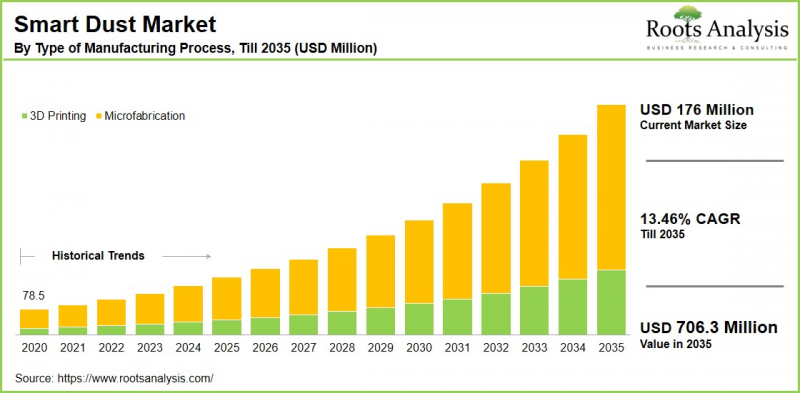
全球智慧粉尘市场预计将从目前的 1.76 亿美元成长到 2035 年的 7.063 亿美元,预测期内复合年增长率 (CAGR) 为 13.46%。
智慧粉尘市场机会分类:
粉尘型
- 可生物降解粉尘
- 不可生物降解粉尘
元件
- 主动式光纤传输
- 控制电路
- 被动光传输
- 感测器
- 讯号处理
- 其他
製造製程
- 3D列印
- 微加工
最终使用者
- 航空航太与国防
- 银行、金融服务和保险 (BFSI)
- 消费品与零售
- 医疗保健
- 製造业
- 媒体与娱乐
- 其他
依地区
- 北美洲
- 美国
- 加拿大
- 墨西哥
- 其他北美洲国家国家/地区
- 欧洲
- 奥地利
- 比利时
- 丹麦
- 法国
- 德国
- 爱尔兰
- 义大利
- 荷兰
- 挪威
- 俄罗斯
- 西班牙
- 瑞典
- 瑞士
- 英国
- 其他欧洲国家
- 亚洲
- 中国
- 印度
- 日本
- 新加坡
- 韩国
- 其他亚洲国家
- 拉丁美洲
- 巴西
- 智利
- 哥伦比亚
- 委内瑞拉
- 其他拉丁美洲、中东和北非国家
- 埃及
- 伊朗
- 伊拉克
- 以色列
- 科威特
- 沙乌地阿拉伯阿拉伯
- 阿拉伯联合大公国
- 其他中东和北非国家
- 世界其他地区
- 澳大利亚
- 纽西兰
- 其他国家
智慧微尘市场:成长与趋势
智慧微尘是指由微型无线感测器组成的集合体。这些感测器可以检测各种环境变化,例如温度、光照、声音和化学变化,其尺寸通常小于一毫米。智慧微尘透过无线通讯即时收集和传输数据,从而实现对各种环境的全面监测。值得注意的是,智慧微尘的优点包括能够有效率地收集大量数据、体积小巧,可以安装在难以到达的地方,以及透过即时分析改善决策的潜力。
受中国和印度等发展中国家工业化进程加速的推动,预计全球智慧微尘市场在预测期内将显着成长。 此外,智慧尘埃产品的最新趋势和创新,包括与人工智慧和机器学习的先进整合,都值得关注。物联网 (IoT) 应用需求的不断增长等创新,正在促进医疗保健、製造业和农业等领域的顺畅资料交换。
此外,奈米技术的进步和微机电系统 (MEMS) 的发展正在拓展智慧尘埃的应用范围,使其更易于适应并降低成本,从而实现对关键过程的即时监测。考虑到以上因素,预计智慧尘埃市场在预测期内将呈现显着成长。
本报告对全球智慧尘埃市场进行了深入研究,并提供了全面的概述、背景分析、市场影响因素分析、市场规模趋势和预测、依细分市场和地区划分的详细分析、竞争格局以及主要公司的概况。
目录
第一部分:报告概述
第一章:引言
第二章:研究方法
第三章:市场动态
第四章:宏观经济指标
第二部分:质性分析
第五章:摘要整理
第六章:引言
第七章:监理环境
第三部分:市场概览
第八章:关键指标综合资料库
公司第 9 章:竞争格局
第 10 章:空白分析
第 11 章:竞争分析
第 12 章:智慧灰尘市场中的新创生态系
第四节:公司简介
第13章 企业简介
- 章概要
- Analog Devices
- BetaBatt
- Bosch Sensortec
- Defendec
- Hitachi
- Honeywell
- IBM
- Infineon Technologies
- Maxim Integrated
- Memsic
- Panasonic
- Sony
- Texas Instruments
- Valarm
第五部分:市场趋势
第 14 章:大趋势分析
第 15 章:专利分析
第 16 章:最新进展
第六部分:市场机会分析
第 18 章:全球智慧灰尘市场
第 19 章:以粉尘类型划分的市场机会
第 20 章:市场机会组件
第21章:依製造流程划分的市场机会
第22章:依最终用户划分的市场机会
第23章:北美智慧粉尘市场机会
第24章:欧洲智慧粉尘市场机会
第25章:亚洲智慧粉尘市场机会
第26章:中东与北非智慧粉尘市场机会
第27章:拉丁美洲智慧粉尘市场机会
第28章:世界其他地区智慧粉尘市场机会
第29章:市场集中度
分析:主要参与者分布第30章:邻近市场分析
第七部分:策略工具
第31章:关键制胜策略
第32章:波特五力分析
第33章:SWOT分析
第34章:价值链分析
第35章:ROOTS策略建议
第八部分:其他独家见解
第36章:来自一手研究的见解
第37章:报告结论
第九部分:附录
第38章:表格资料
第39章:公司与组织清单
第40章:自订选项
第41章:ROOTS订阅服务
第42章:作者资讯
Smart Dust Market Overview
As per Roots Analysis, the global smart dust market size is estimated to grow from USD 176 million in the current year USD 706.3 million by 2035, at a CAGR of 13.46% during the forecast period, till 2035.
The opportunity for smart dust market has been distributed across the following segments:
Type of Dust
- Biodegradable
- Non-Biodegradable
Type of Component
- Active Optical Transmission
- Control Circuitry
- Passive Optical Transmission
- Sensors
- Signal Processing
- Others
Type of Manufacturing Process
- 3D Printing
- Microfabrication
End User
- Aerospace and Defense
- BFSI
- Consumer Goods & Retail
- Healthcare
- Manufacturing
- Media & Entertainment
- Others
Geographical Regions
- North America
- US
- Canada
- Mexico
- Other North American countries
- Europe
- Austria
- Belgium
- Denmark
- France
- Germany
- Ireland
- Italy
- Netherlands
- Norway
- Russia
- Spain
- Sweden
- Switzerland
- UK
- Other European countries
- Asia
- China
- India
- Japan
- Singapore
- South Korea
- Other Asian countries
- Latin America
- Brazil
- Chile
- Colombia
- Venezuela
- Other Latin American countries
- Middle East and North Africa
- Egypt
- Iran
- Iraq
- Israel
- Kuwait
- Saudi Arabia
- UAE
- Other MENA countries
- Rest of the World
- Australia
- New Zealand
- Other countries
Smart Dust Market: Growth and Trends
The collection of tiny wireless sensors is referred to as smart dust. These sensors are capable of detecting various environmental changes, including temperature, light, sound, and chemical variations, and often measure under a millimeter in size. It is important to note that smart dust operates by collecting and transmitting data in real-time through wireless communication, allowing for comprehensive monitoring in various environments. Significantly, the benefits of smart dust include its efficiency in gathering large volumes of data, its compact size enabling deployment in hard-to-access locations, and its potential to improve decision-making with real-time analytics.
The smart dust market globally is predicted to experience substantial growth during the forecast period, driven by accelerated industrialization in developing nations like China and India. Moreover, recent advancements and innovations in smart dust products, including greater integration with artificial intelligence and machine learning, are noteworthy. Innovations, such as the increasing demand for Internet of Things (IoT) applications, promote smooth data exchange across sectors like healthcare, manufacturing, and agriculture.
Additionally, progress in nanotechnology and the creation of microelectromechanical systems (MEMS) are advancing the possibilities for smart dust applications, making them more adaptable and affordable for real-time monitoring of essential processes. Considering the above mentioned factors, the smart dust market is expected to grow at a significant rate during the forecast period.
Smart Dust Market: Key Segments
Market Share by Type of Dust
Based on type of dust, the global smart dust market is segmented into biodegradable and non-biodegradable. According to our estimates, currently, the non-biodegradable segment captures the majority of the market share. This dominance can be attributed to its superior durability, stability, and performance across various applications.
However, the biodegradable segment is expected to grow at a higher CAGR during the forecast period. This trend can be linked to the rising environmental concerns and a growing demand for sustainable technologies, as biodegradable smart dust can naturally decompose, thereby minimizing ecological impact.
Market Share by Type of Component
Based on type of component, the global smart dust market is segmented into active optical transmission, control circuitry, passive optical transmission, sensors, signal processing and others. According to our estimates, currently, the sensors segment captures the majority of the market share. This dominance is due to their essential function in facilitating the primary operations of smart dust systems, which involves gathering and relaying real-time data for various uses, such as environmental monitoring, healthcare, and industrial automation.
Market Share by Type of Manufacturing Process
Based on type of manufacturing process, the global smart dust market is segmented into 3D printing and microfabrication. According to our estimates, currently, the microfabrication segment captures the majority of the market share. This is due to its unmatched precision and capability to produce complex micro and nanoscale structures vital for the operation of smart dust devices.
However, the 3D printing segment is expected to grow at a higher CAGR during the forecast period, due to its capacity to manufacture intricate and customized designs at a microscale, which perfectly meets the detailed requirements of smart dust applications.
Market Share by End User
Based on end user, the global smart dust market is segmented into aerospace and defense, BFSI, consumer goods & retail, healthcare, manufacturing, media & entertainment and others. According to our estimates, currently, the healthcare segment captures the majority of the market share and this segment is projected to grow at a higher CAGR during the forecast period. This growth can be attributed to the essential requirement for advanced monitoring and data collection technologies that improve patient care and operational efficiencies.
Market Share by Geographical Regions
Based on geographical regions, the smart dust market is segmented into North America, Europe, Asia, Latin America, Middle East and North Africa, and the rest of the world. According to our estimates, currently Asia captures the majority share of the market.
In addition, the market in North America is expected to grow at a higher CAGR during the forecast period, owing to the advancements in technology and innovation, especially within the sectors of defense, healthcare, and industrial automation.
Example Players in Smart Dust Market
- Analog Devices
- BetaBatt
- Bosch Sensortec
- Defendec
- Hitachi
- Honeywell
- IBM
- Infineon Technologies
- Maxim Integrated
- Memsic
- Panasonic
- Sony
- Texas Instruments
- Valarm
Smart Dust Market: Research Coverage
The report on the smart dust market features insights on various sections, including:
- Market Sizing and Opportunity Analysis: An in-depth analysis of the smart dust market, focusing on key market segments, including [A] type of dust, [B] type of component, [C] type of manufacturing process, [D] end user, and [E] geographical regions.
- Competitive Landscape: A comprehensive analysis of the companies engaged in the smart dust market, based on several relevant parameters, such as [A] year of establishment, [B] company size, [C] location of headquarters and [D] ownership structure.
- Company Profiles: Elaborate profiles of prominent players engaged in the smart dust market, providing details on [A] location of headquarters, [B] company size, [C] company mission, [D] company footprint, [E] management team, [F] contact details, [G] financial information, [H] operating business segments, [I] portfolio, [J] moat analysis, [K] recent developments, and an informed future outlook.
- Megatrends: An evaluation of ongoing megatrends in the smart dust industry.
- Patent Analysis: An insightful analysis of patents filed / granted in the smart dust domain, based on relevant parameters, including [A] type of patent, [B] patent publication year, [C] patent age and [D] leading players.
- Recent Developments: An overview of the recent developments made in the smart dust market, along with analysis based on relevant parameters, including [A] year of initiative, [B] type of initiative, [C] geographical distribution and [D] most active players.
- Porter's Five Forces Analysis: An analysis of five competitive forces prevailing in the smart dust market, including threats of new entrants, bargaining power of buyers, bargaining power of suppliers, threats of substitute products and rivalry among existing competitors.
- SWOT Analysis: An insightful SWOT framework, highlighting the strengths, weaknesses, opportunities and threats in the domain. Additionally, it provides Harvey ball analysis, highlighting the relative impact of each SWOT parameter.
- Value Chain Analysis: A comprehensive analysis of the value chain, providing information on the different phases and stakeholders involved in the smart dust market.
Key Questions Answered in this Report
- How many companies are currently engaged in smart dust market?
- Which are the leading companies in this market?
- What factors are likely to influence the evolution of this market?
- What is the current and future market size?
- What is the CAGR of this market?
- How is the current and future market opportunity likely to be distributed across key market segments?
Reasons to Buy this Report
- The report provides a comprehensive market analysis, offering detailed revenue projections of the overall market and its specific sub-segments. This information is valuable to both established market leaders and emerging entrants.
- Stakeholders can leverage the report to gain a deeper understanding of the competitive dynamics within the market. By analyzing the competitive landscape, businesses can make informed decisions to optimize their market positioning and develop effective go-to-market strategies.
- The report offers stakeholders a comprehensive overview of the market, including key drivers, barriers, opportunities, and challenges. This information empowers stakeholders to stay abreast of market trends and make data-driven decisions to capitalize on growth prospects.
Additional Benefits
- Complimentary Excel Data Packs for all Analytical Modules in the Report
- 15% Free Content Customization
- Detailed Report Walkthrough Session with Research Team
- Free Updated report if the report is 6-12 months old or older
TABLE OF CONTENTS
SECTION I: REPORT OVERVIEW
1. PREFACE
- 1.1. Introduction
- 1.2. Market Share Insights
- 1.3. Key Market Insights
- 1.4. Report Coverage
- 1.5. Key Questions Answered
- 1.6. Chapter Outlines
2. RESEARCH METHODOLOGY
- 2.1. Chapter Overview
- 2.2. Research Assumptions
- 2.3. Database Building
- 2.3.1. Data Collection
- 2.3.2. Data Validation
- 2.3.3. Data Analysis
- 2.4. Project Methodology
- 2.4.1. Secondary Research
- 2.4.1.1. Annual Reports
- 2.4.1.2. Academic Research Papers
- 2.4.1.3. Company Websites
- 2.4.1.4. Investor Presentations
- 2.4.1.5. Regulatory Filings
- 2.4.1.6. White Papers
- 2.4.1.7. Industry Publications
- 2.4.1.8. Conferences and Seminars
- 2.4.1.9. Government Portals
- 2.4.1.10. Media and Press Releases
- 2.4.1.11. Newsletters
- 2.4.1.12. Industry Databases
- 2.4.1.13. Roots Proprietary Databases
- 2.4.1.14. Paid Databases and Sources
- 2.4.1.15. Social Media Portals
- 2.4.1.16. Other Secondary Sources
- 2.4.2. Primary Research
- 2.4.2.1. Introduction
- 2.4.2.2. Types
- 2.4.2.2.1. Qualitative
- 2.4.2.2.2. Quantitative
- 2.4.2.3. Advantages
- 2.4.2.4. Techniques
- 2.4.2.4.1. Interviews
- 2.4.2.4.2. Surveys
- 2.4.2.4.3. Focus Groups
- 2.4.2.4.4. Observational Research
- 2.4.2.4.5. Social Media Interactions
- 2.4.2.5. Stakeholders
- 2.4.2.5.1. Company Executives (CXOs)
- 2.4.2.5.2. Board of Directors
- 2.4.2.5.3. Company Presidents and Vice Presidents
- 2.4.2.5.4. Key Opinion Leaders
- 2.4.2.5.5. Research and Development Heads
- 2.4.2.5.6. Technical Experts
- 2.4.2.5.7. Subject Matter Experts
- 2.4.2.5.8. Scientists
- 2.4.2.5.9. Doctors and Other Healthcare Providers
- 2.4.2.6. Ethics and Integrity
- 2.4.2.6.1. Research Ethics
- 2.4.2.6.2. Data Integrity
- 2.4.3. Analytical Tools and Databases
- 2.4.1. Secondary Research
3. MARKET DYNAMICS
- 3.1. Forecast Methodology
- 3.1.1. Top-Down Approach
- 3.1.2. Bottom-Up Approach
- 3.1.3. Hybrid Approach
- 3.2. Market Assessment Framework
- 3.2.1. Total Addressable Market (TAM)
- 3.2.2. Serviceable Addressable Market (SAM)
- 3.2.3. Serviceable Obtainable Market (SOM)
- 3.2.4. Currently Acquired Market (CAM)
- 3.3. Forecasting Tools and Techniques
- 3.3.1. Qualitative Forecasting
- 3.3.2. Correlation
- 3.3.3. Regression
- 3.3.4. Time Series Analysis
- 3.3.5. Extrapolation
- 3.3.6. Convergence
- 3.3.7. Forecast Error Analysis
- 3.3.8. Data Visualization
- 3.3.9. Scenario Planning
- 3.3.10. Sensitivity Analysis
- 3.4. Key Considerations
- 3.4.1. Demographics
- 3.4.2. Market Access
- 3.4.3. Reimbursement Scenarios
- 3.4.4. Industry Consolidation
- 3.5. Robust Quality Control
- 3.6. Key Market Segmentations
- 3.7. Limitations
4. MACRO-ECONOMIC INDICATORS
- 4.1. Chapter Overview
- 4.2. Market Dynamics
- 4.2.1. Time Period
- 4.2.1.1. Historical Trends
- 4.2.1.2. Current and Forecasted Estimates
- 4.2.2. Currency Coverage
- 4.2.2.1. Overview of Major Currencies Affecting the Market
- 4.2.2.2. Impact of Currency Fluctuations on the Industry
- 4.2.3. Foreign Exchange Impact
- 4.2.3.1. Evaluation of Foreign Exchange Rates and Their Impact on Market
- 4.2.3.2. Strategies for Mitigating Foreign Exchange Risk
- 4.2.4. Recession
- 4.2.4.1. Historical Analysis of Past Recessions and Lessons Learnt
- 4.2.4.2. Assessment of Current Economic Conditions and Potential Impact on the Market
- 4.2.5. Inflation
- 4.2.5.1. Measurement and Analysis of Inflationary Pressures in the Economy
- 4.2.5.2. Potential Impact of Inflation on the Market Evolution
- 4.2.6. Interest Rates
- 4.2.6.1. Overview of Interest Rates and Their Impact on the Market
- 4.2.6.2. Strategies for Managing Interest Rate Risk
- 4.2.7. Commodity Flow Analysis
- 4.2.7.1. Type of Commodity
- 4.2.7.2. Origins and Destinations
- 4.2.7.3. Values and Weights
- 4.2.7.4. Modes of Transportation
- 4.2.8. Global Trade Dynamics
- 4.2.8.1. Import Scenario
- 4.2.8.2. Export Scenario
- 4.2.9. War Impact Analysis
- 4.2.9.1. Russian-Ukraine War
- 4.2.9.2. Israel-Hamas War
- 4.2.10. COVID Impact / Related Factors
- 4.2.10.1. Global Economic Impact
- 4.2.10.2. Industry-specific Impact
- 4.2.10.3. Government Response and Stimulus Measures
- 4.2.10.4. Future Outlook and Adaptation Strategies
- 4.2.11. Other Indicators
- 4.2.11.1. Fiscal Policy
- 4.2.11.2. Consumer Spending
- 4.2.11.3. Gross Domestic Product (GDP)
- 4.2.11.4. Employment
- 4.2.11.5. Taxes
- 4.2.11.6. R&D Innovation
- 4.2.11.7. Stock Market Performance
- 4.2.11.8. Supply Chain
- 4.2.11.9. Cross-Border Dynamics
- 4.2.1. Time Period
SECTION II: QUALITATIVE INSIGHTS
5. EXECUTIVE SUMMARY
6. INTRODUCTION
- 6.1. Chapter Overview
- 6.2. Overview of Smart Dust Market
- 6.2.1. Type of Dust
- 6.2.2. Type of Component
- 6.2.3. Type of Manufacturing Process
- 6.2.4. Type of End User
- 6.3. Future Perspective
7. REGULATORY SCENARIO
SECTION III: MARKET OVERVIEW
8. COMPREHENSIVE DATABASE OF LEADING PLAYERS
9. COMPETITIVE LANDSCAPE
- 9.1. Chapter Overview
- 9.2. Smart Dust: Overall Market Landscape
- 9.2.1. Analysis by Year of Establishment
- 9.2.2. Analysis by Company Size
- 9.2.3. Analysis by Location of Headquarters
- 9.2.4. Analysis by Ownership Structure
10. WHITE SPACE ANALYSIS
11. COMPANY COMPETITIVENESS ANALYSIS
12. STARTUP ECOSYSTEM IN THE SMART DUST MARKET
- 12.1. Smart Dust Market: Market Landscape of Startups
- 12.1.1. Analysis by Year of Establishment
- 12.1.2. Analysis by Company Size
- 12.1.3. Analysis by Company Size and Year of Establishment
- 12.1.4. Analysis by Location of Headquarters
- 12.1.5. Analysis by Company Size and Location of Headquarters
- 12.1.6. Analysis by Ownership Structure
- 12.2. Key Findings
SECTION IV: COMPANY PROFILES
13. COMPANY PROFILES
- 13.1. Chapter Overview
- 13.2. Analog Devices*
- 13.2.1. Company Overview
- 13.2.2. Company Mission
- 13.2.3. Company Footprint
- 13.2.4. Management Team
- 13.2.5. Contact Details
- 13.2.6. Financial Performance
- 13.2.7. Operating Business Segments
- 13.2.8. Service / Product Portfolio (project specific)
- 13.2.9. MOAT Analysis
- 13.2.10. Recent Developments and Future Outlook
- 13.3. BetaBatt
- 13.4. Bosch Sensortec
- 13.5. Defendec
- 13.6. Hitachi
- 13.7. Honeywell
- 13.8. IBM
- 13.9. Infineon Technologies
- 13.10. Maxim Integrated
- 13.11. Memsic
- 13.12. Panasonic
- 13.13. Sony
- 13.14. Texas Instruments
- 13.15. Valarm
SECTION V: MARKET TRENDS
14. MEGA TRENDS ANALYSIS
15. UNMET NEED ANALYSIS
16. PATENT ANALYSIS
17. RECENT DEVELOPMENTS
- 17.1. Chapter Overview
- 17.2. Recent Funding
- 17.3. Recent Partnerships
- 17.4. Other Recent Initiatives
SECTION VI: MARKET OPPORTUNITY ANALYSIS
18. GLOBAL SMART DUST MARKET
- 18.1. Chapter Overview
- 18.2. Key Assumptions and Methodology
- 18.3. Trends Disruption Impacting Market
- 18.4. Demand Side Trends
- 18.5. Supply Side Trends
- 18.6. Global Smart Dust Market, Historical Trends (Since 2020) and Forecasted Estimates (Till 2035)
- 18.7. Multivariate Scenario Analysis
- 18.7.1. Conservative Scenario
- 18.7.2. Optimistic Scenario
- 18.8. Investment Feasibility Index
- 18.9. Key Market Segmentations
19. MARKET OPPORTUNITIES BASED ON TYPE OF DUST
- 19.1. Chapter Overview
- 19.2. Key Assumptions and Methodology
- 19.3. Revenue Shift Analysis
- 19.4. Market Movement Analysis
- 19.5. Penetration-Growth (P-G) Matrix
- 19.6. Smart Dust Market for Biodegradable: Historical Trends (Since 2020) and Forecasted Estimates (Till 2035)
- 19.7. Smart Dust Market for Non-Biodegradable: Historical Trends (Since 2020) and Forecasted Estimates (Till 2035)
- 19.8. Data Triangulation and Validation
- 19.8.1. Secondary Sources
- 19.8.2. Primary Sources
- 19.8.3. Statistical Modeling
20. MARKET OPPORTUNITIES BASED ON TYPE OF COMPONENT
- 20.1. Chapter Overview
- 20.2. Key Assumptions and Methodology
- 20.3. Revenue Shift Analysis
- 20.4. Market Movement Analysis
- 20.5. Penetration-Growth (P-G) Matrix
- 20.6. Smart Dust Market for Active Optical Transmission: Historical Trends (Since 2020) and Forecasted Estimates (Till 2035)
- 20.7. Smart Dust Market for Control Circuitry: Historical Trends (Since 2020) and Forecasted Estimates (Till 2035)
- 20.8. Smart Dust Market for Passive Optical Transmission: Historical Trends (Since 2020) and Forecasted Estimates (Till 2035)
- 20.9. Smart Dust Market for Sensors: Historical Trends (Since 2020) and Forecasted Estimates (Till 2035)
- 20.10. Smart Dust Market for Signal Processing: Historical Trends (Since 2020) and Forecasted Estimates (Till 2035)
- 20.11. Smart Dust Market for Others: Historical Trends (Since 2020) and Forecasted Estimates (Till 2035)
- 20.12. Data Triangulation and Validation
- 20.12.1. Secondary Sources
- 20.12.2. Primary Sources
- 20.12.3. Statistical Modeling
21. MARKET OPPORTUNITIES BASED ON MANUFACTURING PROCESS
- 21.1. Chapter Overview
- 21.2. Key Assumptions and Methodology
- 21.3. Revenue Shift Analysis
- 21.4. Market Movement Analysis
- 21.5. Penetration-Growth (P-G) Matrix
- 21.6. Smart Dust Market for 3D Printing: Historical Trends (Since 2020) and Forecasted Estimates (Till 2035)
- 21.7. Smart Dust Market for Microfabrication: Historical Trends (Since 2020) and Forecasted Estimates (Till 2035)
- 21.8. Data Triangulation and Validation
- 21.8.1. Secondary Sources
- 21.8.2. Primary Sources
- 21.8.3. Statistical Modeling
22. MARKET OPPORTUNITIES BASED ON END USER
- 22.1. Chapter Overview
- 22.2. Key Assumptions and Methodology
- 22.3. Revenue Shift Analysis
- 22.4. Market Movement Analysis
- 22.5. Penetration-Growth (P-G) Matrix
- 22.6. Smart Dust Market for Aerospace and Defense: Historical Trends (Since 2020) and Forecasted Estimates (Till 2035)
- 22.7. Smart Dust Market for BFSI: Historical Trends (Since 2020) and Forecasted Estimates (Till 2035)
- 22.8. Smart Dust Market for Consumer Goods & Retail: Historical Trends (Since 2020) and Forecasted Estimates (Till 2035)
- 22.9. Smart Dust Market for Healthcare: Historical Trends (Since 2020) and Forecasted Estimates (Till 2035)
- 22.10. Smart Dust Market for Manufacturing: Historical Trends (Since 2020) and Forecasted Estimates (Till 2035)
- 22.11. Smart Dust Market for Media & Entertainment: Historical Trends (Since 2020) and Forecasted Estimates (Till 2035)
- 22.12. Smart Dust Market for Others: Historical Trends (Since 2020) and Forecasted Estimates (Till 2035)
- 22.13. Data Triangulation and Validation
- 22.13.1. Secondary Sources
- 22.13.2. Primary Sources
- 22.13.3. Statistical Modeling
23. MARKET OPPORTUNITIES FOR SMART DUST IN NORTH AMERICA
- 23.1. Chapter Overview
- 23.2. Key Assumptions and Methodology
- 23.3. Revenue Shift Analysis
- 23.4. Market Movement Analysis
- 23.5. Penetration-Growth (P-G) Matrix
- 23.6. Smart Dust Market in North America: Historical Trends (Since 2020) and Forecasted Estimates (Till 2035)
- 23.6.1. Smart Dust Market in the US: Historical Trends (Since 2020) and Forecasted Estimates (Till 2035)
- 23.6.2. Smart Dust Market in Canada: Historical Trends (Since 2020) and Forecasted Estimates (Till 2035)
- 23.6.3. Smart Dust Market in Mexico: Historical Trends (Since 2020) and Forecasted Estimates (Till 2035)
- 23.6.4. Smart Dust Market in Other North American Countries: Historical Trends (Since 2020) and Forecasted Estimates (Till 2035)
- 23.7. Data Triangulation and Validation
24. MARKET OPPORTUNITIES FOR SMART DUST IN EUROPE
- 24.1. Chapter Overview
- 24.2. Key Assumptions and Methodology
- 24.3. Revenue Shift Analysis
- 24.4. Market Movement Analysis
- 24.5. Penetration-Growth (P-G) Matrix
- 24.6. Smart Dust Market in Europe: Historical Trends (Since 2020) and Forecasted Estimates (Till 2035)
- 24.6.1. Smart Dust Market in Austria: Historical Trends (Since 2020) and Forecasted Estimates (Till 2035)
- 24.6.2. Smart Dust Market in Belgium: Historical Trends (Since 2020) and Forecasted Estimates (Till 2035)
- 24.6.3. Smart Dust Market in Denmark: Historical Trends (Since 2020) and Forecasted Estimates (Till 2035)
- 24.6.4. Smart Dust Market in France: Historical Trends (Since 2020) and Forecasted Estimates (Till 2035)
- 24.6.5. Smart Dust Market in Germany: Historical Trends (Since 2020) and Forecasted Estimates (Till 2035)
- 24.6.6. Smart Dust Market in Ireland: Historical Trends (Since 2020) and Forecasted Estimates (Till 2035)
- 24.6.7. Smart Dust Market in Italy: Historical Trends (Since 2020) and Forecasted Estimates (Till 2035)
- 24.6.8. Smart Dust Market in Netherlands: Historical Trends (Since 2020) and Forecasted Estimates (Till 2035)
- 24.6.9. Smart Dust Market in Norway: Historical Trends (Since 2020) and Forecasted Estimates (Till 2035)
- 24.6.10. Smart Dust Market in Russia: Historical Trends (Since 2020) and Forecasted Estimates (Till 2035)
- 24.6.11. Smart Dust Market in Spain: Historical Trends (Since 2020) and Forecasted Estimates (Till 2035)
- 24.6.12. Smart Dust Market in Sweden: Historical Trends (Since 2020) and Forecasted Estimates (Till 2035)
- 24.6.13. Smart Dust Market in Switzerland: Historical Trends (Since 2020) and Forecasted Estimates (Till 2035)
- 24.6.14. Smart Dust Market in the UK: Historical Trends (Since 2020) and Forecasted Estimates (Till 2035)
- 24.6.15. Smart Dust Market in Other European Countries: Historical Trends (Since 2020) and Forecasted Estimates (Till 2035)
- 24.7. Data Triangulation and Validation
25. MARKET OPPORTUNITIES FOR SMART DUST IN ASIA
- 25.1. Chapter Overview
- 25.2. Key Assumptions and Methodology
- 25.3. Revenue Shift Analysis
- 25.4. Market Movement Analysis
- 25.5. Penetration-Growth (P-G) Matrix
- 25.6. Smart Dust Market in Asia: Historical Trends (Since 2020) and Forecasted Estimates (Till 2035)
- 25.6.1. Smart Dust Market in China: Historical Trends (Since 2020) and Forecasted Estimates (Till 2035)
- 25.6.2. Smart Dust Market in India: Historical Trends (Since 2020) and Forecasted Estimates (Till 2035)
- 25.6.3. Smart Dust Market in Japan: Historical Trends (Since 2020) and Forecasted Estimates (Till 2035)
- 25.6.4. Smart Dust Market in Singapore: Historical Trends (Since 2020) and Forecasted Estimates (Till 2035)
- 25.6.5. Smart Dust Market in South Korea: Historical Trends (Since 2020) and Forecasted Estimates (Till 2035)
- 25.6.6. Smart Dust Market in Other Asian Countries: Historical Trends (Since 2020) and Forecasted Estimates (Till 2035)
- 25.7. Data Triangulation and Validation
26. MARKET OPPORTUNITIES FOR SMART DUST IN MIDDLE EAST AND NORTH AFRICA (MENA)
- 26.1. Chapter Overview
- 26.2. Key Assumptions and Methodology
- 26.3. Revenue Shift Analysis
- 26.4. Market Movement Analysis
- 26.5. Penetration-Growth (P-G) Matrix
- 26.6. Smart Dust Market in Middle East and North Africa (MENA): Historical Trends (Since 2020) and Forecasted Estimates (Till 2035)
- 26.6.1. Smart Dust Market in Egypt: Historical Trends (Since 2020) and Forecasted Estimates (Till 205)
- 26.6.2. Smart Dust Market in Iran: Historical Trends (Since 2020) and Forecasted Estimates (Till 2035)
- 26.6.3. Smart Dust Market in Iraq: Historical Trends (Since 2020) and Forecasted Estimates (Till 2035)
- 26.6.4. Smart Dust Market in Israel: Historical Trends (Since 2020) and Forecasted Estimates (Till 2035)
- 26.6.5. Smart Dust Market in Kuwait: Historical Trends (Since 2020) and Forecasted Estimates (Till 2035)
- 26.6.6. Smart Dust Market in Saudi Arabia: Historical Trends (Since 2020) and Forecasted Estimates (Till 2035)
- 26.6.7. Smart Dust Market in United Arab Emirates (UAE): Historical Trends (Since 2020) and Forecasted Estimates (Till 2035)
- 26.6.8. Smart Dust Market in Other MENA Countries: Historical Trends (Since 2020) and Forecasted Estimates (Till 2035)
- 26.7. Data Triangulation and Validation
27. MARKET OPPORTUNITIES FOR SMART DUST IN LATIN AMERICA
- 27.1. Chapter Overview
- 27.2. Key Assumptions and Methodology
- 27.3. Revenue Shift Analysis
- 27.4. Market Movement Analysis
- 27.5. Penetration-Growth (P-G) Matrix
- 27.6. Smart Dust Market in Latin America: Historical Trends (Since 2020) and Forecasted Estimates (Till 2035)
- 27.6.1. Smart Dust Market in Argentina: Historical Trends (Since 2020) and Forecasted Estimates (Till 2035)
- 27.6.2. Smart Dust Market in Brazil: Historical Trends (Since 2020) and Forecasted Estimates (Till 2035)
- 27.6.3. Smart Dust Market in Chile: Historical Trends (Since 2020) and Forecasted Estimates (Till 2035)
- 27.6.4. Smart Dust Market in Colombia Historical Trends (Since 2020) and Forecasted Estimates (Till 2035)
- 27.6.5. Smart Dust Market in Venezuela: Historical Trends (Since 2020) and Forecasted Estimates (Till 2035)
- 27.6.6. Smart Dust Market in Other Latin American Countries: Historical Trends (Since 2020) and Forecasted Estimates (Till 2035)
- 27.7. Data Triangulation and Validation
28. MARKET OPPORTUNITIES FOR SMART DUST IN REST OF THE WORLD
- 28.1. Chapter Overview
- 28.2. Key Assumptions and Methodology
- 28.3. Revenue Shift Analysis
- 28.4. Market Movement Analysis
- 28.5. Penetration-Growth (P-G) Matrix
- 28.6. Smart Dust Market in Rest of the World: Historical Trends (Since 2020) and Forecasted Estimates (Till 2035)
- 28.6.1. Smart Dust Market in Australia: Historical Trends (Since 2020) and Forecasted Estimates (Till 2035)
- 28.6.2. Smart Dust Market in New Zealand: Historical Trends (Since 2020) and Forecasted Estimates (Till 2035)
- 28.6.3. Smart Dust Market in Other Countries
- 28.7. Data Triangulation and Validation
29. MARKET CONCENTRATION ANALYSIS: DISTRIBUTION BY LEADING PLAYERS
30. ADJACENT MARKET ANALYSIS
SECTION VII: STRATEGIC TOOLS
31. KEY WINNING STRATEGIES
32. PORTER'S FIVE FORCES ANALYSIS
33. SWOT ANALYSIS
34. VALUE CHAIN ANALYSIS
35. ROOTS STRATEGIC RECOMMENDATIONS
- 35.1. Chapter Overview
- 35.2. Key Business-related Strategies
- 35.2.1. Research & Development
- 35.2.2. Product Manufacturing
- 35.2.3. Commercialization / Go-to-Market
- 35.2.4. Sales and Marketing
- 35.3. Key Operations-related Strategies
- 35.3.1. Risk Management
- 35.3.2. Workforce
- 35.3.3. Finance
- 35.3.4. Others
SECTION VIII: OTHER EXCLUSIVE INSIGHTS
36. INSIGHTS FROM PRIMARY RESEARCH
37. REPORT CONCLUSION
SECTION IX: APPENDIX
38. TABULATED DATA
39. LIST OF COMPANIES AND ORGANIZATIONS
40. CUSTOMIZATION OPPORTUNITIES
41. ROOTS SUBSCRIPTION SERVICES
42. AUTHOR DETAILS
 工业感测器网路市场预测至2034年—按组件、感测器类型、应用和区域分類的全球分析
 工业无线感测网路市场报告:按组件、感测器类型、应用、最终用途和地区划分(2026-2034 年)
 无线感测网路市场分析及预测(至2035年):按类型、产品、服务、技术、组件、应用、部署、最终用户和功能划分智慧微尘市场分析及预测(至2035年):依类型、产品类型、服务、技术、组件、应用、材质、设备及最终使用者划分
 2026年全球无线感测网路网路市场报告
 工业无线感测网路市场 - 全球产业规模、份额、趋势、机会及预测(按感测器、技术、产业垂直领域、地区和竞争格局划分,2021-2031年)
 工业无线感测器网路(IWSN)市场规模、份额和成长分析(按组件、感测器类型、应用、最终用户和地区划分)—2026-2033年产业预测
 智慧灰尘感测器在家庭监测中的市场机会、成长驱动因素、产业趋势分析及预测(2025-2034年)智慧尘埃市场机会、成长动力、产业趋势分析及 2025 - 2034 年预测
 全球智慧尘埃市场:2025年至2030年预测