


 |
市场调查报告书
商品编码
1462795
全球瓦斯表市场(智慧和标准):2024 年第 5 版Gas Meters Smart & Standard Ed 5 2024 |
||||||
价格
简介目录
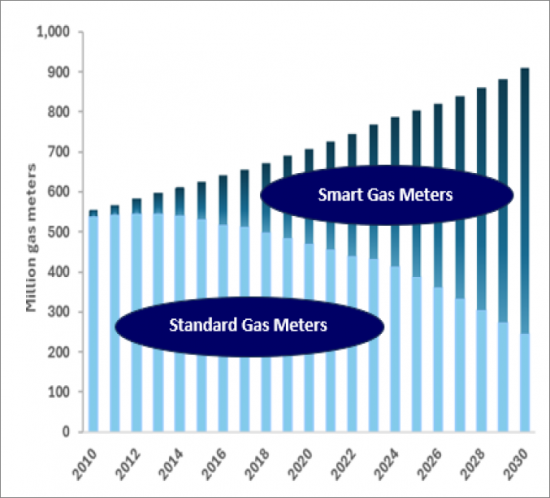
全球瓦斯表市场预计到 2023 年将扩大到 8,080 万台,价值 55 亿美元,2028 年将达到 1.16 亿台。
以下三个因素可以作为推动瓦斯表需求的因素。
- 智慧型瓦斯錶曾落后于智慧电錶,但现在正变得越来越受欢迎。 欧洲、亚太和中亚已确认大规模部署智慧瓦斯表。
- 超音波计量表长期以来一直用于批量计量和託管计量,但其进入住宅市场一直受到价格的阻碍。 这些问题现已解决,该公司准备向目前占主导地位的住宅隔膜表发起课题。 荷兰、美国、加拿大、日本和英国已签署大规模部署合同,也有可能在中国部署。 国际领先製造商已开发出G1.6-16超音波仪表,并获得世界各地监管机构的认证。
- 儘管存在净零目标、绿色活动人士的反对以及风能和太阳能的爆炸性增长,但化石燃料仍然是世界能源的支柱。 天然气的排放量低于煤炭和石油,因此非常适合作为过渡燃料。 在一些最大的市场中,城市燃气分销正处于雄心勃勃的成长轨道上。
本报告分析了全球瓦斯表(智慧表、标准表)市场,并提供了整体销售、销售价值和平均销售价格的趋势预测(所有 42 个国家,2022-2028 年),详细趋势依仪表类型(隔膜式、旋转式、涡轮式、孔板式、超音波式、科氏式、涡流式、MEMS)、主要公司简介和全球市场占有率(前23 名公司)、每个国家的市场概况(产品/公司简介)相关市场(天然气汽车(NGV)、汽车燃气(autogas)、供气基础设施等、需求趋势等)的全面概述。
目录
第 1 章执行摘要
第二章瓦斯表市场状况(2023年)
第三章全球瓦斯表需求(2019-2025)
第三章智慧瓦斯表需求
- 测量技术概述
- 用仪表测量
- 隔膜流量计
- 超音波计
- 智慧电錶
- 对智慧电錶的需求
第四章瓦斯表长期需求趋势
第五章天然气开采、运输与分配
- 气压
- 采矿系统
- 传输系统
- 压实站
- 线路封包
- 门站
- 分销网络
- 最后一哩:将天然气运送到千家万户
第 6 章仪表类型:从 1843 年到未来
- 正气压表
- 隔膜流量计
- 旋转流量计
- 预期米数
- 涡轮流量计
- 孔板流量计
- 超音波流量计
- 家用超音波测量仪
- 智慧型微电脑电錶
- 科氏流量计
- 涡流计
- MEMS(微机电系统)
- 智慧型/进阶仪表
- 通讯模组
- 米尺寸(G)
- 热值
- 氢气混合物
第七章欧洲瓦斯表市场
- 欧洲天然气公司
- 俄罗斯入侵乌克兰对欧洲天然气供应的影响
- 智慧电錶
- 超音波计
- 仪表需求
- 奥地利
- 比利时
- 保加利亚
- 捷克共和国
- 丹麦
- 爱沙尼亚
- 芬兰
- 法国
- 德国
- 希腊
- 匈牙利
- 爱尔兰
- 义大利
- 拉脱维亚
- 立陶宛
- 荷兰
- 波兰
- 葡萄牙
- 罗马尼亚
- 斯洛伐克
- 斯洛维尼亚
- 西班牙
- 瑞典
- 瑞士
- 土耳其
- 英国
第八章独联体国家瓦斯表市场
- 仪表需求
- 俄罗斯
- 乌克兰
- 亚塞拜然
- 哈萨克
- 乌兹别克
第九章中东瓦斯表市场
- 伊朗
第十章非洲瓦斯表市场
- 北非
- 阿尔及利亚
- 埃及
- 撒哈拉以南非洲地区
第11章亚太地区瓦斯表市场
- 亚太地区电錶需求
- 中国
- 澳大利亚
- 印度
- 印尼
- 日本
- 韩国
- 纽西兰
- 巴基斯坦
- 台湾
- 泰国
第十二章北美瓦斯表市场
- 美国
- 加拿大
- 墨西哥
第十三章南美洲瓦斯表市场
- 仪表需求
- 阿根廷
- 巴西
- 智利
- 哥伦比亚
第14章中美洲瓦斯表市场
第 15 章竞争分析、公司概况、市占率
- Elster
- Itron
- Landis+Gyr
- Dresser
- Diehl
- Apator
- Panasonic
- Nicor Gas
- Sagemcom
- Sensus
- Dongfa Group
- Holley
- Qianwei Kromschroder
- Emerson
- DNV GL
第十六章 NGV(天然气汽车)与汽车瓦斯表
- 填充过程
第十七章世界天然气工业的起源
- 电力与天然气
- 能源转型中的天然气
第十八章 瓦斯供应来源、种类及供应量
- 气体类别
- 天然气
- 人工气体
- 焦炉瓦斯
- 液化石油气 (LPG)
- 瓦斯
- 沼气
- 高炉煤气
- 天然气水合物
- 炼厂气
- 合成天然气 (SNG)
- PG 汽油
- 天然气运输及储存
- 管道煤气
- 液化天然气 (LNG)
- 液化石油气 (LPG)
- 压缩天然气 (CNG)
- 分析法
- 安装的瓦斯表数量
- 安装基础
- 对瓦斯表的需求
- 长期需求週期
- 法国年度长期需求趋势:由于智慧瓦斯表的普及而重新测量后
- 短期需求
简介目录
The Gas Meter market rose to 80.8 million meters in 2023 with a value of $5.5 billion and is predicted to reach 116 million meters by 2028.
SAMPLE VIEW
The new edition of Gas Meters Smart & Standard Ed5 2024 has identified three significant factors driving demand.
- Smart gas metering is taking off, after lagging behind electricity smart metering. Large deployments of smart gas meters are identified in Europe, Asia Pacific and Central Asia.
- Ultrasonic meters have long been used for bulk and custody metering but their entry into the residential market has been hampered by price. Costs have now come down and they are poised to challenge the traditional dominance of residential diaphragm meters. Large deployments have been contracted in the Netherlands, in the USA and Canada, in Japan and potentially in the UK, with China simmering. The leading international manufacturers have developed G1.6-16 ultrasonic meters and regulators are accrediting them around the globe.
- Despite net zero targets, opposition from green activists and an explosion of wind power and solar PV, fossil fuels are still the mainstay of global energy. Natural gas is well positioned as a transitional fuel because of lower emissions than coal and oil. City gas distribution is on ambitious growth paths in some of the largest markets.
Market statistics and analysis
- Sales of gas meters for 42 countries, by meter type - basic residential, AMR/AMI, prepayment, communal, communications modules, C&I - units, value, and average selling price, from 2022 to 2028.
- New deployments of smart gas meters, together with suppliers.
- The status of residential ultrasonic metering in relevant markets, deployments and manufacturers.
- The gas metering landscape in 2023 - numbers of population, households, gas consumers, and demand in meters and $ value.
- The major meter technologies described with total market shares; diaphragm, rotary, turbine, orifice and ultrasonic, Coriolis, vortex and MEMS.
- The major customers for gas meters, the gas transmission and distribution utilities in each of the 42 countries profiled, together with their structure.
- The growth of housing units, gas and electricity customers charted for each profiled country, from 1950 to 2030.
- Global market shares with profiles of the top 23 meter manufacturers - Profiles of Elster, Itron, Landis+Gyr, Sensus, Dresser, Diehl, Apator, Panasonic, Nicor Gas, Sagemcom, Sensus, Dongfa Group, Holley, Qianwei Kromschroeder, Emerson.
- The smart meter rollouts are causing fundamental changes in the demand cycle for meters.
- The NGV and autogas segment is reviewed, a small but growing segment for gas meters, with numbers and metering technology.
- Gas supply infrastructure outlined, which meters required for each function.
TABLE OF CONTENTS
1. EXECUTIVE SUMMARY
- 1. Natural das in the transition to net zero
- 2. Smart gasmeters
- 3. Ultrasonic residential gas meters
- Long-term annual demand trend with continuation of basic diaphragm meters, France, 1900-2050.
- Turndown ratio and rangeability
- Split between residential and C&I meter sales
- Competitive landscape
- Market shares of gas meter manufacturers in value 2023.
- Meter types
- Gas sources, types and delivery
- The origins of the global gas industry
- Electricity versus Gas
2. THE GAS METERING LANDSCAPE IN 2023
3. WORLD DEMAND FOR GAS METERS FROM 2019 TO 2025
3. DEMAND FOR SMART GAS METERS
- Introduction to metering technology
- Meter measurement
- Diaphragm meters
- Ultrasonic meters
- Smart metering
- Smart meter demand
4. LONG-TERM DEMAND TREND FOR GAS METERS
- Demand
5. GAS GATHERING, TRANSMISSION, DISTRIBUTION
- Gas pressure
- The gathering system
- The transmission system
- Compressor stations
- Line pack
- Gate stations
- The distribution network
- The last mile, moving natural gas into the home
6. METER TYPES FROM 1843 TO THE FUTURE
- POSITIVE DISPLACEMENT GAS METERS
- Diaphragm meters
- Rotary meters
- INFERENTIAL METERS
- Turbine meters
- Orifice meters
- Ultrasonic flow meters
- Residential ultrasonic meters
- Intelligent Micom meters
- Coriolis meters
- Vortex meters
- MEMS (Micro-Electro-Mechanical System)
- Smart/advanced meters
- Communication module
- Meter sizes - G
- Heating value
- Hydrogen blending
7. THE GAS METER MARKET IN EUROPE
- Establishment of gas in Europe
- The impact on the natural gas supply in Europe of the Russian war in Ukraine
- Smart meters
- Ultrasonic meters
- Meter demand
- AUSTRIA
- Smart meters
- Meter demand
- BELGIUM
- Smart meters
- Meter demand
- BULGARIA
- CZECH REPUBLIC
- DENMARK
- Smart meters
- Danish meter companies
- Ultrasonic meters
- Meter demand
- ESTONIA
- Smart meters
- Meter demand
- FINLAND
- Smart meters
- Meter demand
- FRANCE
- Smart meters
- Ultrasonic gas meters
- Meter demand
- GERMANY
- Smart meters
- Ultrasonic meters
- Meter demand
- GREECE
- Smart meters
- Meter demand
- HUNGARY
- Smart meters
- Meter demand
- IRELAND
- Smart meters
- Meter demand
- ITALY
- Smart meters
- Ultrasonic meters
- Meter demand
- LATVIA
- Smart meters
- Meter demand
- LITHUANIA
- Smart meters
- Meter demand
- NETHERLANDS
- Smart meters
- Ultrasonic gas meters
- Meter demand
- POLAND
- Smart meters
- Meter demand
- PORTUGAL
- Smart meters
- Meter demand
- ROMANIA
- Smart meters
- Meter demand
- SLOVAK REPUBLIC
- Smart meters
- SLOVENIA
- Smart meters
- SPAIN
- Smart meters
- Meter demand
- SWEDEN
- Smart meters
- Meter demand
- SWITZERLAND
- Smart meters
- Meter demand
- TURKEY
- Prepayment gas meters
- Smart meter progress
- Meter demand
- UNITED KINGDOM
- Certification
- Remanufacturing meters for the secondary or sub-metering market
- Smart meters
- Smart meter failures
- Pulse transmission of data for AMR
- Ultrasonic gas meters
8. THE GAS METER MARKET IN THE CIS
- Meter demand
- RUSSIA
- Smart meters
- Meter demand
- Meter manufacturers
- UKRAINE
- Meter production and manufacturers
- Smart meters
- Meter demand
- AZERBAIJAN
- Smart meters
- KAZAKHSTAN
- Smart meters
- UZBEKISTAN
- Smart meters
9. THE GAS METER MARKET IN THE MIDDLE EAST
- IRAN
- Meter demand
- Meter manufacturers
10. THE GAS METER MAKET IN AFRICA
- NORTH AFRICA
- Meter demand
- ALGERIA
- Meter demand
- Meter manufacturers
- EGYPT
- Meter demand
- Meter manufacturers
- SUB-SAHARAN AFRICA
11. THE GAS METER MARKET IN ASIA PACIFIC
- Meter demand Asia Pacific
- CHINA
- The development of distributed gas in China
- Manufactured gas
- LPG
- Natural gas
- City Gas players
- Smart meter progress
- Meter demand
- Meter manufacturers
- AUSTRALIA
- Smart meters
- Meter demand
- INDIA
- Historical development of City Gas Distribution
- Recent developments in the City Gas sector
- Smart meter progress
- Meter demand
- Gas meter companies
- INDONESIA
- Smart meters
- Meter demand
- JAPAN
- The intelligent Micom gas meter
- Ultrasonic intelligent gas meter
- Smart meters
- LPG meters
- Meter demand
- Meter manufacturers
- SOUTH KOREA
- Smart meters
- NEW ZEALAND
- Smart meter progress
- Meter demand
- PAKISTAN
- Meter demand
- Meter manufacturers
- TAIWAN
- Smart meters
- Meter demand
- Meter manufacturers
- THAILAND
12. THE GAS METER MARKET IN NORTH AMERICA
- UNITED STATES
- Gas industry structure
- Smart meters
- Ultrasonic meters
- Meter demand
- Meter manufacturers
- CANADA
- Smart meters
- Ultrasonic meters
- Meter demand
- MEXICO
- Meter demand
13. THE GAS METER MARKET IN SOUTH AMERICA
- Meter demand
- ARGENTINA
- Meter demand
- BRAZIL
- Meter demand
- CHILE
- Meter demand
- COLOMBIA
- Meter demand
14. THE GAS METER MARKET IN CENTRAL AMERICA
15. COMPETITIVE ANALYSIS, COMPANY PROFILES AND MARKET SHARES
- Elster
- Itron
- Landis+Gyr
- Dresser
- Diehl
- Apator
- Panasonic
- Nicor Gas
- Sagemcom
- Sensus
- Dongfa Group
- Holley
- Qianwei Kromschroder
- Emerson
- DNV GL
16. NGV and AUTOGAS METERING
- The filling process
17. THE ORIGINS OF THE GLOBAL GAS INDUSTRY
- Electricity versus Gas
- Natural gas in the energy transition
18. GAS SOURCES, TYPES AND DELIVERY
- GAS CATEGORIES
- Natural gas
- Manufactured gas
- Coke-oven gas
- 4. Liquefied petroleum gas (LPG)
- Coal gas
- Biogas
- Blast furnace gas
- Gas hydrates
- Refinery gas
- Syngas - SNG
- PG Autogas
- GAS DELIVERY AND STORAGE
- Piped gas
- Natural gas liquids, Liquefied Natural Gas (LNG)
- Liquefied petroleum gas (LPG)
- Compressed natural gas (CNG)
- METHODOLOGY
- Installed base of gas meters
- Installed base
- Demand for gas meters
- Long term demand cycle
- Long-term annual demand trend in France, reconfigured by the deployment of smart gas meters.
- Short term demand
Figures
- Figure 1: The global installed base of households with electricity and gas, 1900-2050
- Figure 2: Households with access to gas by region, 1900-2025.
- Figure 3: Long-term annual demand trend of basic diaphragm meters, France, 1900-2050.
- Figure 4: Long-term annual demand trend, reconfigured by the deployment of smart gas meters in a short rollout without periodic upgrading, France, 1900-2050.
- Figure 5: Gas gathering, transmission and distribution systems.
- Figure 6: The world's major gas transmission and distribution networks in km, 2018 and 2021.
- Figure 7: The European gas grid in 1965.
- Figure 8: The European gas grid in 2018.
- Figure 9: Natural gas pipeline flows into Europe from Russia since January 2022.
- Figure 10: Numbers of housing units, all gas and residential gas consumers, Europe,1900-2050.
- Figure 11: Numbers of metered users of gas, Europe, thousands, 2023
- Figure 12: Numbers of housing units, electricity and gas consumers, Austria, 1950-2030.
- Figure 13: Numbers of housing units, gas and electricity consumers, Belgium, 1950-2030.
- Figure 14: Numbers of housing units, gas and electricity consumers, Bulgaria, 1950-2050.
- Figure 15: Numbers of housing units, gas and electricity consumers, Czech Republic, 1950-2030.
- Figure 16: Numbers of housing units, gas and electricity consumers, Denmark, 1950-2020.
- Figure 17: Numbers of housing units, gas and electricity consumers, Estonia, 1900-2030.
- Figure 18: Numbers of housing units, gas and electricity consumers, Finland, 1900-2030.
- Figure 19: Household penetration of manufactured gas, natural gas and LPG in France, 1900-2030.
- Figure 20: Gazpar smart gas meter.
- Figure 21: Household penetration of manufactured gas, natural gas and LPG in Germany, 1900-2030.
- Figure 22: Numbers of housing units, gas and electricity consumers, Greece, 1950-2030.
- Figure 23: Numbers of housing units, gas and electricity consumers, Hungary, 1950-2030.
- Figure 24: Numbers of housing units, gas and electricity consumers, Ireland, 1950-2030.
- Figure 25: Household penetration of manufactured gas, natural gas and LPG in Italy, 1900-2030.
- Figure 26: Numbers of housing units, gas and electricity consumers, Latvia, 1950-2030.
- Figure 27: Numbers of housing units, gas and electricity consumers, Lithuania, 1950-2030.
- Figure 28: Numbers of housing units, gas and electricity consumers, Netherlands, 1950-2030.
- Figure 29: Numbers of housing units, gas and electricity consumers, Poland, 1950-2030.
- Figure 30: Annual demand trend for gas meters, IGC and residential, in units, $ value, with average selling price per meter, Poland, 2019-2025.
- Figure 31: Numbers of housing units, gas and electricity consumers, Portugal, 1950-2030.
- Figure 32: Numbers of housing units, gas and electricity consumers, Romania, 1950-2030.
- Figure 33: Numbers of housing units, gas and electricity consumers, Slovak Republic 1950-2030.
- Figure 34: Numbers of housing units, gas and electricity consumers, Slovenia, 1950-2030.
- Figure 35: Numbers of housing units, gas and electricity consumers, Spain, 1950-2030.
- Figure 36: Numbers of housing units, gas and electricity consumers, Sweden, 1950-2030.
- Figure 37: Numbers of housing units, gas and electricity consumers, Switzerland, 1950-2030.
- Figure 38: Numbers of housing units, gas and electricity consumers, Turkey, 1950-2030.
- Figure 39: Household penetration of manufactured gas, natural gas and LPG in the UK, 1900-2030.
- Figure 40: The impact of Covid 19 on the smart meter rollout in the UK for domestic smart meters.
- Figure 41: Numbers of housing units, all gas and residential consumers, CIS, 1950-2030.
- Figure 42: Household penetration of manufactured gas, natural gas and LPG in Russia, 1900-2030.
- Figure 43: Numbers of housing units, gas and electricity consumers, Russia, 1950-2030.
- Figure 44: Numbers of housing units, electricity and gas consumers, Azerbaijan, 1950-2030.
- Figure 45: Numbers of housing units, electricity and gas consumers, Kazakhstan, 1950-2030.
- Figure 46: Numbers of housing units, all gas and residential consumers, Middle East, 1950-2030.
- Figure 47: Numbers of housing units, electricity and gas consumers, North Africa, 1950-2030.
- Figure 48: Numbers of housing units, electricity and gas consumers, Algeria, 1950-2030.
- Figure 49: Numbers of housing units, electricity and gas consumers, Egypt, 1950-2030.
- Figure 50: Numbers of housing units, electricity and gas consumers, Sub-Saharan Africa, 1950-2030.
- Figure 51: Numbers of housing units, electricity and gas consumers, Asia-Pacific not inc. China, 1950-2030.
- Figure 52: Length of pipeline networks for Manufactured Gas, LPG and Natural Gas in China, 1978-2015.
- Figure 53: Numbers of households, PNGand manufactured gas and cylinder LPG, China, 2000-2030.
- Figure 54: Numbers of housing units, electricity and gas consumers, Australia, 1950-2030.
- Figure 55: City Gas Distribution rounds of bidding, 2008-2921.
- Figure 56: Numbers of housing units, electricity and gas consumers, India, 1950-2030.
- Figure 57: Numbers of housing units, electricity and gas consumers, Indonesia, 1950-2030.
- Figure 58: Household penetration of manufactured gas, natural gas and LPG in Japan, 1900-2030.
- Figure 59: Micom, conventional diaphragm intelligent gas meter.
- Figure 60 : Ultrasonic gas meter.
- Figure 61: Numbers of housing units, all gas and residential consumers, South Korea, 2000-2030.
- Figure 62: Numbers of housing units, electricity and gas consumers, New Zealand, 1950-2030.
- Figure 63: Numbers of housing units, electricity and gas consumers, Pakistan, 1950-2030.
- Figure 64: Numbers of housing units, electricity and gas consumers, Taiwan, 1950-2030.
- Figure 65: Household penetration of manufactured gas, natural gas and LPG in the USA, 1900-2030.
- Figure 66: Numbers of housing units, electricity and gas consumers, Canada, 1950-2030.
- Figure 67: Numbers of housing units, electricity and gas consumers, Mexico, 1950-2030.
- Figure 68: Numbers of housing units, electricity and gas consumers, Brazil, 1950-2030.
- Figure 69: Numbers of housing units, electricity and gas consumers, Chile, 1950-2030.
- Figure 70: Numbers of housing units, electricity and gas consumers, Columbia, 1950-2030.
- Figure 71: Numbers of housing units, all gas and residential consumers, Central America, 1900-2020.
- Figure 72: Market shares of gas meter manufacturers in value 2023.
- Figure 73: Timeline of global gas and electricity distribution.
Tables
- Table 1: Demographics, gas consumers and demand for gas meters in units and $ value, by region 2023.
- Table 2: Demographics, gas consumers and demand for gas meters in units and $ value, by country 2023.
- Table 3: Demand trend for gas meters, IGC and residential,in units, $ value, selected countries, 2022-2028.
- Table 4: Demand for gas meters in units, by region and country, 2018-2028..
- Table 5 Demand for gas meters in $ value, by region and country, 2018-28
- Table 6: Demand for smart gas meters in units by country, 2018 to 2028
- Table 7: Changes in the demand cycles for gas meter markets by country.
- Table 8: Typical turndown ratios of gas meter types.
- Table 9: G number for flow rates of gas metres
- Table 10: Basic population and gas statistics, Europe.
- Table 11: The status of smart gas metering in Europe, 2023.
- Table 12: Annual demand trend for gas meters, IGC and residential, in units, $ value, with average selling price per meter, Europe, 2022-28.
- Table 13: Basic population and gas statistics, Austria.
- Table 14: Annual demand trend for gas meters, IGC and residential, in units, $ value, with average selling price per meter, Austria, 2022-2028.
- Table 15: Basic population and gas statistics, Belgium.
- Table 16: Annual demand trend for gas meters, IGC and residential, in units, $ value, with average selling price per meter, Belgium, 2022-2028.
- Table 17 : Basic population and gas statistics, Bulgaria.
- Table 18: Basic population and gas statistics, Czech Republic.
- Table 19: Annual demand trend for gas meters, IGC and residential, in units, $ value, with average selling price per meter, Czech Republic, 2022-2028.
- Table 20: Basic population and gas statistics, Denmark.
- Table 21: Annual demand trend for gas meters, IGC and residential, in units, $ value, with average selling price per meter, Denmark, 2022-2028.
- Table 22: Basic population and gas statistics, Estonia.
- Table 23: Basic population and gas statistics, Finland.
- Table 24: Basic population and gas statistics, France.
- Table 25: Annual demand trend for gas meters, IGC and residential, in units, $ value, with average selling price per meter, France, 2022-2028.
- Table 26: Basic population and gas statistics, Germany.
- Table 27: Gas meters in use in Germany by type.
- Table 28: Annual demand trend for gas meters, IGC and residential, in units, $ value, with average selling price per meter, Germany, 2022-2028.
- Table 29: Basic population and gas statistics, Greece.
- Table 30: Annual demand trend for gas meters, IGC and residential, in units, $ value, with average selling price per meter, Greece, 2022-2028.
- Table 31: Basic population and gas statistics, Hungary.
- Table 32: Annual demand trend for gas meters, IGC and residential, in units, $ value, with average selling price per meter, Hungary, 2022-2028.
- Table 33: Basic population and gas statistics, Ireland.
- Table 34: Annual demand trend for gas meters, IGC and residential, in units, $ value, with average selling price per meter, Ireland, 2022-2028.
- Table 35: Basic population and gas statistics, Italy.
- Table 36: Annual demand trend for gas meters, IGC and residential, in units, $ value, with average selling price per meter, Italy, 2022-2028.
- Table 37: Basic population and gas statistics, Latvia
- Table 38: Annual demand trend for gas meters, IGC and residential, in units, $ value, with average selling price per meter, Latvia, 2022-2028.
- Table 39: Basic population and gas statistics, Lithuania.
- Table 40: Annual demand trend for gas meters, IGC and residential, in units, $ value, with average selling price per meter, Lithuania, 2022-2028.
- Table 41: Basic population and gas statistics, Netherlands.
- Table 42: Annual demand trend for gas meters, IGC and residential, in units, $ value, with average selling price per meter, Netherlands, 2022-28.
- Table 43: Basic population and gas statistics, Poland.
- Table 44: Basic population and gas statistics, Portugal.
- Table 45: Annual demand trend for gas meters, IGC and residential, in units, $ value, with average selling price per meter, Portugal, 2022-2028.
- Table 46: Basic population and gas statistics, Romania.
- Table 47: Annual demand trend for gas meters, IGC and residential, in units, $ value, with average selling price per meter, Romania, 2022-2028.
- Table 48: Basic population and gas statistics, Slovak Republic.
- Table 49 : Annual demand trend for gas meters, IGC and residential, in units, $ value, with average selling price per meter, Slovak Republic, 2022-2028.
- Table 50: Basic population and gas statistics, Slovenia.
- Table 51: Annual demand trend for gas meters, IGC and residential, in units, $ value, with average selling price per meter, Slovenia, 2022-2028.
- Table 52: Basic population and gas statistics, Spain.
- Table 53: Annual demand trend for gas meters, IGC and residential, in units, $ value, with average selling price per meter, Spain, 2022-2028.
- Table 54: Basic population and gas statistics, Sweden.
- Table 55: Basic population and gas statistics, Switzerland.
- Table 56: Annual demand trend for gas meters, IGC and residential, in units, $ value, with average selling price per meter, Switzerland, 2022-2028.
- Table 57: Basic population and gas statistic, Turkey.
- Table 58: Annual demand trend for gas meters, IGC and residential, in units, $ value, with average selling price per meter, Turkey, 2022-2028.
- Table 59: Basic population and gas statistics, United Kingdom.
- Table 60: Annual demand trend for gas meters, IGC and residential, in units, $ value, with average selling price per meter, United Kingdom, 2022-2028.
- Table 61: Basic population and gas statistics, CIS.
- Table 62: Annual demand trend for gas meters, IGC and residential, in units, $ value, with average selling price per meter, CIS, 2022-2028.
- Table 63: Basic population and gas statistics, Russia.
- Table 64: Annual demand trend for gas meters, IGC and residential, in units, $ value, with average selling price per meter, Russia, 2022-2028.
- Table 65: Basic population and gas statistics, Ukraine.
- Table 66: Annual demand trend for gas meters, IGC and residential, in units, $ value, with average selling price per meter, Ukraine, 2022-2028.
- Table 67: Basic population and gas statistics, Azerbaijan.
- Table 68: Annual demand trend for gas meters, IGC and residential, in units, $ value, with average selling price per meter, Azerbaijan, 2022-2028.
- Table 69: Basic population and gas statistics, Kazakhstan.
- Table 70: Annual demand trend for gas meters, IGC and residential, in units, $ value, with average selling price per meter, Kazakhstan, 2022-2028.
- Table 71: Basic population and gas statistics, Uzbekistan.
- Table 72: Numbers of housing units, electricity and gas consumers, Uzbekistan, 1950-2030.
- Table 73: Annual demand trend for gas meters, IGC and residential, in units, $ value, with average selling price per meter, Uzbekistan, 2022-2028.
- Table 74: Basic population and gas statistics, Middle East.
- Table 75: Annual demand trend for gas meters, IGC and residential, in units, $ value, with average selling price per meter, Middle East, 2022-2028
- Table 76: Basic population and gas statistics, Iran.
- Table 77: Annual demand trend for gas meters, IGC and residential, in units, $ value, with average selling price per meter, Iran, 2022-2028.
- Table 78: Basic population and gas statistics, North Africa
- Table 79: Annual demand trend for gas meters, IGC and residential, in units, $ value, with average selling price per meter, North Africa, 2022-2028.
- Table 80: Basic population and gas statistics, Algeria.
- Table 81: Annual demand trend for gas meters, IGC and residential, in units, $ value, with average selling price per meter, Algeria, 2022-2028.
- Table 82: Basic population and gas statistics, Egypt.
- Table 83: Annual demand trend for gas meters, IGC and residential, in units, $ value, with average selling price per meter, Egypt, 2022-2028.
- Table 84: Basic population and gas statistics, sub-Saharan Africa.
- Table 85: Basic population and gas statistics, Asia Pacific not including China.
- Table 86: Annual demand trend for gas meters, IGC and residential, in units, $ value, with average selling price per meter, Asia Pacific not including China, 2022-2028.
- Table 87: Basic population and gas statistics, China.
- Table 88: Five leading city gas distributors in China
- Table 89: Annual demand trend for gas meters, IGC and residential, in units, $ value, with average selling price per meter, China, 2022-2028.
- Table 90: Leading gas meter manufacturers in China
- Table 91: Basic population and gas statistics, Australia.
- Table 92: Annual demand trend for gas meters, IGC and residential, in units, $ value, with average selling price per meter, Australia, 2022-2028.
- Table 93: Basic population and gas statistics, India.
- Table 94: Annual demand trend for gas meters, IGC and residential, in units, $ value, with average selling price per meter, India, 2022-2028.
- Table 95: Basic population and gas statistics, Indonesia.
- Table 96: Annual demand trend for gas meters, IGC and residential, in units, $ value, with average selling price per meter, Indonesia, 2022-2028.
- Table 97: Basic population and gas statistics, Japan.
- Table 98: Annual demand trend for gas meters, IGC and residential, in units, $ value, with average selling price per meter, Japan, 2022-2028.
- Table 99: Basic population and gas statistics, South Korea.
- Table 100: Annual demand trend for gas meters, IGC and residential, in units, $ value, with average selling price per meter, Korea, 2022-2028.
- Table 101: Basic population and gas statistics, New Zealand.
- Table 102: Annual demand trend for gas meters, IGC and residential, in units, $ value, with average selling price per meter, New Zealand, 2022-2028.
- Table 103: Basic population and gas statistics, Pakistan.
- Table 104: Annual demand trend for gas meters, IGC and residential, in units, $ value, with average selling price per meter, Pakistan, 2022-2028.
- Table 105: Basic population and gas statistics, Taiwan.
- Table 106: Annual demand trend for gas meters, IGC and residential, in units, $ value, with average selling price per meter, Taiwan, 2022-2028.
- Table 107: Basic population and gas statistics, Thailand.
- Table 108: Basic population and gas statistics, United States.
- Table 109: Annual demand trend for gas meters, IGC and residential, in units, $ value, with average selling price per meter, United States, 2022-2028.
- Table 110: Basic population and gas statistics, Canada.
- Table 111: Annual demand trend for gas meters, IGC and residential, in units, $ value, with average selling price per meter, Canada, 2022-2028.
- Table 112: Basic population and gas statistics, Mexico.
- Table 113: Annual demand trend for gas meters, IGC and residential, in units, $ value, with average selling price per meter, Mexico, 2022-2028.
- Table 114: Basic population and gas statistics, South America.
- Table 115: Annual demand trend for gas meters, IGC and residential, in units, $ value, with average selling price per meter, selected countries in South America 2022-2028.
- Table 116: Basic population and gas statistics, Argentina.
- Table 117: Numbers of housing units, electricity and gas consumers, Argentina, 1950-2030.
- Table 118: Annual demand trend for gas meters, IGC and residential, in units, $ value, with average selling price per meter, Argentina, 2022-2028.
- Table 119: Basic population and gas statistics, Brazil.
- Table 120: Annual demand trend for gas meters, IGC and residential, in units, $ value, with average selling price per meter, Brazil, 2022-2028.
- Table 121: Basic population and gas statistics, Chile.
- Table 122: Annual demand trend for gas meters, IGC and residential, in units, $ value, with average selling price per meter, Chile, 2022-2028.
- Table 123: Basic population and gas statistics, Colombia.
- Table 124: Annual demand trend for gas meters, IGC and residential, in units, $ value, with average selling price per meter, Columbia, 2022-2028.
- Table 125: Basic population and gas statistics, Central America (excluding Mexico) , 2013
02-2729-4219
+886-2-2729-4219
 旋转式燃气表市场:2026-2032年全球市场预测(按应用、最终用户、功能、仪表类型、压力等级、流量、安装方式和精度等级划分)涡轮燃气表市场:2026-2032年全球市场预测(按应用、最终用途、技术类型、安装方式和通路划分)
 2026年全球旋转式燃气表市场报告2026年全球燃气表市场报告
 燃气表市场机会、成长要素、产业趋势分析及预测(2026年至2035年)
 全球湿式气体流量计市场:市场规模、占有率、成长率、产业分析、依类型、应用和地区划分的考量、未来预测(2026-2034)
 瓦斯表市场 - 全球产业规模、份额、趋势、机会和预测(按技术、应用、类型、地区和竞争格局划分,2021-2031 年预测)
 燃气表市场规模、份额及成长分析(按类型、应用和地区划分)-2026-2033年产业预测
 燃气表:全球市场占有率和排名、总销售量和需求预测(2025-2031年)
 AMI燃气表的全球市场
▼