


 |
市场调查报告书
商品编码
1344342
氢市场:依供应方式、类型、最终用途:2023-2032 年全球机会分析与产业预测Hydrogen Market By Delivery Mode (Captive, Merchant), By Type (Blue Hydrogen, Grey Hydrogen, Green Hydrogen), By End Use (Refining, Power Generation, Transportation, Food Processing, Others): Global Opportunity Analysis & Industry Forecast, 2023-2032 |
||||||
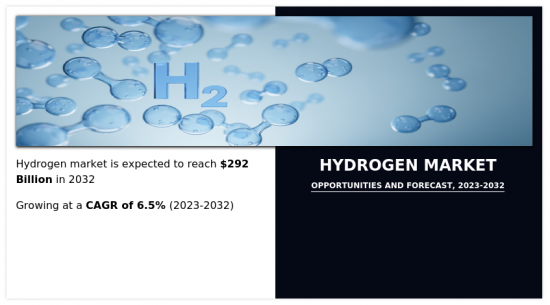
根据Allied Market Research发布的研究报告《氢能市场》,2022年氢能市场价值将达到1559亿美元,2023年至2032年复合年增长率为6.5%,2032年将达到2920亿美元.预计达到。
氢气有多种用途,用于各个产业。 它通常用作发电和运输的燃料。 当在燃料电池中与氧气结合时,氢气可以发电,同时仅排放水蒸气。 在化学工业中,它用于生产氨、甲醇和其他重要化合物。 此外,氢气在冶金、石油精炼和多种工业过程中用作还原剂。
发电中对氢的需求不断增加预计将推动未来几年的市场成长。 氢被认为是发电脱碳的关键元素。 透过使用氢气作为燃料,发电厂可以显着减少温室气体排放。 这是因为氢在燃料电池中的燃烧和使用仅产生水蒸气作为单独的产物。 这使得氢成为化石燃料发电的可行替代品,并有助于缓解气候变迁。
此外,氢气可以以多种方式使用,为发电提供了灵活性。 它可以直接在燃气涡轮机中燃烧,也可以在燃料电池中有效产生。 此外,氢气还可用于热电联产(CHP)系统,其中发电产生的废热可回收并用于空间加热或工业製程,从而提高整体能源效率。
此外,氢能在电网平衡和储能方面发挥重要作用。 可以利用风能和太阳能等再生能源产生的剩余电力透过电解生产氢气。 透过储存氢气,可以在再生能源发电量较低或需求较高时用于发电。 这使得间歇性再生能源併入电网成为可能,有助于稳定电力供应。
混合发电厂,也称为 "power-to-X" 设施,将再生能源发电与氢气生产和利用结合。 这些设施可以利用剩余的再生能源生产氢气,用于发电、运输和其他用途。 混合发电厂提供了一种充分利用再生能源并在不同能源部门之间建立共生关係的方法。 氢气也可以与天然气混合,用作传统燃气涡轮机和联合循环发电厂的燃料。 这种称为共烧的方法可以使氢气逐渐融入现有的天然气基础设施和发电系统中。 混烧有助于减少排放,同时利用现有发电资产。
目录
第一章简介
第 2 章执行摘要
第三章市场概述
- 市场定义和范围
- 主要发现
- 影响因素
- 主要投资机会
- 波特五力分析
- 供应商议价能力低
- 新进入者的威胁较低
- 替代品威胁低
- 竞争强度低
- 买方的议价能力较低
- 市场动态
- 促进因素
- 燃料电池电动车越来越多地使用氢
- 增加氢气在发电量的使用
- 抑制因素
- 与氢气生产相关的高成本
- 机会
- 对清洁能源的需求不断增加
- 促进因素
- 新冠肺炎 (COVID-19) 造成的市场影响分析
- 主要监理分析
- 价格分析
- 专利情况
第 4 章氢市场:依供应形式
- 俘虏
- 贸易公司
第 5 章氢市场:依类型
- 蓝色氢
- 灰氢
- 绿氢
第 6 章氢市场:依最终用途划分
- 细化
- 发电
- 交通
- 食品加工
- 其他
第 7 章氢市场:依地区
- 北美
- 美国
- 加拿大
- 墨西哥
- 欧洲
- 德国
- 法国
- 义大利
- 英国
- 西班牙
- 欧洲其他地区
- 亚太地区
- 中国
- 印度
- 日本
- 韩国
- 澳大利亚
- 其他亚太地区
- 拉丁美洲/中东/非洲
- 巴西
- 沙乌地阿拉伯
- 南非
- 其他领域
第八章竞争态势
- 简介
- 关键成功策略
- 10家主要公司的产品图谱
- 竞争对手仪表板
- 竞争热图
- 2022 年主要公司的定位
第九章公司简介
- Air Liquide S.A.
- Messer Group GmbH.
- Plug Power Inc.
- NEL ASA
- Linde plc
- FuelCell Energy, Inc.
- Air Products and Chemicals, Inc.
- Shell Plc.
- Reliance Industries Ltd
- Indian Oil Corporation Ltd.
According to a new report published by Allied Market Research, titled, "Hydrogen Market," The hydrogen market was valued at $155.9 billion in 2022, and is estimated to reach $292.0 billion by 2032, growing at a CAGR of 6.5% from 2023 to 2032.
Hydrogen has numerous applications and is utilized in various industries. It is commonly used as a fuel for power generation and transportation. When combined with oxygen in a fuel cell, hydrogen can produce electricity while emitting only water vapor as a byproduct. It is used in the chemical industry for manufacturing ammonia, methanol, and other important compounds. In addition, hydrogen is employed in metallurgy, petroleum refining, and as a reducing agent in several industrial processes.
Growing demand for hydrogen in power generation is anticipated to drive the market growth in coming years. Hydrogen is considered a key element in the decarbonization of power generation. By using hydrogen as a fuel, power plants can significantly reduce greenhouse gas emissions, as the combustion or use of hydrogen in fuel cells only produces water vapor as a byproduct. This makes hydrogen a viable option for replacing fossil fuels in power generation, thereby helping to mitigate climate change.
Moreover, hydrogen offers flexibility in power generation as it can be used in various ways. It can be burned directly in a gas turbine or used in fuel cells to produce electricity with high efficiency. In addition, hydrogen can be utilized in combined heat and power (CHP) systems, where waste heat from power generation can be captured and used for heating or industrial processes, increasing overall energy efficiency.
Further, hydrogen can play a crucial role in grid balancing and energy storage. Excess electricity generated from renewable sources, such as wind or solar power, can be used to produce hydrogen through electrolysis. The hydrogen can be stored and later used for power generation when renewable energy generation is low or demand is high. This enables the integration of intermittent renewable energy sources into the grid and helps to stabilize electricity supply.
Hybrid power plants, also known as "power-to-X" facilities, combine renewable energy generation with hydrogen production and utilization. These facilities use excess renewable energy to produce hydrogen, which can then be used for power generation, transportation, or other applications. Hybrid power plants offer a way to maximize the utilization of renewable energy and create a symbiotic relationship between different energy sectors. Also, hydrogen can be blended with natural gas and used as a fuel in conventional gas turbines or combined-cycle power plants. This approach, known as co-firing, allows gradual integration of hydrogen into existing natural gas infrastructure and power generation systems. Co-firing can help reduce emissions while utilizing existing power generation assets.
The hydrogen market is segmented on the basis of delivery mode, type, end-use, and region. By delivery mode, the market is classified into captive and merchant. By type, the market is categorized into blue hydrogen, grey hydrogen, and green hydrogen. By end-use, the market is divided into refining, power generation, transportation, food processing, and others. By region, the market is analyzed across North America, Europe, Asia-Pacific, and LAMEA.
The report covers strategies adopted by key players in the market to sustain the competitive environment and increase their market share. The key players operating in the hydrogen market include Air Liquide S.A.; Messer Group GmbH.; Plug Power Inc.; NEL ASA; Linde plc; FuelCell Energy, Inc.; Air Products and Chemicals, Inc.; Shell Plc.; Reliance Industries Ltd; and Indian Oil Corporation Ltd. In addition, the market drivers, restraints, and opportunities are explained in the report.
Key Benefits For Stakeholders
- This report provides a quantitative analysis of the market segments, current trends, estimations, and dynamics of the hydrogen market analysis from 2022 to 2032 to identify the prevailing hydrogen market opportunities.
- The market research is offered along with information related to key drivers, restraints, and opportunities.
- Porter's five forces analysis highlights the potency of buyers and suppliers to enable stakeholders make profit-oriented business decisions and strengthen their supplier-buyer network.
- In-depth analysis of the hydrogen market segmentation assists to determine the prevailing market opportunities.
- Major countries in each region are mapped according to their revenue contribution to the global market.
- Market player positioning facilitates benchmarking and provides a clear understanding of the present position of the market players.
- The report includes the analysis of the regional as well as global hydrogen market trends, key players, market segments, application areas, and market growth strategies.
Key Market Segments
By Delivery Mode
- Captive
- Merchant
By Type
- Blue Hydrogen
- Grey Hydrogen
- Green Hydrogen
By End Use
- Refining
- Power Generation
- Transportation
- Food Processing
- Others
By Region
- North America
- U.S.
- Canada
- Mexico
- Europe
- Germany
- France
- Italy
- UK
- Spain
- Rest of Europe
- Asia-Pacific
- China
- India
- Japan
- South Korea
- Australia
- Rest of Asia-Pacific
- LAMEA
- Brazil
- Saudi Arabia
- South Africa
- Rest of LAMEA
Key Market Players:
- Air Liquide S.A.
- Air Products and Chemicals, Inc.
- FuelCell Energy, Inc.
- Indian Oil Corporation Ltd.
- Linde plc
- Messer Group GmbH.
- NEL ASA
- Plug Power Inc.
- Reliance Industries Ltd
- Shell Plc.
TABLE OF CONTENTS
CHAPTER 1: INTRODUCTION
- 1.1. Report description
- 1.2. Key market segments
- 1.3. Key benefits to the stakeholders
- 1.4. Research Methodology
- 1.4.1. Primary research
- 1.4.2. Secondary research
- 1.4.3. Analyst tools and models
CHAPTER 2: EXECUTIVE SUMMARY
- 2.1. CXO Perspective
CHAPTER 3: MARKET OVERVIEW
- 3.1. Market definition and scope
- 3.2. Key findings
- 3.2.1. Top impacting factors
- 3.2.2. Top investment pockets
- 3.3. Porter's five forces analysis
- 3.3.1. Low bargaining power of suppliers
- 3.3.2. Low threat of new entrants
- 3.3.3. Low threat of substitutes
- 3.3.4. Low intensity of rivalry
- 3.3.5. Low bargaining power of buyers
- 3.4. Market dynamics
- 3.4.1. Drivers
- 3.4.1.1. Rising use of hydrogen in fuel cell electric vehicles
- 3.4.1.2. Increase in adoption of hydrogen in power generation
- 3.4.1. Drivers
- 3.4.2. Restraints
- 3.4.2.1. High cost associated with hydrogen production
- 3.4.3. Opportunities
- 3.4.3.1. Increase in demand for clean energy
- 3.5. COVID-19 Impact Analysis on the market
- 3.6. Key Regulation Analysis
- 3.7. Pricing Analysis
- 3.8. Patent Landscape
CHAPTER 4: HYDROGEN MARKET, BY DELIVERY MODE
- 4.1. Overview
- 4.1.1. Market size and forecast
- 4.2. Captive
- 4.2.1. Key market trends, growth factors and opportunities
- 4.2.2. Market size and forecast, by region
- 4.2.3. Market share analysis by country
- 4.3. Merchant
- 4.3.1. Key market trends, growth factors and opportunities
- 4.3.2. Market size and forecast, by region
- 4.3.3. Market share analysis by country
CHAPTER 5: HYDROGEN MARKET, BY TYPE
- 5.1. Overview
- 5.1.1. Market size and forecast
- 5.2. Blue Hydrogen
- 5.2.1. Key market trends, growth factors and opportunities
- 5.2.2. Market size and forecast, by region
- 5.2.3. Market share analysis by country
- 5.3. Grey Hydrogen
- 5.3.1. Key market trends, growth factors and opportunities
- 5.3.2. Market size and forecast, by region
- 5.3.3. Market share analysis by country
- 5.4. Green Hydrogen
- 5.4.1. Key market trends, growth factors and opportunities
- 5.4.2. Market size and forecast, by region
- 5.4.3. Market share analysis by country
CHAPTER 6: HYDROGEN MARKET, BY END USE
- 6.1. Overview
- 6.1.1. Market size and forecast
- 6.2. Refining
- 6.2.1. Key market trends, growth factors and opportunities
- 6.2.2. Market size and forecast, by region
- 6.2.3. Market share analysis by country
- 6.3. Power Generation
- 6.3.1. Key market trends, growth factors and opportunities
- 6.3.2. Market size and forecast, by region
- 6.3.3. Market share analysis by country
- 6.4. Transportation
- 6.4.1. Key market trends, growth factors and opportunities
- 6.4.2. Market size and forecast, by region
- 6.4.3. Market share analysis by country
- 6.5. Food Processing
- 6.5.1. Key market trends, growth factors and opportunities
- 6.5.2. Market size and forecast, by region
- 6.5.3. Market share analysis by country
- 6.6. Others
- 6.6.1. Key market trends, growth factors and opportunities
- 6.6.2. Market size and forecast, by region
- 6.6.3. Market share analysis by country
CHAPTER 7: HYDROGEN MARKET, BY REGION
- 7.1. Overview
- 7.1.1. Market size and forecast By Region
- 7.2. North America
- 7.2.1. Key trends and opportunities
- 7.2.2. Market size and forecast, by Delivery Mode
- 7.2.3. Market size and forecast, by Type
- 7.2.4. Market size and forecast, by End Use
- 7.2.5. Market size and forecast, by country
- 7.2.5.1. U.S.
- 7.2.5.1.1. Key market trends, growth factors and opportunities
- 7.2.5.1.2. Market size and forecast, by Delivery Mode
- 7.2.5.1.3. Market size and forecast, by Type
- 7.2.5.1.4. Market size and forecast, by End Use
- 7.2.5.2. Canada
- 7.2.5.2.1. Key market trends, growth factors and opportunities
- 7.2.5.2.2. Market size and forecast, by Delivery Mode
- 7.2.5.2.3. Market size and forecast, by Type
- 7.2.5.2.4. Market size and forecast, by End Use
- 7.2.5.3. Mexico
- 7.2.5.3.1. Key market trends, growth factors and opportunities
- 7.2.5.3.2. Market size and forecast, by Delivery Mode
- 7.2.5.3.3. Market size and forecast, by Type
- 7.2.5.3.4. Market size and forecast, by End Use
- 7.3. Europe
- 7.3.1. Key trends and opportunities
- 7.3.2. Market size and forecast, by Delivery Mode
- 7.3.3. Market size and forecast, by Type
- 7.3.4. Market size and forecast, by End Use
- 7.3.5. Market size and forecast, by country
- 7.3.5.1. Germany
- 7.3.5.1.1. Key market trends, growth factors and opportunities
- 7.3.5.1.2. Market size and forecast, by Delivery Mode
- 7.3.5.1.3. Market size and forecast, by Type
- 7.3.5.1.4. Market size and forecast, by End Use
- 7.3.5.2. France
- 7.3.5.2.1. Key market trends, growth factors and opportunities
- 7.3.5.2.2. Market size and forecast, by Delivery Mode
- 7.3.5.2.3. Market size and forecast, by Type
- 7.3.5.2.4. Market size and forecast, by End Use
- 7.3.5.3. Italy
- 7.3.5.3.1. Key market trends, growth factors and opportunities
- 7.3.5.3.2. Market size and forecast, by Delivery Mode
- 7.3.5.3.3. Market size and forecast, by Type
- 7.3.5.3.4. Market size and forecast, by End Use
- 7.3.5.4. UK
- 7.3.5.4.1. Key market trends, growth factors and opportunities
- 7.3.5.4.2. Market size and forecast, by Delivery Mode
- 7.3.5.4.3. Market size and forecast, by Type
- 7.3.5.4.4. Market size and forecast, by End Use
- 7.3.5.5. Spain
- 7.3.5.5.1. Key market trends, growth factors and opportunities
- 7.3.5.5.2. Market size and forecast, by Delivery Mode
- 7.3.5.5.3. Market size and forecast, by Type
- 7.3.5.5.4. Market size and forecast, by End Use
- 7.3.5.6. Rest of Europe
- 7.3.5.6.1. Key market trends, growth factors and opportunities
- 7.3.5.6.2. Market size and forecast, by Delivery Mode
- 7.3.5.6.3. Market size and forecast, by Type
- 7.3.5.6.4. Market size and forecast, by End Use
- 7.4. Asia-Pacific
- 7.4.1. Key trends and opportunities
- 7.4.2. Market size and forecast, by Delivery Mode
- 7.4.3. Market size and forecast, by Type
- 7.4.4. Market size and forecast, by End Use
- 7.4.5. Market size and forecast, by country
- 7.4.5.1. China
- 7.4.5.1.1. Key market trends, growth factors and opportunities
- 7.4.5.1.2. Market size and forecast, by Delivery Mode
- 7.4.5.1.3. Market size and forecast, by Type
- 7.4.5.1.4. Market size and forecast, by End Use
- 7.4.5.2. India
- 7.4.5.2.1. Key market trends, growth factors and opportunities
- 7.4.5.2.2. Market size and forecast, by Delivery Mode
- 7.4.5.2.3. Market size and forecast, by Type
- 7.4.5.2.4. Market size and forecast, by End Use
- 7.4.5.3. Japan
- 7.4.5.3.1. Key market trends, growth factors and opportunities
- 7.4.5.3.2. Market size and forecast, by Delivery Mode
- 7.4.5.3.3. Market size and forecast, by Type
- 7.4.5.3.4. Market size and forecast, by End Use
- 7.4.5.4. South Korea
- 7.4.5.4.1. Key market trends, growth factors and opportunities
- 7.4.5.4.2. Market size and forecast, by Delivery Mode
- 7.4.5.4.3. Market size and forecast, by Type
- 7.4.5.4.4. Market size and forecast, by End Use
- 7.4.5.5. Australia
- 7.4.5.5.1. Key market trends, growth factors and opportunities
- 7.4.5.5.2. Market size and forecast, by Delivery Mode
- 7.4.5.5.3. Market size and forecast, by Type
- 7.4.5.5.4. Market size and forecast, by End Use
- 7.4.5.6. Rest of Asia-Pacific
- 7.4.5.6.1. Key market trends, growth factors and opportunities
- 7.4.5.6.2. Market size and forecast, by Delivery Mode
- 7.4.5.6.3. Market size and forecast, by Type
- 7.4.5.6.4. Market size and forecast, by End Use
- 7.5. LAMEA
- 7.5.1. Key trends and opportunities
- 7.5.2. Market size and forecast, by Delivery Mode
- 7.5.3. Market size and forecast, by Type
- 7.5.4. Market size and forecast, by End Use
- 7.5.5. Market size and forecast, by country
- 7.5.5.1. Brazil
- 7.5.5.1.1. Key market trends, growth factors and opportunities
- 7.5.5.1.2. Market size and forecast, by Delivery Mode
- 7.5.5.1.3. Market size and forecast, by Type
- 7.5.5.1.4. Market size and forecast, by End Use
- 7.5.5.2. Saudi Arabia
- 7.5.5.2.1. Key market trends, growth factors and opportunities
- 7.5.5.2.2. Market size and forecast, by Delivery Mode
- 7.5.5.2.3. Market size and forecast, by Type
- 7.5.5.2.4. Market size and forecast, by End Use
- 7.5.5.3. South Africa
- 7.5.5.3.1. Key market trends, growth factors and opportunities
- 7.5.5.3.2. Market size and forecast, by Delivery Mode
- 7.5.5.3.3. Market size and forecast, by Type
- 7.5.5.3.4. Market size and forecast, by End Use
- 7.5.5.4. Rest of LAMEA
- 7.5.5.4.1. Key market trends, growth factors and opportunities
- 7.5.5.4.2. Market size and forecast, by Delivery Mode
- 7.5.5.4.3. Market size and forecast, by Type
- 7.5.5.4.4. Market size and forecast, by End Use
CHAPTER 8: COMPETITIVE LANDSCAPE
- 8.1. Introduction
- 8.2. Top winning strategies
- 8.3. Product Mapping of Top 10 Player
- 8.4. Competitive Dashboard
- 8.5. Competitive Heatmap
- 8.6. Top player positioning, 2022
CHAPTER 9: COMPANY PROFILES
- 9.1. Air Liquide S.A.
- 9.1.1. Company overview
- 9.1.2. Key Executives
- 9.1.3. Company snapshot
- 9.1.4. Operating business segments
- 9.1.5. Product portfolio
- 9.1.6. Business performance
- 9.1.7. Key strategic moves and developments
- 9.2. Messer Group GmbH.
- 9.2.1. Company overview
- 9.2.2. Key Executives
- 9.2.3. Company snapshot
- 9.2.4. Operating business segments
- 9.2.5. Product portfolio
- 9.2.6. Business performance
- 9.3. Plug Power Inc.
- 9.3.1. Company overview
- 9.3.2. Key Executives
- 9.3.3. Company snapshot
- 9.3.4. Operating business segments
- 9.3.5. Product portfolio
- 9.3.6. Business performance
- 9.3.7. Key strategic moves and developments
- 9.4. NEL ASA
- 9.4.1. Company overview
- 9.4.2. Key Executives
- 9.4.3. Company snapshot
- 9.4.4. Operating business segments
- 9.4.5. Product portfolio
- 9.4.6. Business performance
- 9.5. Linde plc
- 9.5.1. Company overview
- 9.5.2. Key Executives
- 9.5.3. Company snapshot
- 9.5.4. Operating business segments
- 9.5.5. Product portfolio
- 9.5.6. Business performance
- 9.5.7. Key strategic moves and developments
- 9.6. FuelCell Energy, Inc.
- 9.6.1. Company overview
- 9.6.2. Key Executives
- 9.6.3. Company snapshot
- 9.6.4. Operating business segments
- 9.6.5. Product portfolio
- 9.6.6. Business performance
- 9.6.7. Key strategic moves and developments
- 9.7. Air Products and Chemicals, Inc.
- 9.7.1. Company overview
- 9.7.2. Key Executives
- 9.7.3. Company snapshot
- 9.7.4. Operating business segments
- 9.7.5. Product portfolio
- 9.7.6. Business performance
- 9.7.7. Key strategic moves and developments
- 9.8. Shell Plc.
- 9.8.1. Company overview
- 9.8.2. Key Executives
- 9.8.3. Company snapshot
- 9.8.4. Operating business segments
- 9.8.5. Product portfolio
- 9.8.6. Business performance
- 9.8.7. Key strategic moves and developments
- 9.9. Reliance Industries Ltd
- 9.9.1. Company overview
- 9.9.2. Key Executives
- 9.9.3. Company snapshot
- 9.9.4. Operating business segments
- 9.9.5. Product portfolio
- 9.9.6. Business performance
- 9.9.7. Key strategic moves and developments
- 9.10. Indian Oil Corporation Ltd.
- 9.10.1. Company overview
- 9.10.2. Key Executives
- 9.10.3. Company snapshot
- 9.10.4. Operating business segments
- 9.10.5. Product portfolio
- 9.10.6. Business performance
- 9.10.7. Key strategic moves and developments
LIST OF TABLES
- TABLE 01. GLOBAL HYDROGEN MARKET, BY DELIVERY MODE, 2022-2032 ($MILLION)
- TABLE 02. GLOBAL HYDROGEN MARKET, BY DELIVERY MODE, 2022-2032 (KILOTON)
- TABLE 03. HYDROGEN MARKET FOR CAPTIVE, BY REGION, 2022-2032 ($MILLION)
- TABLE 04. HYDROGEN MARKET FOR CAPTIVE, BY REGION, 2022-2032 (KILOTON)
- TABLE 05. HYDROGEN MARKET FOR MERCHANT, BY REGION, 2022-2032 ($MILLION)
- TABLE 06. HYDROGEN MARKET FOR MERCHANT, BY REGION, 2022-2032 (KILOTON)
- TABLE 07. GLOBAL HYDROGEN MARKET, BY TYPE, 2022-2032 ($MILLION)
- TABLE 08. GLOBAL HYDROGEN MARKET, BY TYPE, 2022-2032 (KILOTON)
- TABLE 09. HYDROGEN MARKET FOR BLUE HYDROGEN, BY REGION, 2022-2032 ($MILLION)
- TABLE 10. HYDROGEN MARKET FOR BLUE HYDROGEN, BY REGION, 2022-2032 (KILOTON)
- TABLE 11. HYDROGEN MARKET FOR GREY HYDROGEN, BY REGION, 2022-2032 ($MILLION)
- TABLE 12. HYDROGEN MARKET FOR GREY HYDROGEN, BY REGION, 2022-2032 (KILOTON)
- TABLE 13. HYDROGEN MARKET FOR GREEN HYDROGEN, BY REGION, 2022-2032 ($MILLION)
- TABLE 14. HYDROGEN MARKET FOR GREEN HYDROGEN, BY REGION, 2022-2032 (KILOTON)
- TABLE 15. GLOBAL HYDROGEN MARKET, BY END USE, 2022-2032 ($MILLION)
- TABLE 16. GLOBAL HYDROGEN MARKET, BY END USE, 2022-2032 (KILOTON)
- TABLE 17. HYDROGEN MARKET FOR REFINING, BY REGION, 2022-2032 ($MILLION)
- TABLE 18. HYDROGEN MARKET FOR REFINING, BY REGION, 2022-2032 (KILOTON)
- TABLE 19. HYDROGEN MARKET FOR POWER GENERATION, BY REGION, 2022-2032 ($MILLION)
- TABLE 20. HYDROGEN MARKET FOR POWER GENERATION, BY REGION, 2022-2032 (KILOTON)
- TABLE 21. HYDROGEN MARKET FOR TRANSPORTATION, BY REGION, 2022-2032 ($MILLION)
- TABLE 22. HYDROGEN MARKET FOR TRANSPORTATION, BY REGION, 2022-2032 (KILOTON)
- TABLE 23. HYDROGEN MARKET FOR FOOD PROCESSING, BY REGION, 2022-2032 ($MILLION)
- TABLE 24. HYDROGEN MARKET FOR FOOD PROCESSING, BY REGION, 2022-2032 (KILOTON)
- TABLE 25. HYDROGEN MARKET FOR OTHERS, BY REGION, 2022-2032 ($MILLION)
- TABLE 26. HYDROGEN MARKET FOR OTHERS, BY REGION, 2022-2032 (KILOTON)
- TABLE 27. HYDROGEN MARKET, BY REGION, 2022-2032 ($MILLION)
- TABLE 28. HYDROGEN MARKET, BY REGION, 2022-2032 (KILOTON)
- TABLE 29. NORTH AMERICA HYDROGEN MARKET, BY DELIVERY MODE, 2022-2032 ($MILLION)
- TABLE 30. NORTH AMERICA HYDROGEN MARKET, BY DELIVERY MODE, 2022-2032 (KILOTON)
- TABLE 31. NORTH AMERICA HYDROGEN MARKET, BY TYPE, 2022-2032 ($MILLION)
- TABLE 32. NORTH AMERICA HYDROGEN MARKET, BY TYPE, 2022-2032 (KILOTON)
- TABLE 33. NORTH AMERICA HYDROGEN MARKET, BY END USE, 2022-2032 ($MILLION)
- TABLE 34. NORTH AMERICA HYDROGEN MARKET, BY END USE, 2022-2032 (KILOTON)
- TABLE 35. NORTH AMERICA HYDROGEN MARKET, BY COUNTRY, 2022-2032 ($MILLION)
- TABLE 36. NORTH AMERICA HYDROGEN MARKET, BY COUNTRY, 2022-2032 (KILOTON)
- TABLE 37. U.S. HYDROGEN MARKET, BY DELIVERY MODE, 2022-2032 ($MILLION)
- TABLE 38. U.S. HYDROGEN MARKET, BY DELIVERY MODE, 2022-2032 (KILOTON)
- TABLE 39. U.S. HYDROGEN MARKET, BY TYPE, 2022-2032 ($MILLION)
- TABLE 40. U.S. HYDROGEN MARKET, BY TYPE, 2022-2032 (KILOTON)
- TABLE 41. U.S. HYDROGEN MARKET, BY END USE, 2022-2032 ($MILLION)
- TABLE 42. U.S. HYDROGEN MARKET, BY END USE, 2022-2032 (KILOTON)
- TABLE 43. CANADA HYDROGEN MARKET, BY DELIVERY MODE, 2022-2032 ($MILLION)
- TABLE 44. CANADA HYDROGEN MARKET, BY DELIVERY MODE, 2022-2032 (KILOTON)
- TABLE 45. CANADA HYDROGEN MARKET, BY TYPE, 2022-2032 ($MILLION)
- TABLE 46. CANADA HYDROGEN MARKET, BY TYPE, 2022-2032 (KILOTON)
- TABLE 47. CANADA HYDROGEN MARKET, BY END USE, 2022-2032 ($MILLION)
- TABLE 48. CANADA HYDROGEN MARKET, BY END USE, 2022-2032 (KILOTON)
- TABLE 49. MEXICO HYDROGEN MARKET, BY DELIVERY MODE, 2022-2032 ($MILLION)
- TABLE 50. MEXICO HYDROGEN MARKET, BY DELIVERY MODE, 2022-2032 (KILOTON)
- TABLE 51. MEXICO HYDROGEN MARKET, BY TYPE, 2022-2032 ($MILLION)
- TABLE 52. MEXICO HYDROGEN MARKET, BY TYPE, 2022-2032 (KILOTON)
- TABLE 53. MEXICO HYDROGEN MARKET, BY END USE, 2022-2032 ($MILLION)
- TABLE 54. MEXICO HYDROGEN MARKET, BY END USE, 2022-2032 (KILOTON)
- TABLE 55. EUROPE HYDROGEN MARKET, BY DELIVERY MODE, 2022-2032 ($MILLION)
- TABLE 56. EUROPE HYDROGEN MARKET, BY DELIVERY MODE, 2022-2032 (KILOTON)
- TABLE 57. EUROPE HYDROGEN MARKET, BY TYPE, 2022-2032 ($MILLION)
- TABLE 58. EUROPE HYDROGEN MARKET, BY TYPE, 2022-2032 (KILOTON)
- TABLE 59. EUROPE HYDROGEN MARKET, BY END USE, 2022-2032 ($MILLION)
- TABLE 60. EUROPE HYDROGEN MARKET, BY END USE, 2022-2032 (KILOTON)
- TABLE 61. EUROPE HYDROGEN MARKET, BY COUNTRY, 2022-2032 ($MILLION)
- TABLE 62. EUROPE HYDROGEN MARKET, BY COUNTRY, 2022-2032 (KILOTON)
- TABLE 63. GERMANY HYDROGEN MARKET, BY DELIVERY MODE, 2022-2032 ($MILLION)
- TABLE 64. GERMANY HYDROGEN MARKET, BY DELIVERY MODE, 2022-2032 (KILOTON)
- TABLE 65. GERMANY HYDROGEN MARKET, BY TYPE, 2022-2032 ($MILLION)
- TABLE 66. GERMANY HYDROGEN MARKET, BY TYPE, 2022-2032 (KILOTON)
- TABLE 67. GERMANY HYDROGEN MARKET, BY END USE, 2022-2032 ($MILLION)
- TABLE 68. GERMANY HYDROGEN MARKET, BY END USE, 2022-2032 (KILOTON)
- TABLE 69. FRANCE HYDROGEN MARKET, BY DELIVERY MODE, 2022-2032 ($MILLION)
- TABLE 70. FRANCE HYDROGEN MARKET, BY DELIVERY MODE, 2022-2032 (KILOTON)
- TABLE 71. FRANCE HYDROGEN MARKET, BY TYPE, 2022-2032 ($MILLION)
- TABLE 72. FRANCE HYDROGEN MARKET, BY TYPE, 2022-2032 (KILOTON)
- TABLE 73. FRANCE HYDROGEN MARKET, BY END USE, 2022-2032 ($MILLION)
- TABLE 74. FRANCE HYDROGEN MARKET, BY END USE, 2022-2032 (KILOTON)
- TABLE 75. ITALY HYDROGEN MARKET, BY DELIVERY MODE, 2022-2032 ($MILLION)
- TABLE 76. ITALY HYDROGEN MARKET, BY DELIVERY MODE, 2022-2032 (KILOTON)
- TABLE 77. ITALY HYDROGEN MARKET, BY TYPE, 2022-2032 ($MILLION)
- TABLE 78. ITALY HYDROGEN MARKET, BY TYPE, 2022-2032 (KILOTON)
- TABLE 79. ITALY HYDROGEN MARKET, BY END USE, 2022-2032 ($MILLION)
- TABLE 80. ITALY HYDROGEN MARKET, BY END USE, 2022-2032 (KILOTON)
- TABLE 81. UK HYDROGEN MARKET, BY DELIVERY MODE, 2022-2032 ($MILLION)
- TABLE 82. UK HYDROGEN MARKET, BY DELIVERY MODE, 2022-2032 (KILOTON)
- TABLE 83. UK HYDROGEN MARKET, BY TYPE, 2022-2032 ($MILLION)
- TABLE 84. UK HYDROGEN MARKET, BY TYPE, 2022-2032 (KILOTON)
- TABLE 85. UK HYDROGEN MARKET, BY END USE, 2022-2032 ($MILLION)
- TABLE 86. UK HYDROGEN MARKET, BY END USE, 2022-2032 (KILOTON)
- TABLE 87. SPAIN HYDROGEN MARKET, BY DELIVERY MODE, 2022-2032 ($MILLION)
- TABLE 88. SPAIN HYDROGEN MARKET, BY DELIVERY MODE, 2022-2032 (KILOTON)
- TABLE 89. SPAIN HYDROGEN MARKET, BY TYPE, 2022-2032 ($MILLION)
- TABLE 90. SPAIN HYDROGEN MARKET, BY TYPE, 2022-2032 (KILOTON)
- TABLE 91. SPAIN HYDROGEN MARKET, BY END USE, 2022-2032 ($MILLION)
- TABLE 92. SPAIN HYDROGEN MARKET, BY END USE, 2022-2032 (KILOTON)
- TABLE 93. REST OF EUROPE HYDROGEN MARKET, BY DELIVERY MODE, 2022-2032 ($MILLION)
- TABLE 94. REST OF EUROPE HYDROGEN MARKET, BY DELIVERY MODE, 2022-2032 (KILOTON)
- TABLE 95. REST OF EUROPE HYDROGEN MARKET, BY TYPE, 2022-2032 ($MILLION)
- TABLE 96. REST OF EUROPE HYDROGEN MARKET, BY TYPE, 2022-2032 (KILOTON)
- TABLE 97. REST OF EUROPE HYDROGEN MARKET, BY END USE, 2022-2032 ($MILLION)
- TABLE 98. REST OF EUROPE HYDROGEN MARKET, BY END USE, 2022-2032 (KILOTON)
- TABLE 99. ASIA-PACIFIC HYDROGEN MARKET, BY DELIVERY MODE, 2022-2032 ($MILLION)
- TABLE 100. ASIA-PACIFIC HYDROGEN MARKET, BY DELIVERY MODE, 2022-2032 (KILOTON)
- TABLE 101. ASIA-PACIFIC HYDROGEN MARKET, BY TYPE, 2022-2032 ($MILLION)
- TABLE 102. ASIA-PACIFIC HYDROGEN MARKET, BY TYPE, 2022-2032 (KILOTON)
- TABLE 103. ASIA-PACIFIC HYDROGEN MARKET, BY END USE, 2022-2032 ($MILLION)
- TABLE 104. ASIA-PACIFIC HYDROGEN MARKET, BY END USE, 2022-2032 (KILOTON)
- TABLE 105. ASIA-PACIFIC HYDROGEN MARKET, BY COUNTRY, 2022-2032 ($MILLION)
- TABLE 106. ASIA-PACIFIC HYDROGEN MARKET, BY COUNTRY, 2022-2032 (KILOTON)
- TABLE 107. CHINA HYDROGEN MARKET, BY DELIVERY MODE, 2022-2032 ($MILLION)
- TABLE 108. CHINA HYDROGEN MARKET, BY DELIVERY MODE, 2022-2032 (KILOTON)
- TABLE 109. CHINA HYDROGEN MARKET, BY TYPE, 2022-2032 ($MILLION)
- TABLE 110. CHINA HYDROGEN MARKET, BY TYPE, 2022-2032 (KILOTON)
- TABLE 111. CHINA HYDROGEN MARKET, BY END USE, 2022-2032 ($MILLION)
- TABLE 112. CHINA HYDROGEN MARKET, BY END USE, 2022-2032 (KILOTON)
- TABLE 113. INDIA HYDROGEN MARKET, BY DELIVERY MODE, 2022-2032 ($MILLION)
- TABLE 114. INDIA HYDROGEN MARKET, BY DELIVERY MODE, 2022-2032 (KILOTON)
- TABLE 115. INDIA HYDROGEN MARKET, BY TYPE, 2022-2032 ($MILLION)
- TABLE 116. INDIA HYDROGEN MARKET, BY TYPE, 2022-2032 (KILOTON)
- TABLE 117. INDIA HYDROGEN MARKET, BY END USE, 2022-2032 ($MILLION)
- TABLE 118. INDIA HYDROGEN MARKET, BY END USE, 2022-2032 (KILOTON)
- TABLE 119. JAPAN HYDROGEN MARKET, BY DELIVERY MODE, 2022-2032 ($MILLION)
- TABLE 120. JAPAN HYDROGEN MARKET, BY DELIVERY MODE, 2022-2032 (KILOTON)
- TABLE 121. JAPAN HYDROGEN MARKET, BY TYPE, 2022-2032 ($MILLION)
- TABLE 122. JAPAN HYDROGEN MARKET, BY TYPE, 2022-2032 (KILOTON)
- TABLE 123. JAPAN HYDROGEN MARKET, BY END USE, 2022-2032 ($MILLION)
- TABLE 124. JAPAN HYDROGEN MARKET, BY END USE, 2022-2032 (KILOTON)
- TABLE 125. SOUTH KOREA HYDROGEN MARKET, BY DELIVERY MODE, 2022-2032 ($MILLION)
- TABLE 126. SOUTH KOREA HYDROGEN MARKET, BY DELIVERY MODE, 2022-2032 (KILOTON)
- TABLE 127. SOUTH KOREA HYDROGEN MARKET, BY TYPE, 2022-2032 ($MILLION)
- TABLE 128. SOUTH KOREA HYDROGEN MARKET, BY TYPE, 2022-2032 (KILOTON)
- TABLE 129. SOUTH KOREA HYDROGEN MARKET, BY END USE, 2022-2032 ($MILLION)
- TABLE 130. SOUTH KOREA HYDROGEN MARKET, BY END USE, 2022-2032 (KILOTON)
- TABLE 131. AUSTRALIA HYDROGEN MARKET, BY DELIVERY MODE, 2022-2032 ($MILLION)
- TABLE 132. AUSTRALIA HYDROGEN MARKET, BY DELIVERY MODE, 2022-2032 (KILOTON)
- TABLE 133. AUSTRALIA HYDROGEN MARKET, BY TYPE, 2022-2032 ($MILLION)
- TABLE 134. AUSTRALIA HYDROGEN MARKET, BY TYPE, 2022-2032 (KILOTON)
- TABLE 135. AUSTRALIA HYDROGEN MARKET, BY END USE, 2022-2032 ($MILLION)
- TABLE 136. AUSTRALIA HYDROGEN MARKET, BY END USE, 2022-2032 (KILOTON)
- TABLE 137. REST OF ASIA-PACIFIC HYDROGEN MARKET, BY DELIVERY MODE, 2022-2032 ($MILLION)
- TABLE 138. REST OF ASIA-PACIFIC HYDROGEN MARKET, BY DELIVERY MODE, 2022-2032 (KILOTON)
- TABLE 139. REST OF ASIA-PACIFIC HYDROGEN MARKET, BY TYPE, 2022-2032 ($MILLION)
- TABLE 140. REST OF ASIA-PACIFIC HYDROGEN MARKET, BY TYPE, 2022-2032 (KILOTON)
- TABLE 141. REST OF ASIA-PACIFIC HYDROGEN MARKET, BY END USE, 2022-2032 ($MILLION)
- TABLE 142. REST OF ASIA-PACIFIC HYDROGEN MARKET, BY END USE, 2022-2032 (KILOTON)
- TABLE 143. LAMEA HYDROGEN MARKET, BY DELIVERY MODE, 2022-2032 ($MILLION)
- TABLE 144. LAMEA HYDROGEN MARKET, BY DELIVERY MODE, 2022-2032 (KILOTON)
- TABLE 145. LAMEA HYDROGEN MARKET, BY TYPE, 2022-2032 ($MILLION)
- TABLE 146. LAMEA HYDROGEN MARKET, BY TYPE, 2022-2032 (KILOTON)
- TABLE 147. LAMEA HYDROGEN MARKET, BY END USE, 2022-2032 ($MILLION)
- TABLE 148. LAMEA HYDROGEN MARKET, BY END USE, 2022-2032 (KILOTON)
- TABLE 149. LAMEA HYDROGEN MARKET, BY COUNTRY, 2022-2032 ($MILLION)
- TABLE 150. LAMEA HYDROGEN MARKET, BY COUNTRY, 2022-2032 (KILOTON)
- TABLE 151. BRAZIL HYDROGEN MARKET, BY DELIVERY MODE, 2022-2032 ($MILLION)
- TABLE 152. BRAZIL HYDROGEN MARKET, BY DELIVERY MODE, 2022-2032 (KILOTON)
- TABLE 153. BRAZIL HYDROGEN MARKET, BY TYPE, 2022-2032 ($MILLION)
- TABLE 154. BRAZIL HYDROGEN MARKET, BY TYPE, 2022-2032 (KILOTON)
- TABLE 155. BRAZIL HYDROGEN MARKET, BY END USE, 2022-2032 ($MILLION)
- TABLE 156. BRAZIL HYDROGEN MARKET, BY END USE, 2022-2032 (KILOTON)
- TABLE 157. SAUDI ARABIA HYDROGEN MARKET, BY DELIVERY MODE, 2022-2032 ($MILLION)
- TABLE 158. SAUDI ARABIA HYDROGEN MARKET, BY DELIVERY MODE, 2022-2032 (KILOTON)
- TABLE 159. SAUDI ARABIA HYDROGEN MARKET, BY TYPE, 2022-2032 ($MILLION)
- TABLE 160. SAUDI ARABIA HYDROGEN MARKET, BY TYPE, 2022-2032 (KILOTON)
- TABLE 161. SAUDI ARABIA HYDROGEN MARKET, BY END USE, 2022-2032 ($MILLION)
- TABLE 162. SAUDI ARABIA HYDROGEN MARKET, BY END USE, 2022-2032 (KILOTON)
- TABLE 163. SOUTH AFRICA HYDROGEN MARKET, BY DELIVERY MODE, 2022-2032 ($MILLION)
- TABLE 164. SOUTH AFRICA HYDROGEN MARKET, BY DELIVERY MODE, 2022-2032 (KILOTON)
- TABLE 165. SOUTH AFRICA HYDROGEN MARKET, BY TYPE, 2022-2032 ($MILLION)
- TABLE 166. SOUTH AFRICA HYDROGEN MARKET, BY TYPE, 2022-2032 (KILOTON)
- TABLE 167. SOUTH AFRICA HYDROGEN MARKET, BY END USE, 2022-2032 ($MILLION)
- TABLE 168. SOUTH AFRICA HYDROGEN MARKET, BY END USE, 2022-2032 (KILOTON)
- TABLE 169. REST OF LAMEA HYDROGEN MARKET, BY DELIVERY MODE, 2022-2032 ($MILLION)
- TABLE 170. REST OF LAMEA HYDROGEN MARKET, BY DELIVERY MODE, 2022-2032 (KILOTON)
- TABLE 171. REST OF LAMEA HYDROGEN MARKET, BY TYPE, 2022-2032 ($MILLION)
- TABLE 172. REST OF LAMEA HYDROGEN MARKET, BY TYPE, 2022-2032 (KILOTON)
- TABLE 173. REST OF LAMEA HYDROGEN MARKET, BY END USE, 2022-2032 ($MILLION)
- TABLE 174. REST OF LAMEA HYDROGEN MARKET, BY END USE, 2022-2032 (KILOTON)
- TABLE 175. AIR LIQUIDE S.A.: KEY EXECUTIVES
- TABLE 176. AIR LIQUIDE S.A.: COMPANY SNAPSHOT
- TABLE 177. AIR LIQUIDE S.A.: PRODUCT SEGMENTS
- TABLE 178. AIR LIQUIDE S.A.: PRODUCT PORTFOLIO
- TABLE 179. AIR LIQUIDE S.A.: KEY STRATERGIES
- TABLE 180. MESSER GROUP GMBH.: KEY EXECUTIVES
- TABLE 181. MESSER GROUP GMBH.: COMPANY SNAPSHOT
- TABLE 182. MESSER GROUP GMBH.: PRODUCT SEGMENTS
- TABLE 183. MESSER GROUP GMBH.: PRODUCT PORTFOLIO
- TABLE 184. PLUG POWER INC.: KEY EXECUTIVES
- TABLE 185. PLUG POWER INC.: COMPANY SNAPSHOT
- TABLE 186. PLUG POWER INC.: PRODUCT SEGMENTS
- TABLE 187. PLUG POWER INC.: PRODUCT PORTFOLIO
- TABLE 188. PLUG POWER INC.: KEY STRATERGIES
- TABLE 189. NEL ASA: KEY EXECUTIVES
- TABLE 190. NEL ASA: COMPANY SNAPSHOT
- TABLE 191. NEL ASA: PRODUCT SEGMENTS
- TABLE 192. NEL ASA: PRODUCT PORTFOLIO
- TABLE 193. LINDE PLC: KEY EXECUTIVES
- TABLE 194. LINDE PLC: COMPANY SNAPSHOT
- TABLE 195. LINDE PLC: PRODUCT SEGMENTS
- TABLE 196. LINDE PLC: PRODUCT PORTFOLIO
- TABLE 197. LINDE PLC: KEY STRATERGIES
- TABLE 198. FUELCELL ENERGY, INC.: KEY EXECUTIVES
- TABLE 199. FUELCELL ENERGY, INC.: COMPANY SNAPSHOT
- TABLE 200. FUELCELL ENERGY, INC.: SERVICE SEGMENTS
- TABLE 201. FUELCELL ENERGY, INC.: PRODUCT PORTFOLIO
- TABLE 202. FUELCELL ENERGY, INC.: KEY STRATERGIES
- TABLE 203. AIR PRODUCTS AND CHEMICALS, INC.: KEY EXECUTIVES
- TABLE 204. AIR PRODUCTS AND CHEMICALS, INC.: COMPANY SNAPSHOT
- TABLE 205. AIR PRODUCTS AND CHEMICALS, INC.: PRODUCT SEGMENTS
- TABLE 206. AIR PRODUCTS AND CHEMICALS, INC.: PRODUCT PORTFOLIO
- TABLE 207. AIR PRODUCTS AND CHEMICALS, INC.: KEY STRATERGIES
- TABLE 208. SHELL PLC.: KEY EXECUTIVES
- TABLE 209. SHELL PLC.: COMPANY SNAPSHOT
- TABLE 210. SHELL PLC.: PRODUCT SEGMENTS
- TABLE 211. SHELL PLC.: PRODUCT PORTFOLIO
- TABLE 212. SHELL PLC.: KEY STRATERGIES
- TABLE 213. RELIANCE INDUSTRIES LTD: KEY EXECUTIVES
- TABLE 214. RELIANCE INDUSTRIES LTD: COMPANY SNAPSHOT
- TABLE 215. RELIANCE INDUSTRIES LTD: PRODUCT SEGMENTS
- TABLE 216. RELIANCE INDUSTRIES LTD: PRODUCT PORTFOLIO
- TABLE 217. RELIANCE INDUSTRIES LTD: KEY STRATERGIES
- TABLE 218. INDIAN OIL CORPORATION LTD.: KEY EXECUTIVES
- TABLE 219. INDIAN OIL CORPORATION LTD.: COMPANY SNAPSHOT
- TABLE 220. INDIAN OIL CORPORATION LTD.: PRODUCT SEGMENTS
- TABLE 221. INDIAN OIL CORPORATION LTD.: PRODUCT PORTFOLIO
- TABLE 222. INDIAN OIL CORPORATION LTD.: KEY STRATERGIES
LIST OF FIGURES
- FIGURE 01. HYDROGEN MARKET, 2022-2032
- FIGURE 02. SEGMENTATION OF HYDROGEN MARKET, 2022-2032
- FIGURE 03. TOP INVESTMENT POCKETS IN HYDROGEN MARKET (2023-2032)
- FIGURE 04. LOW BARGAINING POWER OF SUPPLIERS
- FIGURE 05. LOW THREAT OF NEW ENTRANTS
- FIGURE 06. LOW THREAT OF SUBSTITUTES
- FIGURE 07. LOW INTENSITY OF RIVALRY
- FIGURE 08. LOW BARGAINING POWER OF BUYERS
- FIGURE 09. DRIVERS, RESTRAINTS AND OPPORTUNITIES: GLOBALHYDROGEN MARKET
- FIGURE 10. IMPACT OF KEY REGULATION: HYDROGEN MARKET
- FIGURE 11. PRICING ANALYSIS: HYDROGEN MARKET 2022 AND 2032
- FIGURE 12. PATENT ANALYSIS BY COMPANY
- FIGURE 13. PATENT ANALYSIS BY COUNTRY
- FIGURE 13. HYDROGEN MARKET, BY DELIVERY MODE, 2022(%)
- FIGURE 14. COMPARATIVE SHARE ANALYSIS OF HYDROGEN MARKET FOR CAPTIVE, BY COUNTRY 2022 AND 2032(%)
- FIGURE 15. COMPARATIVE SHARE ANALYSIS OF HYDROGEN MARKET FOR MERCHANT, BY COUNTRY 2022 AND 2032(%)
- FIGURE 16. HYDROGEN MARKET, BY TYPE, 2022(%)
- FIGURE 17. COMPARATIVE SHARE ANALYSIS OF HYDROGEN MARKET FOR BLUE HYDROGEN, BY COUNTRY 2022 AND 2032(%)
- FIGURE 18. COMPARATIVE SHARE ANALYSIS OF HYDROGEN MARKET FOR GREY HYDROGEN, BY COUNTRY 2022 AND 2032(%)
- FIGURE 19. COMPARATIVE SHARE ANALYSIS OF HYDROGEN MARKET FOR GREEN HYDROGEN, BY COUNTRY 2022 AND 2032(%)
- FIGURE 20. HYDROGEN MARKET, BY END USE, 2022(%)
- FIGURE 21. COMPARATIVE SHARE ANALYSIS OF HYDROGEN MARKET FOR REFINING, BY COUNTRY 2022 AND 2032(%)
- FIGURE 22. COMPARATIVE SHARE ANALYSIS OF HYDROGEN MARKET FOR POWER GENERATION, BY COUNTRY 2022 AND 2032(%)
- FIGURE 23. COMPARATIVE SHARE ANALYSIS OF HYDROGEN MARKET FOR TRANSPORTATION, BY COUNTRY 2022 AND 2032(%)
- FIGURE 24. COMPARATIVE SHARE ANALYSIS OF HYDROGEN MARKET FOR FOOD PROCESSING, BY COUNTRY 2022 AND 2032(%)
- FIGURE 25. COMPARATIVE SHARE ANALYSIS OF HYDROGEN MARKET FOR OTHERS, BY COUNTRY 2022 AND 2032(%)
- FIGURE 26. HYDROGEN MARKET BY REGION, 2022
- FIGURE 27. U.S. HYDROGEN MARKET, 2022-2032 ($MILLION)
- FIGURE 28. CANADA HYDROGEN MARKET, 2022-2032 ($MILLION)
- FIGURE 29. MEXICO HYDROGEN MARKET, 2022-2032 ($MILLION)
- FIGURE 30. GERMANY HYDROGEN MARKET, 2022-2032 ($MILLION)
- FIGURE 31. FRANCE HYDROGEN MARKET, 2022-2032 ($MILLION)
- FIGURE 32. ITALY HYDROGEN MARKET, 2022-2032 ($MILLION)
- FIGURE 33. UK HYDROGEN MARKET, 2022-2032 ($MILLION)
- FIGURE 34. SPAIN HYDROGEN MARKET, 2022-2032 ($MILLION)
- FIGURE 35. REST OF EUROPE HYDROGEN MARKET, 2022-2032 ($MILLION)
- FIGURE 36. CHINA HYDROGEN MARKET, 2022-2032 ($MILLION)
- FIGURE 37. INDIA HYDROGEN MARKET, 2022-2032 ($MILLION)
- FIGURE 38. JAPAN HYDROGEN MARKET, 2022-2032 ($MILLION)
- FIGURE 39. SOUTH KOREA HYDROGEN MARKET, 2022-2032 ($MILLION)
- FIGURE 40. AUSTRALIA HYDROGEN MARKET, 2022-2032 ($MILLION)
- FIGURE 41. REST OF ASIA-PACIFIC HYDROGEN MARKET, 2022-2032 ($MILLION)
- FIGURE 42. BRAZIL HYDROGEN MARKET, 2022-2032 ($MILLION)
- FIGURE 43. SAUDI ARABIA HYDROGEN MARKET, 2022-2032 ($MILLION)
- FIGURE 44. SOUTH AFRICA HYDROGEN MARKET, 2022-2032 ($MILLION)
- FIGURE 45. REST OF LAMEA HYDROGEN MARKET, 2022-2032 ($MILLION)
- FIGURE 46. TOP WINNING STRATEGIES, BY YEAR
- FIGURE 47. TOP WINNING STRATEGIES, BY DEVELOPMENT
- FIGURE 48. TOP WINNING STRATEGIES, BY COMPANY
- FIGURE 49. PRODUCT MAPPING OF TOP 10 PLAYERS
- FIGURE 50. COMPETITIVE DASHBOARD
- FIGURE 51. COMPETITIVE HEATMAP: HYDROGEN MARKET
- FIGURE 52. TOP PLAYER POSITIONING, 2022
- FIGURE 53. AIR LIQUIDE: NET REVENUE, 2020-2022 ($MILLION)
- FIGURE 54. AIR LIQUIDE: REVENUE SHARE BY SEGMENT, 2022 (%)
- FIGURE 55. AIR LIQUIDE: REVENUE SHARE BY REGION, 2022 (%)
- FIGURE 56. MESSER GROUP: NET REVENUE, 2019-2021 ($MILLION)
- FIGURE 57. MESSER GROUP: REVENUE SHARE BY REGION, 2021 (%)
- FIGURE 58. PLUG POWER INC.: RESEARCH & DEVELOPMENT EXPENDITURE, 2019-2021 ($MILLION)
- FIGURE 59. PLUG POWER INC.: NET REVENUE, 2019-2021 ($MILLION)
- FIGURE 60. PLUG POWER INC.: REVENUE SHARE BY SEGMENT, 2021 (%)
- FIGURE 61. PLUG POWER INC.: REVENUE SHARE BY REGION, 2021 (%)
- FIGURE 62. NEL ASA: NET SALES, 2020-2022 ($MILLION)
- FIGURE 63. NEL ASA: RESEARCH & DEVELOPMENT EXPENDITURE, 2020-2022 ($MILLION)
- FIGURE 64. NEL ASA: REVENUE SHARE BY SEGMENT, 2022 (%)
- FIGURE 65. NEL ASA: REVENUE SHARE BY REGION, 2022 (%)
- FIGURE 66. LINDE PLC: NET SALES, 2020-2022 ($MILLION)
- FIGURE 67. LINDE PLC: RESEARCH & DEVELOPMENT EXPENDITURE, 2020-2022 ($MILLION)
- FIGURE 68. LINDE PLC: REVENUE SHARE BY SEGMENT, 2022 (%)
- FIGURE 69. LINDE PLC: REVENUE SHARE BY REGION, 2022 (%)
- FIGURE 70. FUELCELL ENERGY, INC.: RESEARCH & DEVELOPMENT EXPENDITURE, 2020-2022 ($MILLION)
- FIGURE 71. FUELCELL ENERGY, INC.: NET REVENUE, 2020-2022 ($MILLION)
- FIGURE 72. FUELCELL ENERGY, INC.: REVENUE SHARE BY SEGMENT, 2022 (%)
- FIGURE 73. FUELCELL ENERGY, INC.: REVENUE SHARE BY REGION, 2022 (%)
- FIGURE 74. AIR PRODUCTS AND CHEMICALS, INC.: NET REVENUE, 2020-2022 ($MILLION)
- FIGURE 75. AIR PRODUCTS AND CHEMICALS, INC.: REVENUE SHARE BY SEGMENT, 2022 (%)
- FIGURE 76. AIR PRODUCTS AND CHEMICALS, INC.: REVENUE SHARE BY REGION, 2022 (%)
- FIGURE 77. SHELL PLC.: NET REVENUE, 2020-2022 ($MILLION)
- FIGURE 78. SHELL PLC.: REVENUE SHARE BY SEGMENT, 2022 (%)
- FIGURE 79. SHELL PLC.: REVENUE SHARE BY REGION, 2022 (%)
- FIGURE 80. RELIANCE INDUSTRIES LTD: NET SALES, 2019-2021 ($MILLION)
- FIGURE 81. RELIANCE INDUSTRIES LTD: REVENUE SHARE BY SEGMENT, 2021 (%)
- FIGURE 82. RELIANCE INDUSTRIES LTD: REVENUE SHARE BY REGION, 2021 (%)
- FIGURE 83. INDIAN OIL CORPORATION LTD: NET REVENUE, 2020-2022 ($MILLION)
- FIGURE 84. INDIAN OIL CORPORATION LTD: REVENUE SHARE BY SEGMENT, 2022 (%)
 全球氢能市场:产业分析、规模、份额、成长、趋势与预测(2025-2032)
 2032 年氢气管道市场预测:按类型、距离、氢气形式、安装类型、管道结构、应用、最终用户和地区进行的全球分析
 重塑氢能经济:材料与硬体市场与技术 2025-2045
 资料库:氢(H2)及其衍生物计画
 粉红氢市场按技术类型、氢气生产能力、应用和最终用户产业划分 - 2025-2030 年全球预测
 氢的全球市场(2025年~2035年)
 2025年褐氢全球市场报告2025年全球氢能市场报告
 全球 4 型氢气瓶市场研究报告 - 产业分析、规模、份额、成长、趋势和预测 2025 年至 2033 年全球棕色氢市场研究报告-产业分析、规模、份额、成长、趋势和预测 2025 年至 2033 年