


 |
市场调查报告书
商品编码
1365763
BFSI数位转型市场:按组件、部署型态、公司规模、技术和最终用户:2023-2032 年全球市场机会分析和产业预测Digital Transformation in BFSI Market By Component, By Deployment Mode, By Enterprise Size, By Technology, By End User : Global Opportunity Analysis and Industry Forecast, 2023-2032 |
||||||
由于市场对巨量资料和业务分析的需求不断增加,BFSI 的数位转型市场从 2023 年到 2032 年可能会出现 16.6% 的大幅成长。
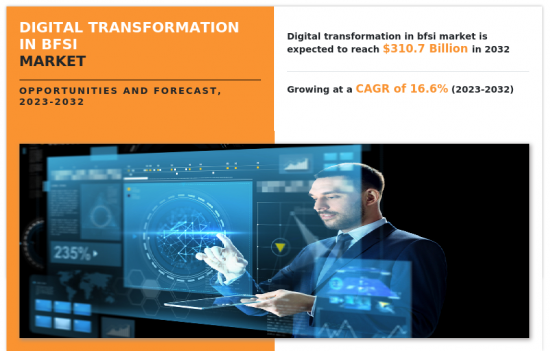
推动 BFSI数位转型市场成长的关键因素包括针对特定银行需求的客製化 IT 解决方案的需求不断增长。传统的银行解决方案无法跟上客户和组织不断变化的需求。因此,银行正在转向客製化 IT 解决方案来满足其特定需求并提供个人化体验和专业功能。此外,客製化软体的主要好处是提高客户和组织资料的安全性、减少系统网路攻击和网路钓鱼攻击的机会以及市场进入的成长。此外,用于推出新服务的数位管道的开拓被认为是 BFSI 推动数位位转型市场的重要因素。然而,数位技术的高实施和维修成本以及有关资料窃取和网路攻击的安全和隐私问题预计将阻碍市场成长。网路安全风险导致隐私丧失和资讯盗窃等经济威胁,对市场成长产生负面影响。另一方面,亚太地区和新兴国家越来越多地采用数位服务,预计将为预测期内的全球市场扩张提供利润丰厚的机会。亚洲国家的公司正在采用高效、简化的解决方案来改善客户体验并扩大客户群,从而为市场成长提供利润丰厚的机会。
目录
第1章简介
第2章执行摘要
第3章市场概况
- 市场定义和范围
- 主要发现
- 影响因素
- 主要投资机会
- 波特五力分析
- 市场动态
- 促进因素
- 增加满足特定银行需求的客製化 IT 解决方案
- 开拓数位管道以开发新服务
- 金融科技业对数位服务的需求不断增长
- 抑制因素
- 安全和隐私问题
- 机会
- 更多采用人工智慧和机器学习等尖端技术
- 亚太地区和新兴国家/地区数位服务的采用率不断提高
- 促进因素
- COVID-19 市场影响分析
第4章BFSI数位转型市场:按组成部分
- 概述
- 解决方案
- 服务
第5章BFSI数位转型市场:依部署型态
- 概述
- 本地
- 云
第6章BFSI数位转型市场:依公司规模
- 概述
- 大公司
- 中小企业
第7章BFSI数位转型市场:依技术分类
- 概述
- 人工智慧
- 云端运算
- 区块链
- 巨量资料和业务分析
- 网路安全
- 其他的
第8章BFSI数位转型市场:依最终用户分类
- 概述
- 银行
- 保险公司
- 其他的
第9章BFSI数位转型市场:按地区
- 概述
- 北美洲
- 美国
- 加拿大
- 欧洲
- 英国
- 德国
- 法国
- 义大利
- 西班牙
- 其他的
- 亚太地区
- 中国
- 日本
- 印度
- 澳洲
- 韩国
- 其他的
- 拉丁美洲
- 拉丁美洲
- 中东
- 非洲
第10章竞争形势
- 介绍
- 关键成功策略
- 10家主要企业产品图谱
- 竞争仪表板
- 竞争热图
- 2022年主要企业定位
第11章公司简介
- AlphaSense Inc.
- International Business Machines Corporation
- Oracle
- Google LLC
- Fujitsu
- SAP SE
- Microsoft Corporation
- Cognizant
- Accenture
- HID Global Corporation.
The Digital Transformation in BFSI Market is likely to experience a significant growth rate of 16.6% from 2023-2032 owing to increasing market demand for big data and business analytics- Allied Market Research
The key factors that drive the growth of the digital transformation in BFSI market include the increase in demand for customized IT solutions for specific banking needs. Traditional banking solutions are unable to meet the changing needs of customers and organizations. As a result, banks turn to customized IT solutions that meet their specific needs, delivering personalized experience and specialized functionality. Moreover, the main benefits of custom-written software are that it provides improved security for customers' and organizations' data and reduces the chances of system cyberattacks and phishing attacks, besides providing market access growth. In addition, exploration of digital channels to roll out new services is considered as an important factor that boosts the digital transformation in BFSI market. However, high implementation & maintenance cost of digital technology and security & privacy concerns related to data theft and cyber-attacks are expected to hamper the market growth. Cybersecurity risks lead to loss of privacy and financial threat, such as identity theft which negatively impacts the growth of the market. On the contrary, the rise in adoption of digital services among developing nations of Asia-Pacific and LAMEA countries is expected to offer remunerative opportunities for the expansion of the global market during the forecast period. Businesses across the Asian countries have adopted efficient and streamlined solutions for enhancing customer experience and to increase their customer base, which provides a lucrative opportunity for the market growth.
The digital transformation in BFSI market is segmented on the basis of component, deployment model, enterprise size, technology, end user and region. In terms of component, the market is bifurcated into solution and service. By deployment model, the market is divided into on-premises and cloud. On the basis enterprise size, the market is segmented into large enterprises and small and medium-sized enterprises. On the basis of technology, it is divided into artificial intelligence, cloud computing, blockchain, big data and business analytics, cyber security and others. As per end user, the market is bifurcated into banks, insurance companies and others. On the basis of region, it is analyzed across North America, Europe, Asia-Pacific, and LAMEA.
The report analyzes the profiles of key players operating in the digital transformation in BFSI market such as Accenture, Alphasense Inc., Cognizant, FUJITSU, Google, LLC, HID Global Corporation, International Business Machines Corporation, Microsoft Corporation, Oracle Corporation and SAP SE. These players have adopted various strategies to increase their market penetration and strengthen their position in the digital transformation in BFSI market.
Key Benefits for Stakeholders
- The study provides in-depth analysis of the global digital transformation in BFSI market along with the current & future trends to illustrate the imminent investment pockets.
- Information about key drivers, restrains, & opportunities and their impact analysis on the global digital transformation in BFSI market size is provided in the report.
- Porter's five forces analysis illustrates the potency of buyers and suppliers operating in the industry.
- The quantitative analysis of the global digital transformation in BFSI market from 2022 to 2032 is provided to determine the market potential.
Additional benefits you will get with this purchase are:
- Quarterly Update and* (only available with a corporate license, on listed price)
- 5 additional Company Profile of client Choice pre- or Post-purchase, as a free update.
- Free Upcoming Version on the Purchase of Five and Enterprise User License.
- 16 analyst hours of support* (post-purchase, if you find additional data requirements upon review of the report, you may receive support amounting to 16 analyst hours to solve questions, and post-sale queries)
- 15% Free Customization* (in case the scope or segment of the report does not match your requirements, 20% is equivalent to 3 working days of free work, applicable once)
- Free data Pack on the Five and Enterprise User License. (Excel version of the report)
- Free Updated report if the report is 6-12 months old or older.
- 24-hour priority response*
- Free Industry updates and white papers.
Possible Customization with this report (with additional cost and timeline talk to the sales executive to know more)
- Investment Opportunities
- Market share analysis of players by products/segments
- Additional company profiles with specific to client's interest
- Additional country or region analysis- market size and forecast
- SWOT Analysis
Key Market Segments
By Component
- Solution
- Service
By Deployment Mode
- On-Premise
- Cloud
By Enterprise Size
- Large Enterprises
- Small and Medium-sized Enterprises
By Technology
- Artificial Intelligence
- Cloud Computing
- Blockchain
- Big Data and Business Analytics
- Cybersecurity
- Others
By End User
- Banks
- Insurance Companies
- Others
By Region
- North America
- U.S.
- Canada
- Europe
- UK
- Germany
- France
- Italy
- Spain
- Rest of Europe
- Asia-Pacific
- China
- Japan
- India
- Australia
- South Korea
- Rest of Asia-Pacific
- LAMEA
- Latin America
- Middle East
- Africa
Key Market Players:
- Microsoft Corporation
- International Business Machines Corporation
- Oracle
- Cognizant
- Fujitsu
- SAP SE
- AlphaSense Inc.
- Google LLC
- HID Global Corporation.
- Accenture
TABLE OF CONTENTS
CHAPTER 1: INTRODUCTION
- 1.1. Report description
- 1.2. Key market segments
- 1.3. Key benefits to the stakeholders
- 1.4. Research Methodology
- 1.4.1. Primary research
- 1.4.2. Secondary research
- 1.4.3. Analyst tools and models
CHAPTER 2: EXECUTIVE SUMMARY
- 2.1. CXO Perspective
CHAPTER 3: MARKET OVERVIEW
- 3.1. Market definition and scope
- 3.2. Key findings
- 3.2.1. Top impacting factors
- 3.2.2. Top investment pockets
- 3.3. Porter's five forces analysis
- 3.3.1. Low bargaining power of suppliers
- 3.3.2. Low threat of new entrants
- 3.3.3. Low threat of substitutes
- 3.3.4. Low intensity of rivalry
- 3.3.5. Low bargaining power of buyers
- 3.4. Market dynamics
- 3.4.1. Drivers
- 3.4.1.1. Increase in customize IT solutions for specific banking needs
- 3.4.1.2. Exploration of digital channels to roll out new services
- 3.4.1.3. Surge in need of digital services among the fintech
- 3.4.1. Drivers
- 3.4.2. Restraints
- 3.4.2.1. Security and privacy concerns
- 3.4.3. Opportunities
- 3.4.3.1. Increase in adoption of advance technology AI and machine learning
- 3.4.3.2. Rise in adoption of digital services among developing nations of Asia-Pacific and LAMEA countries
- 3.5. COVID-19 Impact Analysis on the market
CHAPTER 4: DIGITAL TRANSFORMATION IN BFSI MARKET, BY COMPONENT
- 4.1. Overview
- 4.1.1. Market size and forecast
- 4.2. Solution
- 4.2.1. Key market trends, growth factors and opportunities
- 4.2.2. Market size and forecast, by region
- 4.2.3. Market share analysis by country
- 4.3. Service
- 4.3.1. Key market trends, growth factors and opportunities
- 4.3.2. Market size and forecast, by region
- 4.3.3. Market share analysis by country
CHAPTER 5: DIGITAL TRANSFORMATION IN BFSI MARKET, BY DEPLOYMENT MODE
- 5.1. Overview
- 5.1.1. Market size and forecast
- 5.2. On-Premise
- 5.2.1. Key market trends, growth factors and opportunities
- 5.2.2. Market size and forecast, by region
- 5.2.3. Market share analysis by country
- 5.3. Cloud
- 5.3.1. Key market trends, growth factors and opportunities
- 5.3.2. Market size and forecast, by region
- 5.3.3. Market share analysis by country
CHAPTER 6: DIGITAL TRANSFORMATION IN BFSI MARKET, BY ENTERPRISE SIZE
- 6.1. Overview
- 6.1.1. Market size and forecast
- 6.2. Large Enterprises
- 6.2.1. Key market trends, growth factors and opportunities
- 6.2.2. Market size and forecast, by region
- 6.2.3. Market share analysis by country
- 6.3. Small and Medium-sized Enterprises
- 6.3.1. Key market trends, growth factors and opportunities
- 6.3.2. Market size and forecast, by region
- 6.3.3. Market share analysis by country
CHAPTER 7: DIGITAL TRANSFORMATION IN BFSI MARKET, BY TECHNOLOGY
- 7.1. Overview
- 7.1.1. Market size and forecast
- 7.2. Artificial Intelligence
- 7.2.1. Key market trends, growth factors and opportunities
- 7.2.2. Market size and forecast, by region
- 7.2.3. Market share analysis by country
- 7.3. Cloud Computing
- 7.3.1. Key market trends, growth factors and opportunities
- 7.3.2. Market size and forecast, by region
- 7.3.3. Market share analysis by country
- 7.4. Blockchain
- 7.4.1. Key market trends, growth factors and opportunities
- 7.4.2. Market size and forecast, by region
- 7.4.3. Market share analysis by country
- 7.5. Big Data and Business Analytics
- 7.5.1. Key market trends, growth factors and opportunities
- 7.5.2. Market size and forecast, by region
- 7.5.3. Market share analysis by country
- 7.6. Cybersecurity
- 7.6.1. Key market trends, growth factors and opportunities
- 7.6.2. Market size and forecast, by region
- 7.6.3. Market share analysis by country
- 7.7. Others
- 7.7.1. Key market trends, growth factors and opportunities
- 7.7.2. Market size and forecast, by region
- 7.7.3. Market share analysis by country
CHAPTER 8: DIGITAL TRANSFORMATION IN BFSI MARKET, BY END USER
- 8.1. Overview
- 8.1.1. Market size and forecast
- 8.2. Banks
- 8.2.1. Key market trends, growth factors and opportunities
- 8.2.2. Market size and forecast, by region
- 8.2.3. Market share analysis by country
- 8.3. Insurance Companies
- 8.3.1. Key market trends, growth factors and opportunities
- 8.3.2. Market size and forecast, by region
- 8.3.3. Market share analysis by country
- 8.4. Others
- 8.4.1. Key market trends, growth factors and opportunities
- 8.4.2. Market size and forecast, by region
- 8.4.3. Market share analysis by country
CHAPTER 9: DIGITAL TRANSFORMATION IN BFSI MARKET, BY REGION
- 9.1. Overview
- 9.1.1. Market size and forecast By Region
- 9.2. North America
- 9.2.1. Key market trends, growth factors and opportunities
- 9.2.2. Market size and forecast, by Component
- 9.2.3. Market size and forecast, by Deployment Mode
- 9.2.4. Market size and forecast, by Enterprise Size
- 9.2.5. Market size and forecast, by Technology
- 9.2.6. Market size and forecast, by End User
- 9.2.7. Market size and forecast, by country
- 9.2.7.1. U.S.
- 9.2.7.1.1. Market size and forecast, by Component
- 9.2.7.1.2. Market size and forecast, by Deployment Mode
- 9.2.7.1.3. Market size and forecast, by Enterprise Size
- 9.2.7.1.4. Market size and forecast, by Technology
- 9.2.7.1.5. Market size and forecast, by End User
- 9.2.7.2. Canada
- 9.2.7.2.1. Market size and forecast, by Component
- 9.2.7.2.2. Market size and forecast, by Deployment Mode
- 9.2.7.2.3. Market size and forecast, by Enterprise Size
- 9.2.7.2.4. Market size and forecast, by Technology
- 9.2.7.2.5. Market size and forecast, by End User
- 9.3. Europe
- 9.3.1. Key market trends, growth factors and opportunities
- 9.3.2. Market size and forecast, by Component
- 9.3.3. Market size and forecast, by Deployment Mode
- 9.3.4. Market size and forecast, by Enterprise Size
- 9.3.5. Market size and forecast, by Technology
- 9.3.6. Market size and forecast, by End User
- 9.3.7. Market size and forecast, by country
- 9.3.7.1. UK
- 9.3.7.1.1. Market size and forecast, by Component
- 9.3.7.1.2. Market size and forecast, by Deployment Mode
- 9.3.7.1.3. Market size and forecast, by Enterprise Size
- 9.3.7.1.4. Market size and forecast, by Technology
- 9.3.7.1.5. Market size and forecast, by End User
- 9.3.7.2. Germany
- 9.3.7.2.1. Market size and forecast, by Component
- 9.3.7.2.2. Market size and forecast, by Deployment Mode
- 9.3.7.2.3. Market size and forecast, by Enterprise Size
- 9.3.7.2.4. Market size and forecast, by Technology
- 9.3.7.2.5. Market size and forecast, by End User
- 9.3.7.3. France
- 9.3.7.3.1. Market size and forecast, by Component
- 9.3.7.3.2. Market size and forecast, by Deployment Mode
- 9.3.7.3.3. Market size and forecast, by Enterprise Size
- 9.3.7.3.4. Market size and forecast, by Technology
- 9.3.7.3.5. Market size and forecast, by End User
- 9.3.7.4. Italy
- 9.3.7.4.1. Market size and forecast, by Component
- 9.3.7.4.2. Market size and forecast, by Deployment Mode
- 9.3.7.4.3. Market size and forecast, by Enterprise Size
- 9.3.7.4.4. Market size and forecast, by Technology
- 9.3.7.4.5. Market size and forecast, by End User
- 9.3.7.5. Spain
- 9.3.7.5.1. Market size and forecast, by Component
- 9.3.7.5.2. Market size and forecast, by Deployment Mode
- 9.3.7.5.3. Market size and forecast, by Enterprise Size
- 9.3.7.5.4. Market size and forecast, by Technology
- 9.3.7.5.5. Market size and forecast, by End User
- 9.3.7.6. Rest of Europe
- 9.3.7.6.1. Market size and forecast, by Component
- 9.3.7.6.2. Market size and forecast, by Deployment Mode
- 9.3.7.6.3. Market size and forecast, by Enterprise Size
- 9.3.7.6.4. Market size and forecast, by Technology
- 9.3.7.6.5. Market size and forecast, by End User
- 9.4. Asia-Pacific
- 9.4.1. Key market trends, growth factors and opportunities
- 9.4.2. Market size and forecast, by Component
- 9.4.3. Market size and forecast, by Deployment Mode
- 9.4.4. Market size and forecast, by Enterprise Size
- 9.4.5. Market size and forecast, by Technology
- 9.4.6. Market size and forecast, by End User
- 9.4.7. Market size and forecast, by country
- 9.4.7.1. China
- 9.4.7.1.1. Market size and forecast, by Component
- 9.4.7.1.2. Market size and forecast, by Deployment Mode
- 9.4.7.1.3. Market size and forecast, by Enterprise Size
- 9.4.7.1.4. Market size and forecast, by Technology
- 9.4.7.1.5. Market size and forecast, by End User
- 9.4.7.2. Japan
- 9.4.7.2.1. Market size and forecast, by Component
- 9.4.7.2.2. Market size and forecast, by Deployment Mode
- 9.4.7.2.3. Market size and forecast, by Enterprise Size
- 9.4.7.2.4. Market size and forecast, by Technology
- 9.4.7.2.5. Market size and forecast, by End User
- 9.4.7.3. India
- 9.4.7.3.1. Market size and forecast, by Component
- 9.4.7.3.2. Market size and forecast, by Deployment Mode
- 9.4.7.3.3. Market size and forecast, by Enterprise Size
- 9.4.7.3.4. Market size and forecast, by Technology
- 9.4.7.3.5. Market size and forecast, by End User
- 9.4.7.4. Australia
- 9.4.7.4.1. Market size and forecast, by Component
- 9.4.7.4.2. Market size and forecast, by Deployment Mode
- 9.4.7.4.3. Market size and forecast, by Enterprise Size
- 9.4.7.4.4. Market size and forecast, by Technology
- 9.4.7.4.5. Market size and forecast, by End User
- 9.4.7.5. South Korea
- 9.4.7.5.1. Market size and forecast, by Component
- 9.4.7.5.2. Market size and forecast, by Deployment Mode
- 9.4.7.5.3. Market size and forecast, by Enterprise Size
- 9.4.7.5.4. Market size and forecast, by Technology
- 9.4.7.5.5. Market size and forecast, by End User
- 9.4.7.6. Rest of Asia-Pacific
- 9.4.7.6.1. Market size and forecast, by Component
- 9.4.7.6.2. Market size and forecast, by Deployment Mode
- 9.4.7.6.3. Market size and forecast, by Enterprise Size
- 9.4.7.6.4. Market size and forecast, by Technology
- 9.4.7.6.5. Market size and forecast, by End User
- 9.5. LAMEA
- 9.5.1. Key market trends, growth factors and opportunities
- 9.5.2. Market size and forecast, by Component
- 9.5.3. Market size and forecast, by Deployment Mode
- 9.5.4. Market size and forecast, by Enterprise Size
- 9.5.5. Market size and forecast, by Technology
- 9.5.6. Market size and forecast, by End User
- 9.5.7. Market size and forecast, by country
- 9.5.7.1. Latin America
- 9.5.7.1.1. Market size and forecast, by Component
- 9.5.7.1.2. Market size and forecast, by Deployment Mode
- 9.5.7.1.3. Market size and forecast, by Enterprise Size
- 9.5.7.1.4. Market size and forecast, by Technology
- 9.5.7.1.5. Market size and forecast, by End User
- 9.5.7.2. Middle East
- 9.5.7.2.1. Market size and forecast, by Component
- 9.5.7.2.2. Market size and forecast, by Deployment Mode
- 9.5.7.2.3. Market size and forecast, by Enterprise Size
- 9.5.7.2.4. Market size and forecast, by Technology
- 9.5.7.2.5. Market size and forecast, by End User
- 9.5.7.3. Africa
- 9.5.7.3.1. Market size and forecast, by Component
- 9.5.7.3.2. Market size and forecast, by Deployment Mode
- 9.5.7.3.3. Market size and forecast, by Enterprise Size
- 9.5.7.3.4. Market size and forecast, by Technology
- 9.5.7.3.5. Market size and forecast, by End User
CHAPTER 10: COMPETITIVE LANDSCAPE
- 10.1. Introduction
- 10.2. Top winning strategies
- 10.3. Product Mapping of Top 10 Player
- 10.4. Competitive Dashboard
- 10.5. Competitive Heatmap
- 10.6. Top player positioning, 2022
CHAPTER 11: COMPANY PROFILES
- 11.1. AlphaSense Inc.
- 11.1.1. Company overview
- 11.1.2. Key Executives
- 11.1.3. Company snapshot
- 11.1.4. Operating business segments
- 11.1.5. Product portfolio
- 11.1.6. Business performance
- 11.1.7. Key strategic moves and developments
- 11.2. International Business Machines Corporation
- 11.2.1. Company overview
- 11.2.2. Key Executives
- 11.2.3. Company snapshot
- 11.2.4. Operating business segments
- 11.2.5. Product portfolio
- 11.2.6. Business performance
- 11.2.7. Key strategic moves and developments
- 11.3. Oracle
- 11.3.1. Company overview
- 11.3.2. Key Executives
- 11.3.3. Company snapshot
- 11.3.4. Operating business segments
- 11.3.5. Product portfolio
- 11.3.6. Business performance
- 11.3.7. Key strategic moves and developments
- 11.4. Google LLC
- 11.4.1. Company overview
- 11.4.2. Key Executives
- 11.4.3. Company snapshot
- 11.4.4. Operating business segments
- 11.4.5. Product portfolio
- 11.4.6. Business performance
- 11.4.7. Key strategic moves and developments
- 11.5. Fujitsu
- 11.5.1. Company overview
- 11.5.2. Key Executives
- 11.5.3. Company snapshot
- 11.5.4. Operating business segments
- 11.5.5. Product portfolio
- 11.5.6. Business performance
- 11.5.7. Key strategic moves and developments
- 11.6. SAP SE
- 11.6.1. Company overview
- 11.6.2. Key Executives
- 11.6.3. Company snapshot
- 11.6.4. Operating business segments
- 11.6.5. Product portfolio
- 11.6.6. Business performance
- 11.6.7. Key strategic moves and developments
- 11.7. Microsoft Corporation
- 11.7.1. Company overview
- 11.7.2. Key Executives
- 11.7.3. Company snapshot
- 11.7.4. Operating business segments
- 11.7.5. Product portfolio
- 11.7.6. Business performance
- 11.7.7. Key strategic moves and developments
- 11.8. Cognizant
- 11.8.1. Company overview
- 11.8.2. Key Executives
- 11.8.3. Company snapshot
- 11.8.4. Operating business segments
- 11.8.5. Product portfolio
- 11.8.6. Business performance
- 11.8.7. Key strategic moves and developments
- 11.9. Accenture
- 11.9.1. Company overview
- 11.9.2. Key Executives
- 11.9.3. Company snapshot
- 11.9.4. Operating business segments
- 11.9.5. Product portfolio
- 11.9.6. Business performance
- 11.9.7. Key strategic moves and developments
- 11.10. HID Global Corporation.
- 11.10.1. Company overview
- 11.10.2. Key Executives
- 11.10.3. Company snapshot
- 11.10.4. Operating business segments
- 11.10.5. Product portfolio
- 11.10.6. Business performance
- 11.10.7. Key strategic moves and developments
LIST OF TABLES
- TABLE 01. GLOBAL DIGITAL TRANSFORMATION IN BFSI MARKET, BY COMPONENT, 2022-2032 ($BILLION)
- TABLE 02. DIGITAL TRANSFORMATION IN BFSI MARKET FOR SOLUTION, BY REGION, 2022-2032 ($BILLION)
- TABLE 03. DIGITAL TRANSFORMATION IN BFSI MARKET FOR SERVICE, BY REGION, 2022-2032 ($BILLION)
- TABLE 04. GLOBAL DIGITAL TRANSFORMATION IN BFSI MARKET, BY DEPLOYMENT MODE, 2022-2032 ($BILLION)
- TABLE 05. DIGITAL TRANSFORMATION IN BFSI MARKET FOR ON-PREMISE, BY REGION, 2022-2032 ($BILLION)
- TABLE 06. DIGITAL TRANSFORMATION IN BFSI MARKET FOR CLOUD, BY REGION, 2022-2032 ($BILLION)
- TABLE 07. GLOBAL DIGITAL TRANSFORMATION IN BFSI MARKET, BY ENTERPRISE SIZE, 2022-2032 ($BILLION)
- TABLE 08. DIGITAL TRANSFORMATION IN BFSI MARKET FOR LARGE ENTERPRISES, BY REGION, 2022-2032 ($BILLION)
- TABLE 09. DIGITAL TRANSFORMATION IN BFSI MARKET FOR SMALL AND MEDIUM-SIZED ENTERPRISES, BY REGION, 2022-2032 ($BILLION)
- TABLE 10. GLOBAL DIGITAL TRANSFORMATION IN BFSI MARKET, BY TECHNOLOGY, 2022-2032 ($BILLION)
- TABLE 11. DIGITAL TRANSFORMATION IN BFSI MARKET FOR ARTIFICIAL INTELLIGENCE, BY REGION, 2022-2032 ($BILLION)
- TABLE 12. DIGITAL TRANSFORMATION IN BFSI MARKET FOR CLOUD COMPUTING, BY REGION, 2022-2032 ($BILLION)
- TABLE 13. DIGITAL TRANSFORMATION IN BFSI MARKET FOR BLOCKCHAIN, BY REGION, 2022-2032 ($BILLION)
- TABLE 14. DIGITAL TRANSFORMATION IN BFSI MARKET FOR BIG DATA AND BUSINESS ANALYTICS, BY REGION, 2022-2032 ($BILLION)
- TABLE 15. DIGITAL TRANSFORMATION IN BFSI MARKET FOR CYBERSECURITY, BY REGION, 2022-2032 ($BILLION)
- TABLE 16. DIGITAL TRANSFORMATION IN BFSI MARKET FOR OTHERS, BY REGION, 2022-2032 ($BILLION)
- TABLE 17. GLOBAL DIGITAL TRANSFORMATION IN BFSI MARKET, BY END USER, 2022-2032 ($BILLION)
- TABLE 18. DIGITAL TRANSFORMATION IN BFSI MARKET FOR BANKS, BY REGION, 2022-2032 ($BILLION)
- TABLE 19. DIGITAL TRANSFORMATION IN BFSI MARKET FOR INSURANCE COMPANIES, BY REGION, 2022-2032 ($BILLION)
- TABLE 20. DIGITAL TRANSFORMATION IN BFSI MARKET FOR OTHERS, BY REGION, 2022-2032 ($BILLION)
- TABLE 21. DIGITAL TRANSFORMATION IN BFSI MARKET, BY REGION, 2022-2032 ($BILLION)
- TABLE 22. NORTH AMERICA DIGITAL TRANSFORMATION IN BFSI MARKET, BY COMPONENT, 2022-2032 ($BILLION)
- TABLE 23. NORTH AMERICA DIGITAL TRANSFORMATION IN BFSI MARKET, BY DEPLOYMENT MODE, 2022-2032 ($BILLION)
- TABLE 24. NORTH AMERICA DIGITAL TRANSFORMATION IN BFSI MARKET, BY ENTERPRISE SIZE, 2022-2032 ($BILLION)
- TABLE 25. NORTH AMERICA DIGITAL TRANSFORMATION IN BFSI MARKET, BY TECHNOLOGY, 2022-2032 ($BILLION)
- TABLE 26. NORTH AMERICA DIGITAL TRANSFORMATION IN BFSI MARKET, BY END USER, 2022-2032 ($BILLION)
- TABLE 27. NORTH AMERICA DIGITAL TRANSFORMATION IN BFSI MARKET, BY COUNTRY, 2022-2032 ($BILLION)
- TABLE 28. U.S. DIGITAL TRANSFORMATION IN BFSI MARKET, BY COMPONENT, 2022-2032 ($BILLION)
- TABLE 29. U.S. DIGITAL TRANSFORMATION IN BFSI MARKET, BY DEPLOYMENT MODE, 2022-2032 ($BILLION)
- TABLE 30. U.S. DIGITAL TRANSFORMATION IN BFSI MARKET, BY ENTERPRISE SIZE, 2022-2032 ($BILLION)
- TABLE 31. U.S. DIGITAL TRANSFORMATION IN BFSI MARKET, BY TECHNOLOGY, 2022-2032 ($BILLION)
- TABLE 32. U.S. DIGITAL TRANSFORMATION IN BFSI MARKET, BY END USER, 2022-2032 ($BILLION)
- TABLE 33. CANADA DIGITAL TRANSFORMATION IN BFSI MARKET, BY COMPONENT, 2022-2032 ($BILLION)
- TABLE 34. CANADA DIGITAL TRANSFORMATION IN BFSI MARKET, BY DEPLOYMENT MODE, 2022-2032 ($BILLION)
- TABLE 35. CANADA DIGITAL TRANSFORMATION IN BFSI MARKET, BY ENTERPRISE SIZE, 2022-2032 ($BILLION)
- TABLE 36. CANADA DIGITAL TRANSFORMATION IN BFSI MARKET, BY TECHNOLOGY, 2022-2032 ($BILLION)
- TABLE 37. CANADA DIGITAL TRANSFORMATION IN BFSI MARKET, BY END USER, 2022-2032 ($BILLION)
- TABLE 38. EUROPE DIGITAL TRANSFORMATION IN BFSI MARKET, BY COMPONENT, 2022-2032 ($BILLION)
- TABLE 39. EUROPE DIGITAL TRANSFORMATION IN BFSI MARKET, BY DEPLOYMENT MODE, 2022-2032 ($BILLION)
- TABLE 40. EUROPE DIGITAL TRANSFORMATION IN BFSI MARKET, BY ENTERPRISE SIZE, 2022-2032 ($BILLION)
- TABLE 41. EUROPE DIGITAL TRANSFORMATION IN BFSI MARKET, BY TECHNOLOGY, 2022-2032 ($BILLION)
- TABLE 42. EUROPE DIGITAL TRANSFORMATION IN BFSI MARKET, BY END USER, 2022-2032 ($BILLION)
- TABLE 43. EUROPE DIGITAL TRANSFORMATION IN BFSI MARKET, BY COUNTRY, 2022-2032 ($BILLION)
- TABLE 44. UK DIGITAL TRANSFORMATION IN BFSI MARKET, BY COMPONENT, 2022-2032 ($BILLION)
- TABLE 45. UK DIGITAL TRANSFORMATION IN BFSI MARKET, BY DEPLOYMENT MODE, 2022-2032 ($BILLION)
- TABLE 46. UK DIGITAL TRANSFORMATION IN BFSI MARKET, BY ENTERPRISE SIZE, 2022-2032 ($BILLION)
- TABLE 47. UK DIGITAL TRANSFORMATION IN BFSI MARKET, BY TECHNOLOGY, 2022-2032 ($BILLION)
- TABLE 48. UK DIGITAL TRANSFORMATION IN BFSI MARKET, BY END USER, 2022-2032 ($BILLION)
- TABLE 49. GERMANY DIGITAL TRANSFORMATION IN BFSI MARKET, BY COMPONENT, 2022-2032 ($BILLION)
- TABLE 50. GERMANY DIGITAL TRANSFORMATION IN BFSI MARKET, BY DEPLOYMENT MODE, 2022-2032 ($BILLION)
- TABLE 51. GERMANY DIGITAL TRANSFORMATION IN BFSI MARKET, BY ENTERPRISE SIZE, 2022-2032 ($BILLION)
- TABLE 52. GERMANY DIGITAL TRANSFORMATION IN BFSI MARKET, BY TECHNOLOGY, 2022-2032 ($BILLION)
- TABLE 53. GERMANY DIGITAL TRANSFORMATION IN BFSI MARKET, BY END USER, 2022-2032 ($BILLION)
- TABLE 54. FRANCE DIGITAL TRANSFORMATION IN BFSI MARKET, BY COMPONENT, 2022-2032 ($BILLION)
- TABLE 55. FRANCE DIGITAL TRANSFORMATION IN BFSI MARKET, BY DEPLOYMENT MODE, 2022-2032 ($BILLION)
- TABLE 56. FRANCE DIGITAL TRANSFORMATION IN BFSI MARKET, BY ENTERPRISE SIZE, 2022-2032 ($BILLION)
- TABLE 57. FRANCE DIGITAL TRANSFORMATION IN BFSI MARKET, BY TECHNOLOGY, 2022-2032 ($BILLION)
- TABLE 58. FRANCE DIGITAL TRANSFORMATION IN BFSI MARKET, BY END USER, 2022-2032 ($BILLION)
- TABLE 59. ITALY DIGITAL TRANSFORMATION IN BFSI MARKET, BY COMPONENT, 2022-2032 ($BILLION)
- TABLE 60. ITALY DIGITAL TRANSFORMATION IN BFSI MARKET, BY DEPLOYMENT MODE, 2022-2032 ($BILLION)
- TABLE 61. ITALY DIGITAL TRANSFORMATION IN BFSI MARKET, BY ENTERPRISE SIZE, 2022-2032 ($BILLION)
- TABLE 62. ITALY DIGITAL TRANSFORMATION IN BFSI MARKET, BY TECHNOLOGY, 2022-2032 ($BILLION)
- TABLE 63. ITALY DIGITAL TRANSFORMATION IN BFSI MARKET, BY END USER, 2022-2032 ($BILLION)
- TABLE 64. SPAIN DIGITAL TRANSFORMATION IN BFSI MARKET, BY COMPONENT, 2022-2032 ($BILLION)
- TABLE 65. SPAIN DIGITAL TRANSFORMATION IN BFSI MARKET, BY DEPLOYMENT MODE, 2022-2032 ($BILLION)
- TABLE 66. SPAIN DIGITAL TRANSFORMATION IN BFSI MARKET, BY ENTERPRISE SIZE, 2022-2032 ($BILLION)
- TABLE 67. SPAIN DIGITAL TRANSFORMATION IN BFSI MARKET, BY TECHNOLOGY, 2022-2032 ($BILLION)
- TABLE 68. SPAIN DIGITAL TRANSFORMATION IN BFSI MARKET, BY END USER, 2022-2032 ($BILLION)
- TABLE 69. REST OF EUROPE DIGITAL TRANSFORMATION IN BFSI MARKET, BY COMPONENT, 2022-2032 ($BILLION)
- TABLE 70. REST OF EUROPE DIGITAL TRANSFORMATION IN BFSI MARKET, BY DEPLOYMENT MODE, 2022-2032 ($BILLION)
- TABLE 71. REST OF EUROPE DIGITAL TRANSFORMATION IN BFSI MARKET, BY ENTERPRISE SIZE, 2022-2032 ($BILLION)
- TABLE 72. REST OF EUROPE DIGITAL TRANSFORMATION IN BFSI MARKET, BY TECHNOLOGY, 2022-2032 ($BILLION)
- TABLE 73. REST OF EUROPE DIGITAL TRANSFORMATION IN BFSI MARKET, BY END USER, 2022-2032 ($BILLION)
- TABLE 74. ASIA-PACIFIC DIGITAL TRANSFORMATION IN BFSI MARKET, BY COMPONENT, 2022-2032 ($BILLION)
- TABLE 75. ASIA-PACIFIC DIGITAL TRANSFORMATION IN BFSI MARKET, BY DEPLOYMENT MODE, 2022-2032 ($BILLION)
- TABLE 76. ASIA-PACIFIC DIGITAL TRANSFORMATION IN BFSI MARKET, BY ENTERPRISE SIZE, 2022-2032 ($BILLION)
- TABLE 77. ASIA-PACIFIC DIGITAL TRANSFORMATION IN BFSI MARKET, BY TECHNOLOGY, 2022-2032 ($BILLION)
- TABLE 78. ASIA-PACIFIC DIGITAL TRANSFORMATION IN BFSI MARKET, BY END USER, 2022-2032 ($BILLION)
- TABLE 79. ASIA-PACIFIC DIGITAL TRANSFORMATION IN BFSI MARKET, BY COUNTRY, 2022-2032 ($BILLION)
- TABLE 80. CHINA DIGITAL TRANSFORMATION IN BFSI MARKET, BY COMPONENT, 2022-2032 ($BILLION)
- TABLE 81. CHINA DIGITAL TRANSFORMATION IN BFSI MARKET, BY DEPLOYMENT MODE, 2022-2032 ($BILLION)
- TABLE 82. CHINA DIGITAL TRANSFORMATION IN BFSI MARKET, BY ENTERPRISE SIZE, 2022-2032 ($BILLION)
- TABLE 83. CHINA DIGITAL TRANSFORMATION IN BFSI MARKET, BY TECHNOLOGY, 2022-2032 ($BILLION)
- TABLE 84. CHINA DIGITAL TRANSFORMATION IN BFSI MARKET, BY END USER, 2022-2032 ($BILLION)
- TABLE 85. JAPAN DIGITAL TRANSFORMATION IN BFSI MARKET, BY COMPONENT, 2022-2032 ($BILLION)
- TABLE 86. JAPAN DIGITAL TRANSFORMATION IN BFSI MARKET, BY DEPLOYMENT MODE, 2022-2032 ($BILLION)
- TABLE 87. JAPAN DIGITAL TRANSFORMATION IN BFSI MARKET, BY ENTERPRISE SIZE, 2022-2032 ($BILLION)
- TABLE 88. JAPAN DIGITAL TRANSFORMATION IN BFSI MARKET, BY TECHNOLOGY, 2022-2032 ($BILLION)
- TABLE 89. JAPAN DIGITAL TRANSFORMATION IN BFSI MARKET, BY END USER, 2022-2032 ($BILLION)
- TABLE 90. INDIA DIGITAL TRANSFORMATION IN BFSI MARKET, BY COMPONENT, 2022-2032 ($BILLION)
- TABLE 91. INDIA DIGITAL TRANSFORMATION IN BFSI MARKET, BY DEPLOYMENT MODE, 2022-2032 ($BILLION)
- TABLE 92. INDIA DIGITAL TRANSFORMATION IN BFSI MARKET, BY ENTERPRISE SIZE, 2022-2032 ($BILLION)
- TABLE 93. INDIA DIGITAL TRANSFORMATION IN BFSI MARKET, BY TECHNOLOGY, 2022-2032 ($BILLION)
- TABLE 94. INDIA DIGITAL TRANSFORMATION IN BFSI MARKET, BY END USER, 2022-2032 ($BILLION)
- TABLE 95. AUSTRALIA DIGITAL TRANSFORMATION IN BFSI MARKET, BY COMPONENT, 2022-2032 ($BILLION)
- TABLE 96. AUSTRALIA DIGITAL TRANSFORMATION IN BFSI MARKET, BY DEPLOYMENT MODE, 2022-2032 ($BILLION)
- TABLE 97. AUSTRALIA DIGITAL TRANSFORMATION IN BFSI MARKET, BY ENTERPRISE SIZE, 2022-2032 ($BILLION)
- TABLE 98. AUSTRALIA DIGITAL TRANSFORMATION IN BFSI MARKET, BY TECHNOLOGY, 2022-2032 ($BILLION)
- TABLE 99. AUSTRALIA DIGITAL TRANSFORMATION IN BFSI MARKET, BY END USER, 2022-2032 ($BILLION)
- TABLE 100. SOUTH KOREA DIGITAL TRANSFORMATION IN BFSI MARKET, BY COMPONENT, 2022-2032 ($BILLION)
- TABLE 101. SOUTH KOREA DIGITAL TRANSFORMATION IN BFSI MARKET, BY DEPLOYMENT MODE, 2022-2032 ($BILLION)
- TABLE 102. SOUTH KOREA DIGITAL TRANSFORMATION IN BFSI MARKET, BY ENTERPRISE SIZE, 2022-2032 ($BILLION)
- TABLE 103. SOUTH KOREA DIGITAL TRANSFORMATION IN BFSI MARKET, BY TECHNOLOGY, 2022-2032 ($BILLION)
- TABLE 104. SOUTH KOREA DIGITAL TRANSFORMATION IN BFSI MARKET, BY END USER, 2022-2032 ($BILLION)
- TABLE 105. REST OF ASIA-PACIFIC DIGITAL TRANSFORMATION IN BFSI MARKET, BY COMPONENT, 2022-2032 ($BILLION)
- TABLE 106. REST OF ASIA-PACIFIC DIGITAL TRANSFORMATION IN BFSI MARKET, BY DEPLOYMENT MODE, 2022-2032 ($BILLION)
- TABLE 107. REST OF ASIA-PACIFIC DIGITAL TRANSFORMATION IN BFSI MARKET, BY ENTERPRISE SIZE, 2022-2032 ($BILLION)
- TABLE 108. REST OF ASIA-PACIFIC DIGITAL TRANSFORMATION IN BFSI MARKET, BY TECHNOLOGY, 2022-2032 ($BILLION)
- TABLE 109. REST OF ASIA-PACIFIC DIGITAL TRANSFORMATION IN BFSI MARKET, BY END USER, 2022-2032 ($BILLION)
- TABLE 110. LAMEA DIGITAL TRANSFORMATION IN BFSI MARKET, BY COMPONENT, 2022-2032 ($BILLION)
- TABLE 111. LAMEA DIGITAL TRANSFORMATION IN BFSI MARKET, BY DEPLOYMENT MODE, 2022-2032 ($BILLION)
- TABLE 112. LAMEA DIGITAL TRANSFORMATION IN BFSI MARKET, BY ENTERPRISE SIZE, 2022-2032 ($BILLION)
- TABLE 113. LAMEA DIGITAL TRANSFORMATION IN BFSI MARKET, BY TECHNOLOGY, 2022-2032 ($BILLION)
- TABLE 114. LAMEA DIGITAL TRANSFORMATION IN BFSI MARKET, BY END USER, 2022-2032 ($BILLION)
- TABLE 115. LAMEA DIGITAL TRANSFORMATION IN BFSI MARKET, BY COUNTRY, 2022-2032 ($BILLION)
- TABLE 116. LATIN AMERICA DIGITAL TRANSFORMATION IN BFSI MARKET, BY COMPONENT, 2022-2032 ($BILLION)
- TABLE 117. LATIN AMERICA DIGITAL TRANSFORMATION IN BFSI MARKET, BY DEPLOYMENT MODE, 2022-2032 ($BILLION)
- TABLE 118. LATIN AMERICA DIGITAL TRANSFORMATION IN BFSI MARKET, BY ENTERPRISE SIZE, 2022-2032 ($BILLION)
- TABLE 119. LATIN AMERICA DIGITAL TRANSFORMATION IN BFSI MARKET, BY TECHNOLOGY, 2022-2032 ($BILLION)
- TABLE 120. LATIN AMERICA DIGITAL TRANSFORMATION IN BFSI MARKET, BY END USER, 2022-2032 ($BILLION)
- TABLE 121. MIDDLE EAST DIGITAL TRANSFORMATION IN BFSI MARKET, BY COMPONENT, 2022-2032 ($BILLION)
- TABLE 122. MIDDLE EAST DIGITAL TRANSFORMATION IN BFSI MARKET, BY DEPLOYMENT MODE, 2022-2032 ($BILLION)
- TABLE 123. MIDDLE EAST DIGITAL TRANSFORMATION IN BFSI MARKET, BY ENTERPRISE SIZE, 2022-2032 ($BILLION)
- TABLE 124. MIDDLE EAST DIGITAL TRANSFORMATION IN BFSI MARKET, BY TECHNOLOGY, 2022-2032 ($BILLION)
- TABLE 125. MIDDLE EAST DIGITAL TRANSFORMATION IN BFSI MARKET, BY END USER, 2022-2032 ($BILLION)
- TABLE 126. AFRICA DIGITAL TRANSFORMATION IN BFSI MARKET, BY COMPONENT, 2022-2032 ($BILLION)
- TABLE 127. AFRICA DIGITAL TRANSFORMATION IN BFSI MARKET, BY DEPLOYMENT MODE, 2022-2032 ($BILLION)
- TABLE 128. AFRICA DIGITAL TRANSFORMATION IN BFSI MARKET, BY ENTERPRISE SIZE, 2022-2032 ($BILLION)
- TABLE 129. AFRICA DIGITAL TRANSFORMATION IN BFSI MARKET, BY TECHNOLOGY, 2022-2032 ($BILLION)
- TABLE 130. AFRICA DIGITAL TRANSFORMATION IN BFSI MARKET, BY END USER, 2022-2032 ($BILLION)
- TABLE 131. ALPHASENSE INC.: KEY EXECUTIVES
- TABLE 132. ALPHASENSE INC.: COMPANY SNAPSHOT
- TABLE 133. ALPHASENSE INC.: PRODUCT SEGMENTS
- TABLE 134. ALPHASENSE INC.: PRODUCT PORTFOLIO
- TABLE 135. ALPHASENSE INC.: KEY STRATERGIES
- TABLE 136. INTERNATIONAL BUSINESS MACHINES CORPORATION: KEY EXECUTIVES
- TABLE 137. INTERNATIONAL BUSINESS MACHINES CORPORATION: COMPANY SNAPSHOT
- TABLE 138. INTERNATIONAL BUSINESS MACHINES CORPORATION: SERVICE SEGMENTS
- TABLE 139. INTERNATIONAL BUSINESS MACHINES CORPORATION: PRODUCT PORTFOLIO
- TABLE 140. INTERNATIONAL BUSINESS MACHINES CORPORATION: KEY STRATERGIES
- TABLE 141. ORACLE: KEY EXECUTIVES
- TABLE 142. ORACLE: COMPANY SNAPSHOT
- TABLE 143. ORACLE: SERVICE SEGMENTS
- TABLE 144. ORACLE: PRODUCT PORTFOLIO
- TABLE 145. ORACLE: KEY STRATERGIES
- TABLE 146. GOOGLE LLC: KEY EXECUTIVES
- TABLE 147. GOOGLE LLC: COMPANY SNAPSHOT
- TABLE 148. GOOGLE LLC: SERVICE SEGMENTS
- TABLE 149. GOOGLE LLC: PRODUCT PORTFOLIO
- TABLE 150. GOOGLE LLC: KEY STRATERGIES
- TABLE 151. FUJITSU: KEY EXECUTIVES
- TABLE 152. FUJITSU: COMPANY SNAPSHOT
- TABLE 153. FUJITSU: SERVICE SEGMENTS
- TABLE 154. FUJITSU: PRODUCT PORTFOLIO
- TABLE 155. FUJITSU: KEY STRATERGIES
- TABLE 156. SAP SE: KEY EXECUTIVES
- TABLE 157. SAP SE: COMPANY SNAPSHOT
- TABLE 158. SAP SE: SERVICE SEGMENTS
- TABLE 159. SAP SE: PRODUCT PORTFOLIO
- TABLE 160. SAP SE: KEY STRATERGIES
- TABLE 161. MICROSOFT CORPORATION: KEY EXECUTIVES
- TABLE 162. MICROSOFT CORPORATION: COMPANY SNAPSHOT
- TABLE 163. MICROSOFT CORPORATION: SERVICE SEGMENTS
- TABLE 164. MICROSOFT CORPORATION: PRODUCT PORTFOLIO
- TABLE 165. MICROSOFT CORPORATION: KEY STRATERGIES
- TABLE 166. COGNIZANT: KEY EXECUTIVES
- TABLE 167. COGNIZANT: COMPANY SNAPSHOT
- TABLE 168. COGNIZANT: SERVICE SEGMENTS
- TABLE 169. COGNIZANT: PRODUCT PORTFOLIO
- TABLE 170. COGNIZANT: KEY STRATERGIES
- TABLE 171. ACCENTURE: KEY EXECUTIVES
- TABLE 172. ACCENTURE: COMPANY SNAPSHOT
- TABLE 173. ACCENTURE: SERVICE SEGMENTS
- TABLE 174. ACCENTURE: PRODUCT PORTFOLIO
- TABLE 175. ACCENTURE: KEY STRATERGIES
- TABLE 176. HID GLOBAL CORPORATION.: KEY EXECUTIVES
- TABLE 177. HID GLOBAL CORPORATION.: COMPANY SNAPSHOT
- TABLE 178. HID GLOBAL CORPORATION.: SERVICE SEGMENTS
- TABLE 179. HID GLOBAL CORPORATION.: PRODUCT PORTFOLIO
- TABLE 180. HID GLOBAL CORPORATION.: KEY STRATERGIES
LIST OF FIGURES
- FIGURE 01. DIGITAL TRANSFORMATION IN BFSI MARKET, 2022-2032
- FIGURE 02. SEGMENTATION OF DIGITAL TRANSFORMATION IN BFSI MARKET,2022-2032
- FIGURE 03. TOP INVESTMENT POCKETS IN DIGITAL TRANSFORMATION IN BFSI MARKET (2023-2032)
- FIGURE 04. LOW BARGAINING POWER OF SUPPLIERS
- FIGURE 05. LOW THREAT OF NEW ENTRANTS
- FIGURE 06. LOW THREAT OF SUBSTITUTES
- FIGURE 07. LOW INTENSITY OF RIVALRY
- FIGURE 08. LOW BARGAINING POWER OF BUYERS
- FIGURE 09. GLOBAL DIGITAL TRANSFORMATION IN BFSI MARKET:DRIVERS, RESTRAINTS AND OPPORTUNITIES
- FIGURE 10. DIGITAL TRANSFORMATION IN BFSI MARKET, BY COMPONENT, 2022(%)
- FIGURE 11. COMPARATIVE SHARE ANALYSIS OF DIGITAL TRANSFORMATION IN BFSI MARKET FOR SOLUTION, BY COUNTRY 2022 AND 2032(%)
- FIGURE 12. COMPARATIVE SHARE ANALYSIS OF DIGITAL TRANSFORMATION IN BFSI MARKET FOR SERVICE, BY COUNTRY 2022 AND 2032(%)
- FIGURE 13. DIGITAL TRANSFORMATION IN BFSI MARKET, BY DEPLOYMENT MODE, 2022(%)
- FIGURE 14. COMPARATIVE SHARE ANALYSIS OF DIGITAL TRANSFORMATION IN BFSI MARKET FOR ON-PREMISE, BY COUNTRY 2022 AND 2032(%)
- FIGURE 15. COMPARATIVE SHARE ANALYSIS OF DIGITAL TRANSFORMATION IN BFSI MARKET FOR CLOUD, BY COUNTRY 2022 AND 2032(%)
- FIGURE 16. DIGITAL TRANSFORMATION IN BFSI MARKET, BY ENTERPRISE SIZE, 2022(%)
- FIGURE 17. COMPARATIVE SHARE ANALYSIS OF DIGITAL TRANSFORMATION IN BFSI MARKET FOR LARGE ENTERPRISES, BY COUNTRY 2022 AND 2032(%)
- FIGURE 18. COMPARATIVE SHARE ANALYSIS OF DIGITAL TRANSFORMATION IN BFSI MARKET FOR SMALL AND MEDIUM-SIZED ENTERPRISES, BY COUNTRY 2022 AND 2032(%)
- FIGURE 19. DIGITAL TRANSFORMATION IN BFSI MARKET, BY TECHNOLOGY, 2022(%)
- FIGURE 20. COMPARATIVE SHARE ANALYSIS OF DIGITAL TRANSFORMATION IN BFSI MARKET FOR ARTIFICIAL INTELLIGENCE, BY COUNTRY 2022 AND 2032(%)
- FIGURE 21. COMPARATIVE SHARE ANALYSIS OF DIGITAL TRANSFORMATION IN BFSI MARKET FOR CLOUD COMPUTING, BY COUNTRY 2022 AND 2032(%)
- FIGURE 22. COMPARATIVE SHARE ANALYSIS OF DIGITAL TRANSFORMATION IN BFSI MARKET FOR BLOCKCHAIN, BY COUNTRY 2022 AND 2032(%)
- FIGURE 23. COMPARATIVE SHARE ANALYSIS OF DIGITAL TRANSFORMATION IN BFSI MARKET FOR BIG DATA AND BUSINESS ANALYTICS, BY COUNTRY 2022 AND 2032(%)
- FIGURE 24. COMPARATIVE SHARE ANALYSIS OF DIGITAL TRANSFORMATION IN BFSI MARKET FOR CYBERSECURITY, BY COUNTRY 2022 AND 2032(%)
- FIGURE 25. COMPARATIVE SHARE ANALYSIS OF DIGITAL TRANSFORMATION IN BFSI MARKET FOR OTHERS, BY COUNTRY 2022 AND 2032(%)
- FIGURE 26. DIGITAL TRANSFORMATION IN BFSI MARKET, BY END USER, 2022(%)
- FIGURE 27. COMPARATIVE SHARE ANALYSIS OF DIGITAL TRANSFORMATION IN BFSI MARKET FOR BANKS, BY COUNTRY 2022 AND 2032(%)
- FIGURE 28. COMPARATIVE SHARE ANALYSIS OF DIGITAL TRANSFORMATION IN BFSI MARKET FOR INSURANCE COMPANIES, BY COUNTRY 2022 AND 2032(%)
- FIGURE 29. COMPARATIVE SHARE ANALYSIS OF DIGITAL TRANSFORMATION IN BFSI MARKET FOR OTHERS, BY COUNTRY 2022 AND 2032(%)
- FIGURE 30. DIGITAL TRANSFORMATION IN BFSI MARKET BY REGION, 2022(%)
- FIGURE 31. U.S. DIGITAL TRANSFORMATION IN BFSI MARKET, 2022-2032 ($BILLION)
- FIGURE 32. CANADA DIGITAL TRANSFORMATION IN BFSI MARKET, 2022-2032 ($BILLION)
- FIGURE 33. UK DIGITAL TRANSFORMATION IN BFSI MARKET, 2022-2032 ($BILLION)
- FIGURE 34. GERMANY DIGITAL TRANSFORMATION IN BFSI MARKET, 2022-2032 ($BILLION)
- FIGURE 35. FRANCE DIGITAL TRANSFORMATION IN BFSI MARKET, 2022-2032 ($BILLION)
- FIGURE 36. ITALY DIGITAL TRANSFORMATION IN BFSI MARKET, 2022-2032 ($BILLION)
- FIGURE 37. SPAIN DIGITAL TRANSFORMATION IN BFSI MARKET, 2022-2032 ($BILLION)
- FIGURE 38. REST OF EUROPE DIGITAL TRANSFORMATION IN BFSI MARKET, 2022-2032 ($BILLION)
- FIGURE 39. CHINA DIGITAL TRANSFORMATION IN BFSI MARKET, 2022-2032 ($BILLION)
- FIGURE 40. JAPAN DIGITAL TRANSFORMATION IN BFSI MARKET, 2022-2032 ($BILLION)
- FIGURE 41. INDIA DIGITAL TRANSFORMATION IN BFSI MARKET, 2022-2032 ($BILLION)
- FIGURE 42. AUSTRALIA DIGITAL TRANSFORMATION IN BFSI MARKET, 2022-2032 ($BILLION)
- FIGURE 43. SOUTH KOREA DIGITAL TRANSFORMATION IN BFSI MARKET, 2022-2032 ($BILLION)
- FIGURE 44. REST OF ASIA-PACIFIC DIGITAL TRANSFORMATION IN BFSI MARKET, 2022-2032 ($BILLION)
- FIGURE 45. LATIN AMERICA DIGITAL TRANSFORMATION IN BFSI MARKET, 2022-2032 ($BILLION)
- FIGURE 46. MIDDLE EAST DIGITAL TRANSFORMATION IN BFSI MARKET, 2022-2032 ($BILLION)
- FIGURE 47. AFRICA DIGITAL TRANSFORMATION IN BFSI MARKET, 2022-2032 ($BILLION)
- FIGURE 48. TOP WINNING STRATEGIES, BY YEAR (2020-2023)
- FIGURE 49. TOP WINNING STRATEGIES, BY DEVELOPMENT (2020-2023)
- FIGURE 50. TOP WINNING STRATEGIES, BY COMPANY (2020-2023)
- FIGURE 51. PRODUCT MAPPING OF TOP 10 PLAYERS
- FIGURE 52. COMPETITIVE DASHBOARD
- FIGURE 53. COMPETITIVE HEATMAP: DIGITAL TRANSFORMATION IN BFSI MARKET
- FIGURE 54. TOP PLAYER POSITIONING, 2022
- FIGURE 55. ALPHASENSE INC.: NET SALES, 2020-2022 ($MILLION)
- FIGURE 56. ALPHASENSE INC.: REVENUE SHARE BY REGION, 2022 (%)
- FIGURE 57. ALPHASENSE INC.: REVENUE SHARE BY SEGMENT, 2022 (%)
- FIGURE 58. INTERNATIONAL BUSINESS MACHINES CORPORATION: NET REVENUE, 2020-2022 ($MILLION)
- FIGURE 59. INTERNATIONAL BUSINESS MACHINES CORPORATION: RESEARCH & DEVELOPMENT EXPENDITURE, 2019-2021 ($MILLION
- FIGURE 60. INTERNATIONAL BUSINESS MACHINES CORPORATION: REVENUE SHARE BY REGION, 2022 (%)
- FIGURE 61. INTERNATIONAL BUSINESS MACHINES CORPORATION: REVENUE SHARE BY SEGMENT, 2022 (%)
- FIGURE 62. ORACLE: NET REVENUE, 2020-2022 ($MILLION)
- FIGURE 63. ORACLE: RESEARCH & DEVELOPMENT EXPENDITURE, 2020-2022 ($MILLION)
- FIGURE 64. ORACLE: REVENUE SHARE BY SEGMENT, 2022 (%)
- FIGURE 65. ORACLE: REVENUE SHARE BY REGION, 2022 (%)
- FIGURE 66. GOOGLE LLC: NET REVENUE, 2020-2022 ($MILLION)
- FIGURE 67. GOOGLE LLC: RESEARCH & DEVELOPMENT EXPENDITURE, 2020-2022 ($MILLION)
- FIGURE 68. GOOGLE LLC: REVENUE SHARE BY REGION, 2022 (%)
- FIGURE 69. GOOGLE LLC: REVENUE SHARE BY SEGMENT, 2022 (%)
- FIGURE 70. FUJITSU: NET REVENUE, 2020-2022 ($MILLION)
- FIGURE 71. FUJITSU: RESEARCH & DEVELOPMENT EXPENDITURE, 2020-2022 ($MILLION)
- FIGURE 72. FUJITSU: REVENUE SHARE BY SEGMENT, 2022 (%)
- FIGURE 73. FUJITSU: REVENUE SHARE BY REGION, 2022 (%)
- FIGURE 74. SAP SE: NET REVENUE, 2020-2022 ($MILLION)
- FIGURE 75. SAP SE: RESEARCH & DEVELOPMENT EXPENDITURE, 2020-2022 ($MILLION)
- FIGURE 76. SAP SE: REVENUE SHARE BY SEGMENT, 2022 (%)
- FIGURE 77. SAP SE: REVENUE SHARE BY REGION, 2022 (%)
- FIGURE 78. MICROSOFT CORPORATION: NET REVENUE, 2020-2022 ($MILLION)
- FIGURE 79. MICROSOFT CORPORATION: RESEARCH & DEVELOPMENT EXPENDITURE, 2020-2022 ($MILLION)
- FIGURE 80. MICROSOFT CORPORATION: REVENUE SHARE BY SEGMENT, 2022 (%)
- FIGURE 81. MICROSOFT CORPORATION: REVENUE SHARE BY REGION, 2022 (%)
- FIGURE 82. COGNIZANT: NET REVENUE, 2020-2022 ($MILLION)
- FIGURE 83. COGNIZANT: REVENUE SHARE BY REGION, 2022 (%)
- FIGURE 84. ACCENTURE: NET REVENUE, 2020-2022 ($MILLION)
- FIGURE 85. ACCENTURE: RESEARCH & DEVELOPMENT EXPENDITURE, 2020-2022 ($MILLION)
- FIGURE 86. ACCENTURE: REVENUE SHARE BY REGION, 2022 (%)
- FIGURE 87. HID GLOBAL CORPORATION: NET REVENUE, 2020-2022 ($MILLION)
- FIGURE 88. HID GLOBAL CORPORATION: REVENUE SHARE BY SEGMENT, 2022 (%)
- FIGURE 89. HID GLOBAL CORPORATION: REVENUE SHARE BY REGION, 2022 (%)
 全球数位招聘平台市场BFSI 数位转型的全球市场
 2025年教育科技数位转型全球市场报告
 数位转型市场 (~2035年):技术类型·提供区分·展开·用途·企业规模·经营模式·终端用户·各地区的产业趋势与全球预测铁路货运数位转型市场分析与预测(至 2034 年):类型、产品、服务、技术、组件、应用、流程、部署、最终用户、解决方案
 全球数位转型市场规模:依产品、技术、垂直产业、区域范围和预测全球数位转型市场研究报告-产业分析、规模、份额、成长、趋势及2025年至2033年预测
 数位转型市场依产品类型、技术、部署、业务功能和产业垂直划分-2025-2030 年全球预测
 义大利的数位转型:市场占有率分析、产业趋势和成长预测(2025-2030 年)印度软体服务出口 -市场占有率分析、行业趋势和统计、成长预测(2025-2030 年)