


 |
市场调查报告书
商品编码
1365826
订阅收费管理市场:按类型、最终用户划分:2023-2032 年全球机会分析与产业预测Subscription Billing Management Market By Type (Fixed, Variable), By End-users (Entertainment, Ecommerce, Fitness, Publishing, Others): Global Opportunity Analysis and Industry Forecast, 2023-2032 |
||||||
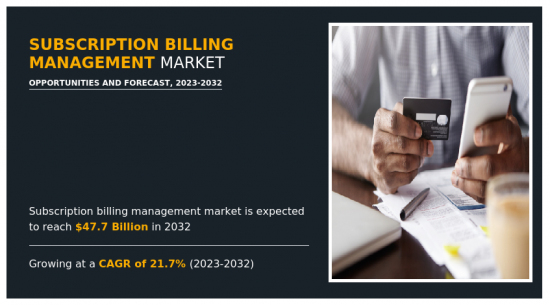
2022年订阅收费管理市场的市场规模预计为69亿美元,预计到2032年将达到477亿美元,2023年至2032年的年复合成长率为21.7%。
订阅收费管理涵盖整个生命週期,包括订阅计画设计、用户入职、价格管理、自动申请和付款处理、订阅变更处理和收益追踪。订阅收费管理和订阅管理系统的目标是帮助企业成功地将其订阅业务模式收益。儘管维持这样的商业模式可能很困难,但与传统销售相比,订阅可以提供可靠的经常性收益。企业不仅需要开发客户想要的产品,还需要与客户建立长期的关係。订阅处理不当会增加波动性并损害公司的声誉。我们的订阅收费管理平台不仅可以轻鬆处理所有必要的手续,还可以透过提供个人化产品和简单安全的付款处理来帮助您与客户建立持久的关係。Masu。
消费者不仅使用行动电话进行娱乐和电子商务,而且还花费更多时间使用行动应用程序,尤其是社交网路和简讯。使用智慧型手机的时间迅速增加将导致人们透过数位平台购买商品和服务。随着花在行动装置上的时间增加,订阅平台的使用量预计也会增加。在美国,行动媒体消费继续取代传统频道的观看和收听。为了随着时间的推移获取和留住客户,公司正在提供基于订阅的服务,订阅收费管理的需求预计将飙升。
市场开拓会受到风险和影响,包括各种技术配置的复杂性,这使得许多组织很难按时开发和推出符合消费者期望的新云端产品,但这很容易。我们的产品或技术方法失败的可能性,我们的客户不会足够快地采用我们的技术平台、应用程式或云端服务的可能性,我们的客户考虑市场上替代竞争产品的可能性,特别是产品系列策略可能无法满足不断扩大的客户期望和需求。任何这些事件都可能对订阅收费管理组织的业务营运、财务状况、收益和现金流产生重大不利影响。
疫情导致人们透过各种电子商务产品和服务提供者在线上购买商品。为了保持健康,人们越来越多地定期从药局和线上医疗产品供应商平台购买增强免疫力的药物。随着客户行为的这种转变,医疗产品和服务提供者也开始将重点转向以订阅为基础提供产品和服务。这种定期购买产品的习惯预计将为订阅收费管理系统提供者创造一些机会来自家公司服务赢得新客户。
COVID-19大流行以及限制其传播的努力正在影响订阅收费管理系统供应商及其客户、合作伙伴和供应商的业务运作方式。 COVID-19大流行促使各国政府采取预防措施来阻止和控制病毒的传播,包括旅行限制、禁止非必要活动、隔离、在家工作命令和社交距离命令。我没有选择,但要宣布它。这些预防措施导致某些产业的需求急剧下降,阻碍了疫情阶段的市场成长。由于疫情法规减少了对产品和服务的需求,业务营运和订阅收费管理需求直线下降。疫情也导致通货膨胀和生活成本上升,迫使人们只在需要时才购买自己需要的东西。除非绝对必要,否则人们会避免重复购买商品和服务。结果,人们放弃了订阅,收费管理服务提供者的业务活动直接减少。
目录
第1章简介
第2章执行摘要
第3章市场概况
- 市场定义和范围
- 主要发现
- 影响要素
- 主要投资机会
- 波特五力分析
- 市场动态
- 促进因素
- 抑制因素
- 机会
- 市场占有率分析
- 品牌占有率分析
- 贸易资料分析
- 产品消费
- 价值链分析
- 法规指引
- 关键法规分析
- 赎回场景
- 专利形势
第4章订阅收费管理市场:按类型
- 概述
- 固定式
- 多变的
第5章订阅收费管理市场:依最终用户分类
- 概述
- 娱乐
- 电子商务
- 健康
- 出版品
- 其他的
第6章订阅收费管理市场:按地区
- 概述
- 北美洲
- 美国
- 加拿大
- 墨西哥
- 欧洲
- 法国
- 德国
- 义大利
- 西班牙
- 英国
- 其他的
- 亚太地区
- 中国
- 日本
- 印度
- 韩国
- 澳洲
- 其他的
- 拉丁美洲/中东/非洲
- 巴西
- 阿拉伯聯合大公国
- 南非
- 阿根廷
- 其他的
第7章竞争形势
- 介绍
- 关键成功策略
- 10家主要企业产品图谱
- 竞争仪表板
- 竞争热图
- 2022年主要企业定位
第8章公司简介
- Zuora Inc.
- Salesforce, Inc.
- SAP SE
- Oracle Corporation
- ZOHO Corporation.
- Chargebee Inc.
- Chargify LLC.
- Recurly Inc.
- 2Checkout
- Apttus Corporation
According to a new report published by Allied Market Research, titled, "Subscription Billing Management Market," The subscription billing management market was valued at $6.9 billion in 2022, and is estimated to reach $47.7 billion by 2032, growing at a CAGR of 21.7% from 2023 to 2032.
The subscription billing management covers entire lifecycle, including subscription plan design, subscriber onboarding, price management, automated invoicing & payment processing, handling subscription modifications, and revenue tracking. The goal of subscription billing management, as well as a subscription management system, is to assist businesses in successfully monetizing their subscription business models. Although these business models might be challenging to maintain, subscriptions can provide dependable and recurring revenue as compared to traditional sales. In addition to developing products that customers want, businesses also need to establish long-lasting relationships with them. Poorly handled subscriptions can cause increased volatility and damage to the reputation of the company. A subscription billing management platform not only makes it easier to handle all necessary procedures, but it also helps to build enduring relationships with customers by providing personalized products and easy & secure payment processing.
Consumers are spending increasing amounts of time using mobile applications, notably for social networking and texting, in addition to utilizing their cellphones for entertainment and e-commerce. This surging amount of time spent on smartphones can make people purchase goods and services through digital platforms. As the amount of time spent on mobile devices is increasing, the usage of subscription platform is also expected to rise. In the U.S., mobile media consumption is continuing to replace traditional channels' viewership and listenership. To gain and preserve customers for a longer period of time, the companies are providing services based on subscriptions, which is expected to surge the demand for subscription billing management.
The market is susceptible to risks and their effects, such as the difficulty to develop and launch new cloud products across numerous organizations on schedule and in line with consumer expectations due to complexity in various technical settings. The possibility of the product and technology approach failing; customers may not adopt technology platforms, applications, or cloud services quickly enough; they may think about alternative competing products in the market; or the strategy may not match customers' expectations and needs, particularly in the context of extending the product portfolio into new markets. Any one of these events could have a severe negative effect on the business operations, money situation, revenue, and cash flow of the subscription billing management organization.
The pandemic has led to people buying products online through various e-commerce goods and service providers. To stay healthy, people started to buy medicines that boost immunity from pharmacy shops and online healthcare product supplier platforms on a regular basis. With this change in customer behavior, healthcare goods and services providers have also started to shift their focus to providing goods and services on a subscription basis, which necessitated them acquiring an efficient subscription billing management system provider. This habit of buying products on a regular basis is expected to create several opportunities for subscription billing management system providers to acquire new clients for their services.
The COVID-19 pandemic and efforts to control its spread have affected how subscription billing management system providers and their customers, partners, and suppliers are operating their businesses. The COVID-19 pandemic forced governments to issue preventative measures to contain or control the spread of the virus, such as travel restrictions, prohibitions of non-essential activities, quarantines, work-from-home directives, and social distancing orders. These preventative measures resulted in a sharp decrease in demand in certain industries and thus hampered the market growth in the initial stage of the pandemic. Business operations and their demand for subscription-based billing management drastically decreased with the decrease in demand for goods and services due to pandemic restrictions. The pandemic also caused a rise in inflation and the cost of living, which resulted in people buying only the necessary stuff at the time required. People avoided buying products and services repeatedly unless it was very necessary. This impacted people abandoning subscriptions, which directly reduced the business activities of subscription billing management service providers.
The key players profiled in this report include: Zuora Inc., Salesforce, Inc., SAP SE, Oracle Corporation, ZOHO Corporation., Chargebee Inc., Chargify LLC., Recurly Inc., 2Checkout, and Apttus Corporation. The market players are continuously striving to achieve a dominant position in this competitive market using strategies such as collaborations and acquisitions.
Key Benefits For Stakeholders
- This report provides a quantitative analysis of the market segments, current trends, estimations, and dynamics of the subscription billing management market analysis from 2022 to 2032 to identify the prevailing subscription billing management market opportunities.
- The market research is offered along with information related to key drivers, restraints, and opportunities.
- Porter's five forces analysis highlights the potency of buyers and suppliers to enable stakeholders make profit-oriented business decisions and strengthen their supplier-buyer network.
- In-depth analysis of the subscription billing management market segmentation assists to determine the prevailing market opportunities.
- Major countries in each region are mapped according to their revenue contribution to the global market.
- Market player positioning facilitates benchmarking and provides a clear understanding of the present position of the market players.
- The report includes the analysis of the regional as well as global subscription billing management market trends, key players, market segments, application areas, and market growth strategies.
Additional benefits you will get with this purchase are:
- Quarterly Update and* (only available with a corporate license, on listed price)
- 5 additional Company Profile of client Choice pre- or Post-purchase, as a free update.
- Free Upcoming Version on the Purchase of Five and Enterprise User License.
- 16 analyst hours of support* (post-purchase, if you find additional data requirements upon review of the report, you may receive support amounting to 16 analyst hours to solve questions, and post-sale queries)
- 15% Free Customization* (in case the scope or segment of the report does not match your requirements, 20% is equivalent to 3 working days of free work, applicable once)
- Free data Pack on the Five and Enterprise User License. (Excel version of the report)
- Free Updated report if the report is 6-12 months old or older.
- 24-hour priority response*
- Free Industry updates and white papers.
Possible Customization with this report (with additional cost and timeline talk to the sales executive to know more)
- Consumer Buying Behavior Analysis
- Product Benchmarking / Product specification and applications
- Upcoming/New Entrant by Regions
- Consumer Preference and Product Specifications
- Go To Market Strategy
- Market share analysis of players by products/segments
- New Product Development/ Product Matrix of Key Players
- Regulatory Guidelines
- Additional company profiles with specific to client's interest
- Additional country or region analysis- market size and forecast
- Criss-cross segment analysis- market size and forecast
- Expanded list for Company Profiles
- Historic market data
- Import Export Analysis/Data
- Key player details (including location, contact details, supplier/vendor network etc. in excel format)
- Market share analysis of players at global/region/country level
- SWOT Analysis
Key Market Segments
By Type
- Fixed
- Variable
By End-users
- Others
- Entertainment
- Ecommerce
- Fitness
- Publishing
By Region
- North America
- U.S.
- Canada
- Mexico
- Europe
- France
- Germany
- Italy
- Spain
- UK
- Rest of Europe
- Asia-Pacific
- China
- Japan
- India
- South Korea
- Australia
- Rest of Asia-Pacific
- LAMEA
- Brazil
- UAE
- South Africa
- Argentina
- Rest of LAMEA
Key Market Players:
- Zuora Inc.
- Salesforce, Inc.
- SAP SE
- Oracle Corporation
- ZOHO Corporation.
- Chargebee Inc.
- Chargify LLC.
- Recurly Inc.
- 2Checkout
- Apttus Corporation
TABLE OF CONTENTS
CHAPTER 1: INTRODUCTION
- 1.1. Report description
- 1.2. Key market segments
- 1.3. Key benefits to the stakeholders
- 1.4. Research Methodology
- 1.4.1. Primary research
- 1.4.2. Secondary research
- 1.4.3. Analyst tools and models
CHAPTER 2: EXECUTIVE SUMMARY
- 2.1. CXO Perspective
CHAPTER 3: MARKET OVERVIEW
- 3.1. Market definition and scope
- 3.2. Key findings
- 3.2.1. Top impacting factors
- 3.2.2. Top investment pockets
- 3.3. Porter's five forces analysis
- 3.4. Market dynamics
- 3.4.1. Drivers
- 3.4.2. Restraints
- 3.4.3. Opportunities
- 3.5. Market Share Analysis
- 3.6. Brand Share Analysis
- 3.7. Trade Data Analysis
- 3.8. Product Consumption
- 3.9. Value Chain Analysis
- 3.10. Regulatory Guidelines
- 3.11. Key Regulation Analysis
- 3.12. Reimbursement Scenario
- 3.13. Patent Landscape
CHAPTER 4: SUBSCRIPTION BILLING MANAGEMENT MARKET, BY TYPE
- 4.1. Overview
- 4.1.1. Market size and forecast
- 4.2. Fixed
- 4.2.1. Key market trends, growth factors and opportunities
- 4.2.2. Market size and forecast, by region
- 4.2.3. Market share analysis by country
- 4.3. Variable
- 4.3.1. Key market trends, growth factors and opportunities
- 4.3.2. Market size and forecast, by region
- 4.3.3. Market share analysis by country
CHAPTER 5: SUBSCRIPTION BILLING MANAGEMENT MARKET, BY END-USERS
- 5.1. Overview
- 5.1.1. Market size and forecast
- 5.2. Entertainment
- 5.2.1. Key market trends, growth factors and opportunities
- 5.2.2. Market size and forecast, by region
- 5.2.3. Market share analysis by country
- 5.3. Ecommerce
- 5.3.1. Key market trends, growth factors and opportunities
- 5.3.2. Market size and forecast, by region
- 5.3.3. Market share analysis by country
- 5.4. Fitness
- 5.4.1. Key market trends, growth factors and opportunities
- 5.4.2. Market size and forecast, by region
- 5.4.3. Market share analysis by country
- 5.5. Publishing
- 5.5.1. Key market trends, growth factors and opportunities
- 5.5.2. Market size and forecast, by region
- 5.5.3. Market share analysis by country
- 5.6. Others
- 5.6.1. Key market trends, growth factors and opportunities
- 5.6.2. Market size and forecast, by region
- 5.6.3. Market share analysis by country
CHAPTER 6: SUBSCRIPTION BILLING MANAGEMENT MARKET, BY REGION
- 6.1. Overview
- 6.1.1. Market size and forecast By Region
- 6.2. North America
- 6.2.1. Key market trends, growth factors and opportunities
- 6.2.2. Market size and forecast, by Type
- 6.2.3. Market size and forecast, by End-users
- 6.2.4. Market size and forecast, by country
- 6.2.4.1. U.S.
- 6.2.4.1.1. Market size and forecast, by Type
- 6.2.4.1.2. Market size and forecast, by End-users
- 6.2.4.2. Canada
- 6.2.4.2.1. Market size and forecast, by Type
- 6.2.4.2.2. Market size and forecast, by End-users
- 6.2.4.3. Mexico
- 6.2.4.3.1. Market size and forecast, by Type
- 6.2.4.3.2. Market size and forecast, by End-users
- 6.3. Europe
- 6.3.1. Key market trends, growth factors and opportunities
- 6.3.2. Market size and forecast, by Type
- 6.3.3. Market size and forecast, by End-users
- 6.3.4. Market size and forecast, by country
- 6.3.4.1. France
- 6.3.4.1.1. Market size and forecast, by Type
- 6.3.4.1.2. Market size and forecast, by End-users
- 6.3.4.2. Germany
- 6.3.4.2.1. Market size and forecast, by Type
- 6.3.4.2.2. Market size and forecast, by End-users
- 6.3.4.3. Italy
- 6.3.4.3.1. Market size and forecast, by Type
- 6.3.4.3.2. Market size and forecast, by End-users
- 6.3.4.4. Spain
- 6.3.4.4.1. Market size and forecast, by Type
- 6.3.4.4.2. Market size and forecast, by End-users
- 6.3.4.5. UK
- 6.3.4.5.1. Market size and forecast, by Type
- 6.3.4.5.2. Market size and forecast, by End-users
- 6.3.4.6. Rest of Europe
- 6.3.4.6.1. Market size and forecast, by Type
- 6.3.4.6.2. Market size and forecast, by End-users
- 6.4. Asia-Pacific
- 6.4.1. Key market trends, growth factors and opportunities
- 6.4.2. Market size and forecast, by Type
- 6.4.3. Market size and forecast, by End-users
- 6.4.4. Market size and forecast, by country
- 6.4.4.1. China
- 6.4.4.1.1. Market size and forecast, by Type
- 6.4.4.1.2. Market size and forecast, by End-users
- 6.4.4.2. Japan
- 6.4.4.2.1. Market size and forecast, by Type
- 6.4.4.2.2. Market size and forecast, by End-users
- 6.4.4.3. India
- 6.4.4.3.1. Market size and forecast, by Type
- 6.4.4.3.2. Market size and forecast, by End-users
- 6.4.4.4. South Korea
- 6.4.4.4.1. Market size and forecast, by Type
- 6.4.4.4.2. Market size and forecast, by End-users
- 6.4.4.5. Australia
- 6.4.4.5.1. Market size and forecast, by Type
- 6.4.4.5.2. Market size and forecast, by End-users
- 6.4.4.6. Rest of Asia-Pacific
- 6.4.4.6.1. Market size and forecast, by Type
- 6.4.4.6.2. Market size and forecast, by End-users
- 6.5. LAMEA
- 6.5.1. Key market trends, growth factors and opportunities
- 6.5.2. Market size and forecast, by Type
- 6.5.3. Market size and forecast, by End-users
- 6.5.4. Market size and forecast, by country
- 6.5.4.1. Brazil
- 6.5.4.1.1. Market size and forecast, by Type
- 6.5.4.1.2. Market size and forecast, by End-users
- 6.5.4.2. UAE
- 6.5.4.2.1. Market size and forecast, by Type
- 6.5.4.2.2. Market size and forecast, by End-users
- 6.5.4.3. South Africa
- 6.5.4.3.1. Market size and forecast, by Type
- 6.5.4.3.2. Market size and forecast, by End-users
- 6.5.4.4. Argentina
- 6.5.4.4.1. Market size and forecast, by Type
- 6.5.4.4.2. Market size and forecast, by End-users
- 6.5.4.5. Rest of LAMEA
- 6.5.4.5.1. Market size and forecast, by Type
- 6.5.4.5.2. Market size and forecast, by End-users
CHAPTER 7: COMPETITIVE LANDSCAPE
- 7.1. Introduction
- 7.2. Top winning strategies
- 7.3. Product Mapping of Top 10 Player
- 7.4. Competitive Dashboard
- 7.5. Competitive Heatmap
- 7.6. Top player positioning, 2022
CHAPTER 8: COMPANY PROFILES
- 8.1. Zuora Inc.
- 8.1.1. Company overview
- 8.1.2. Key Executives
- 8.1.3. Company snapshot
- 8.2. Salesforce, Inc.
- 8.2.1. Company overview
- 8.2.2. Key Executives
- 8.2.3. Company snapshot
- 8.3. SAP SE
- 8.3.1. Company overview
- 8.3.2. Key Executives
- 8.3.3. Company snapshot
- 8.4. Oracle Corporation
- 8.4.1. Company overview
- 8.4.2. Key Executives
- 8.4.3. Company snapshot
- 8.5. ZOHO Corporation.
- 8.5.1. Company overview
- 8.5.2. Key Executives
- 8.5.3. Company snapshot
- 8.6. Chargebee Inc.
- 8.6.1. Company overview
- 8.6.2. Key Executives
- 8.6.3. Company snapshot
- 8.7. Chargify LLC.
- 8.7.1. Company overview
- 8.7.2. Key Executives
- 8.7.3. Company snapshot
- 8.8. Recurly Inc.
- 8.8.1. Company overview
- 8.8.2. Key Executives
- 8.8.3. Company snapshot
- 8.9. 2Checkout
- 8.9.1. Company overview
- 8.9.2. Key Executives
- 8.9.3. Company snapshot
- 8.10. Apttus Corporation
- 8.10.1. Company overview
- 8.10.2. Key Executives
- 8.10.3. Company snapshot
LIST OF TABLES
- TABLE 01. GLOBAL SUBSCRIPTION BILLING MANAGEMENT MARKET, BY TYPE, 2022-2032 ($MILLION)
- TABLE 02. SUBSCRIPTION BILLING MANAGEMENT MARKET FOR FIXED, BY REGION, 2022-2032 ($MILLION)
- TABLE 03. SUBSCRIPTION BILLING MANAGEMENT MARKET FOR VARIABLE, BY REGION, 2022-2032 ($MILLION)
- TABLE 04. GLOBAL SUBSCRIPTION BILLING MANAGEMENT MARKET, BY END-USERS, 2022-2032 ($MILLION)
- TABLE 05. SUBSCRIPTION BILLING MANAGEMENT MARKET FOR ENTERTAINMENT, BY REGION, 2022-2032 ($MILLION)
- TABLE 06. SUBSCRIPTION BILLING MANAGEMENT MARKET FOR ECOMMERCE, BY REGION, 2022-2032 ($MILLION)
- TABLE 07. SUBSCRIPTION BILLING MANAGEMENT MARKET FOR FITNESS, BY REGION, 2022-2032 ($MILLION)
- TABLE 08. SUBSCRIPTION BILLING MANAGEMENT MARKET FOR PUBLISHING, BY REGION, 2022-2032 ($MILLION)
- TABLE 09. SUBSCRIPTION BILLING MANAGEMENT MARKET FOR OTHERS, BY REGION, 2022-2032 ($MILLION)
- TABLE 10. SUBSCRIPTION BILLING MANAGEMENT MARKET, BY REGION, 2022-2032 ($MILLION)
- TABLE 11. NORTH AMERICA SUBSCRIPTION BILLING MANAGEMENT MARKET, BY TYPE, 2022-2032 ($MILLION)
- TABLE 12. NORTH AMERICA SUBSCRIPTION BILLING MANAGEMENT MARKET, BY END-USERS, 2022-2032 ($MILLION)
- TABLE 13. NORTH AMERICA SUBSCRIPTION BILLING MANAGEMENT MARKET, BY COUNTRY, 2022-2032 ($MILLION)
- TABLE 14. U.S. SUBSCRIPTION BILLING MANAGEMENT MARKET, BY TYPE, 2022-2032 ($MILLION)
- TABLE 15. U.S. SUBSCRIPTION BILLING MANAGEMENT MARKET, BY END-USERS, 2022-2032 ($MILLION)
- TABLE 16. CANADA SUBSCRIPTION BILLING MANAGEMENT MARKET, BY TYPE, 2022-2032 ($MILLION)
- TABLE 17. CANADA SUBSCRIPTION BILLING MANAGEMENT MARKET, BY END-USERS, 2022-2032 ($MILLION)
- TABLE 18. MEXICO SUBSCRIPTION BILLING MANAGEMENT MARKET, BY TYPE, 2022-2032 ($MILLION)
- TABLE 19. MEXICO SUBSCRIPTION BILLING MANAGEMENT MARKET, BY END-USERS, 2022-2032 ($MILLION)
- TABLE 20. EUROPE SUBSCRIPTION BILLING MANAGEMENT MARKET, BY TYPE, 2022-2032 ($MILLION)
- TABLE 21. EUROPE SUBSCRIPTION BILLING MANAGEMENT MARKET, BY END-USERS, 2022-2032 ($MILLION)
- TABLE 22. EUROPE SUBSCRIPTION BILLING MANAGEMENT MARKET, BY COUNTRY, 2022-2032 ($MILLION)
- TABLE 23. FRANCE SUBSCRIPTION BILLING MANAGEMENT MARKET, BY TYPE, 2022-2032 ($MILLION)
- TABLE 24. FRANCE SUBSCRIPTION BILLING MANAGEMENT MARKET, BY END-USERS, 2022-2032 ($MILLION)
- TABLE 25. GERMANY SUBSCRIPTION BILLING MANAGEMENT MARKET, BY TYPE, 2022-2032 ($MILLION)
- TABLE 26. GERMANY SUBSCRIPTION BILLING MANAGEMENT MARKET, BY END-USERS, 2022-2032 ($MILLION)
- TABLE 27. ITALY SUBSCRIPTION BILLING MANAGEMENT MARKET, BY TYPE, 2022-2032 ($MILLION)
- TABLE 28. ITALY SUBSCRIPTION BILLING MANAGEMENT MARKET, BY END-USERS, 2022-2032 ($MILLION)
- TABLE 29. SPAIN SUBSCRIPTION BILLING MANAGEMENT MARKET, BY TYPE, 2022-2032 ($MILLION)
- TABLE 30. SPAIN SUBSCRIPTION BILLING MANAGEMENT MARKET, BY END-USERS, 2022-2032 ($MILLION)
- TABLE 31. UK SUBSCRIPTION BILLING MANAGEMENT MARKET, BY TYPE, 2022-2032 ($MILLION)
- TABLE 32. UK SUBSCRIPTION BILLING MANAGEMENT MARKET, BY END-USERS, 2022-2032 ($MILLION)
- TABLE 33. REST OF EUROPE SUBSCRIPTION BILLING MANAGEMENT MARKET, BY TYPE, 2022-2032 ($MILLION)
- TABLE 34. REST OF EUROPE SUBSCRIPTION BILLING MANAGEMENT MARKET, BY END-USERS, 2022-2032 ($MILLION)
- TABLE 35. ASIA-PACIFIC SUBSCRIPTION BILLING MANAGEMENT MARKET, BY TYPE, 2022-2032 ($MILLION)
- TABLE 36. ASIA-PACIFIC SUBSCRIPTION BILLING MANAGEMENT MARKET, BY END-USERS, 2022-2032 ($MILLION)
- TABLE 37. ASIA-PACIFIC SUBSCRIPTION BILLING MANAGEMENT MARKET, BY COUNTRY, 2022-2032 ($MILLION)
- TABLE 38. CHINA SUBSCRIPTION BILLING MANAGEMENT MARKET, BY TYPE, 2022-2032 ($MILLION)
- TABLE 39. CHINA SUBSCRIPTION BILLING MANAGEMENT MARKET, BY END-USERS, 2022-2032 ($MILLION)
- TABLE 40. JAPAN SUBSCRIPTION BILLING MANAGEMENT MARKET, BY TYPE, 2022-2032 ($MILLION)
- TABLE 41. JAPAN SUBSCRIPTION BILLING MANAGEMENT MARKET, BY END-USERS, 2022-2032 ($MILLION)
- TABLE 42. INDIA SUBSCRIPTION BILLING MANAGEMENT MARKET, BY TYPE, 2022-2032 ($MILLION)
- TABLE 43. INDIA SUBSCRIPTION BILLING MANAGEMENT MARKET, BY END-USERS, 2022-2032 ($MILLION)
- TABLE 44. SOUTH KOREA SUBSCRIPTION BILLING MANAGEMENT MARKET, BY TYPE, 2022-2032 ($MILLION)
- TABLE 45. SOUTH KOREA SUBSCRIPTION BILLING MANAGEMENT MARKET, BY END-USERS, 2022-2032 ($MILLION)
- TABLE 46. AUSTRALIA SUBSCRIPTION BILLING MANAGEMENT MARKET, BY TYPE, 2022-2032 ($MILLION)
- TABLE 47. AUSTRALIA SUBSCRIPTION BILLING MANAGEMENT MARKET, BY END-USERS, 2022-2032 ($MILLION)
- TABLE 48. REST OF ASIA-PACIFIC SUBSCRIPTION BILLING MANAGEMENT MARKET, BY TYPE, 2022-2032 ($MILLION)
- TABLE 49. REST OF ASIA-PACIFIC SUBSCRIPTION BILLING MANAGEMENT MARKET, BY END-USERS, 2022-2032 ($MILLION)
- TABLE 50. LAMEA SUBSCRIPTION BILLING MANAGEMENT MARKET, BY TYPE, 2022-2032 ($MILLION)
- TABLE 51. LAMEA SUBSCRIPTION BILLING MANAGEMENT MARKET, BY END-USERS, 2022-2032 ($MILLION)
- TABLE 52. LAMEA SUBSCRIPTION BILLING MANAGEMENT MARKET, BY COUNTRY, 2022-2032 ($MILLION)
- TABLE 53. BRAZIL SUBSCRIPTION BILLING MANAGEMENT MARKET, BY TYPE, 2022-2032 ($MILLION)
- TABLE 54. BRAZIL SUBSCRIPTION BILLING MANAGEMENT MARKET, BY END-USERS, 2022-2032 ($MILLION)
- TABLE 55. UAE SUBSCRIPTION BILLING MANAGEMENT MARKET, BY TYPE, 2022-2032 ($MILLION)
- TABLE 56. UAE SUBSCRIPTION BILLING MANAGEMENT MARKET, BY END-USERS, 2022-2032 ($MILLION)
- TABLE 57. SOUTH AFRICA SUBSCRIPTION BILLING MANAGEMENT MARKET, BY TYPE, 2022-2032 ($MILLION)
- TABLE 58. SOUTH AFRICA SUBSCRIPTION BILLING MANAGEMENT MARKET, BY END-USERS, 2022-2032 ($MILLION)
- TABLE 59. ARGENTINA SUBSCRIPTION BILLING MANAGEMENT MARKET, BY TYPE, 2022-2032 ($MILLION)
- TABLE 60. ARGENTINA SUBSCRIPTION BILLING MANAGEMENT MARKET, BY END-USERS, 2022-2032 ($MILLION)
- TABLE 61. REST OF LAMEA SUBSCRIPTION BILLING MANAGEMENT MARKET, BY TYPE, 2022-2032 ($MILLION)
- TABLE 62. REST OF LAMEA SUBSCRIPTION BILLING MANAGEMENT MARKET, BY END-USERS, 2022-2032 ($MILLION)
- TABLE 63. ZUORA INC.: KEY EXECUTIVES
- TABLE 64. ZUORA INC.: COMPANY SNAPSHOT
- TABLE 65. SALESFORCE, INC.: KEY EXECUTIVES
- TABLE 66. SALESFORCE, INC.: COMPANY SNAPSHOT
- TABLE 67. SAP SE: KEY EXECUTIVES
- TABLE 68. SAP SE: COMPANY SNAPSHOT
- TABLE 69. ORACLE CORPORATION: KEY EXECUTIVES
- TABLE 70. ORACLE CORPORATION: COMPANY SNAPSHOT
- TABLE 71. ZOHO CORPORATION.: KEY EXECUTIVES
- TABLE 72. ZOHO CORPORATION.: COMPANY SNAPSHOT
- TABLE 73. CHARGEBEE INC.: KEY EXECUTIVES
- TABLE 74. CHARGEBEE INC.: COMPANY SNAPSHOT
- TABLE 75. CHARGIFY LLC.: KEY EXECUTIVES
- TABLE 76. CHARGIFY LLC.: COMPANY SNAPSHOT
- TABLE 77. RECURLY INC.: KEY EXECUTIVES
- TABLE 78. RECURLY INC.: COMPANY SNAPSHOT
- TABLE 79. 2CHECKOUT: KEY EXECUTIVES
- TABLE 80. 2CHECKOUT: COMPANY SNAPSHOT
- TABLE 81. APTTUS CORPORATION: KEY EXECUTIVES
- TABLE 82. APTTUS CORPORATION: COMPANY SNAPSHOT
LIST OF FIGURES
- FIGURE 01. SUBSCRIPTION BILLING MANAGEMENT MARKET, 2022-2032
- FIGURE 02. SEGMENTATION OF SUBSCRIPTION BILLING MANAGEMENT MARKET,2022-2032
- FIGURE 03. TOP INVESTMENT POCKETS IN SUBSCRIPTION BILLING MANAGEMENT MARKET (2023-2032)
- FIGURE 04. BARGAINING POWER OF SUPPLIERS
- FIGURE 05. BARGAINING POWER OF BUYERS
- FIGURE 06. THREAT OF SUBSTITUTION
- FIGURE 07. THREAT OF SUBSTITUTION
- FIGURE 08. COMPETITIVE RIVALRY
- FIGURE 09. GLOBAL SUBSCRIPTION BILLING MANAGEMENT MARKET:DRIVERS, RESTRAINTS AND OPPORTUNITIES
- FIGURE 10. REGULATORY GUIDELINES: SUBSCRIPTION BILLING MANAGEMENT MARKET
- FIGURE 11. IMPACT OF KEY REGULATION: SUBSCRIPTION BILLING MANAGEMENT MARKET
- FIGURE 12. PATENT ANALYSIS BY COMPANY
- FIGURE 13. PATENT ANALYSIS BY COUNTRY
- FIGURE 14. SUBSCRIPTION BILLING MANAGEMENT MARKET, BY TYPE, 2022 AND 2032(%)
- FIGURE 15. COMPARATIVE SHARE ANALYSIS OF SUBSCRIPTION BILLING MANAGEMENT MARKET FOR FIXED, BY COUNTRY 2022 AND 2032(%)
- FIGURE 16. COMPARATIVE SHARE ANALYSIS OF SUBSCRIPTION BILLING MANAGEMENT MARKET FOR VARIABLE, BY COUNTRY 2022 AND 2032(%)
- FIGURE 17. SUBSCRIPTION BILLING MANAGEMENT MARKET, BY END-USERS, 2022 AND 2032(%)
- FIGURE 18. COMPARATIVE SHARE ANALYSIS OF SUBSCRIPTION BILLING MANAGEMENT MARKET FOR ENTERTAINMENT, BY COUNTRY 2022 AND 2032(%)
- FIGURE 19. COMPARATIVE SHARE ANALYSIS OF SUBSCRIPTION BILLING MANAGEMENT MARKET FOR ECOMMERCE, BY COUNTRY 2022 AND 2032(%)
- FIGURE 20. COMPARATIVE SHARE ANALYSIS OF SUBSCRIPTION BILLING MANAGEMENT MARKET FOR FITNESS, BY COUNTRY 2022 AND 2032(%)
- FIGURE 21. COMPARATIVE SHARE ANALYSIS OF SUBSCRIPTION BILLING MANAGEMENT MARKET FOR PUBLISHING, BY COUNTRY 2022 AND 2032(%)
- FIGURE 22. COMPARATIVE SHARE ANALYSIS OF SUBSCRIPTION BILLING MANAGEMENT MARKET FOR OTHERS, BY COUNTRY 2022 AND 2032(%)
- FIGURE 23. SUBSCRIPTION BILLING MANAGEMENT MARKET BY REGION, 2022 AND 2032(%)
- FIGURE 24. U.S. SUBSCRIPTION BILLING MANAGEMENT MARKET, 2022-2032 ($MILLION)
- FIGURE 25. CANADA SUBSCRIPTION BILLING MANAGEMENT MARKET, 2022-2032 ($MILLION)
- FIGURE 26. MEXICO SUBSCRIPTION BILLING MANAGEMENT MARKET, 2022-2032 ($MILLION)
- FIGURE 27. FRANCE SUBSCRIPTION BILLING MANAGEMENT MARKET, 2022-2032 ($MILLION)
- FIGURE 28. GERMANY SUBSCRIPTION BILLING MANAGEMENT MARKET, 2022-2032 ($MILLION)
- FIGURE 29. ITALY SUBSCRIPTION BILLING MANAGEMENT MARKET, 2022-2032 ($MILLION)
- FIGURE 30. SPAIN SUBSCRIPTION BILLING MANAGEMENT MARKET, 2022-2032 ($MILLION)
- FIGURE 31. UK SUBSCRIPTION BILLING MANAGEMENT MARKET, 2022-2032 ($MILLION)
- FIGURE 32. REST OF EUROPE SUBSCRIPTION BILLING MANAGEMENT MARKET, 2022-2032 ($MILLION)
- FIGURE 33. CHINA SUBSCRIPTION BILLING MANAGEMENT MARKET, 2022-2032 ($MILLION)
- FIGURE 34. JAPAN SUBSCRIPTION BILLING MANAGEMENT MARKET, 2022-2032 ($MILLION)
- FIGURE 35. INDIA SUBSCRIPTION BILLING MANAGEMENT MARKET, 2022-2032 ($MILLION)
- FIGURE 36. SOUTH KOREA SUBSCRIPTION BILLING MANAGEMENT MARKET, 2022-2032 ($MILLION)
- FIGURE 37. AUSTRALIA SUBSCRIPTION BILLING MANAGEMENT MARKET, 2022-2032 ($MILLION)
- FIGURE 38. REST OF ASIA-PACIFIC SUBSCRIPTION BILLING MANAGEMENT MARKET, 2022-2032 ($MILLION)
- FIGURE 39. BRAZIL SUBSCRIPTION BILLING MANAGEMENT MARKET, 2022-2032 ($MILLION)
- FIGURE 40. UAE SUBSCRIPTION BILLING MANAGEMENT MARKET, 2022-2032 ($MILLION)
- FIGURE 41. SOUTH AFRICA SUBSCRIPTION BILLING MANAGEMENT MARKET, 2022-2032 ($MILLION)
- FIGURE 42. ARGENTINA SUBSCRIPTION BILLING MANAGEMENT MARKET, 2022-2032 ($MILLION)
- FIGURE 43. REST OF LAMEA SUBSCRIPTION BILLING MANAGEMENT MARKET, 2022-2032 ($MILLION)
- FIGURE 44. TOP WINNING STRATEGIES, BY YEAR
- FIGURE 45. TOP WINNING STRATEGIES, BY DEVELOPMENT
- FIGURE 46. TOP WINNING STRATEGIES, BY COMPANY
- FIGURE 47. PRODUCT MAPPING OF TOP 10 PLAYERS
- FIGURE 48. COMPETITIVE DASHBOARD
- FIGURE 49. COMPETITIVE HEATMAP: SUBSCRIPTION BILLING MANAGEMENT MARKET
- FIGURE 50. TOP PLAYER POSITIONING, 2022
 全球订阅计费管理市场研究报告-产业分析、规模、份额、成长、趋势与预测 2025 年至 2033 年
 2025年订阅收费管理全球市场报告2025年订阅收费软体全球市场报告2025 年订阅与计费管理全球市场报告
 市场占有率和预测:2023年至2028年全球订阅和 SaaS 计费管理(SSBM)应用(2 份报告合集)
 拉丁美洲订阅和收费管理 -市场占有率分析、行业趋势和统计、成长预测(2025-2030)订阅计费管理:市场占有率分析、产业趋势与统计、成长预测(2025-2030 年)
 订阅/定期收费管理市场:按产品、支付模式、产业、部署 - 2025-2030 年全球预测
 订阅申请管理市场市场规模、份额、趋势分析报告:按软体、按服务、按部署、按公司规模、按最终用途、按地区、按细分市场、预测,2025-2030 年