


 |
市场调查报告书
商品编码
1414949
硬质塑胶包装市场:依材料、製造流程、最终用户产业:2023-2032 年全球机会分析与产业预测Rigid Plastic Packaging Market By Material (Polyethylene terephthalate, Polypropylene, High density polypropylene, Others), By Production Process, By End-user Industry : Global Opportunity Analysis and Industry Forecast, 2023-2032 |
||||||
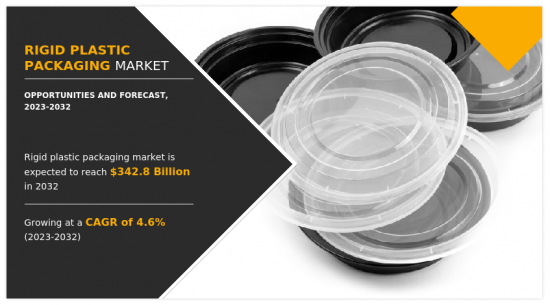
2022年硬质塑胶包装市场规模预估为2,186亿美元,预估2032年将达3,428亿美元,2023年至2032年复合年增长率为4.6%。
消费品是一个高度分散的行业,产品差异化和包装发挥关键作用。全球消费品消费的增加将推动硬质塑胶包装需求的成长。全球包装回收率的提高也推动了市场的成长。此外,硬质塑胶因其成本效益高而被广泛用于包装。然而,硬质塑胶包装市场的主要抑制因素与塑胶使用量的增加有关。塑胶对环境和人类有多种有害影响。已经实施了多项法规来限制塑胶的过度使用,预计这将对市场成长产生负面影响。相反,电子商务销售的成长预计将为全球市场扩张提供有利的成长机会。
由于软包装具有轻量化设计、降低运输成本和环保等优点,软包装趋势对硬质塑胶包装提出了挑战。软包装对各种形状和尺寸的适应性,以及保鲜方面的创新,是提高其偏好的驱动力。这项变化反映了市场对环保和多功能包装解决方案不断增长的需求,从而对硬质塑胶造成了激烈的竞争。随着公司优先考虑适应性、成本效率和永续性,越来越青睐软包装,硬质塑胶产业面临着调整其策略以在不断发展的包装形势保持竞争力的压力。这些因素都限制了硬质塑胶包装市场的成长。
全球硬质塑胶包装市场按材料、生产工艺、最终用户产业和地区细分。依材料,市场分为聚对苯二甲酸Terephthalate(PET)、聚丙烯(PP)、高密度聚苯乙烯(HDPE)等。
鼓励永续实践为硬质塑胶包装应用提供了机会。可回收和生物分解性塑胶的进步将透过解决环境问题来推动该领域的发展。随着新材料的开发和旧材料的改进,使其更易于回收和堆肥,环保包装解决方案可以满足消费者的需求。此外,透过教育客户正确的处置方法和回收硬质塑胶包装的好处,可以鼓励采用更永续的方法。这使该行业有机会满足客户对环保包装的偏好,同时保留硬质塑胶包装的实际优势并跟上日益增长的环保意识。
目录
第一章简介
第 2 章执行摘要
第三章市场概况
- 市场定义和范围
- 主要发现
- 影响因素
- 主要投资机会
- 波特五力分析
- 市场动态
- 促进因素
- 全球消费品消费增加
- 提高包装回收率
- 硬质塑胶成本更低
- 抑制因素
- 转向软包装
- 实施严格的塑胶使用规定
- 原物料价格波动
- 机会
- 全球电子商务销售额成长
- 促进因素
第四章硬质塑胶包装市场:依材料分类
- 概述
- 聚对苯二甲酸Terephthalate(PET)
- 聚丙烯(PP)
- 高密度聚丙烯(HDPE)
- 其他的
第五章硬质塑胶包装市场:依製造流程分类
- 概述
- 挤出成型
- 射出成型
- 吹塑
- 热成型
- 其他的
第六章硬质塑胶包装市场:按最终用户产业
- 概述
- 食品和饮料
- 个人护理
- 家庭使用
- 卫生保健
- 其他的
第七章硬质塑胶包装市场:依地区
- 概述
- 北美洲
- 美国
- 加拿大
- 墨西哥
- 欧洲
- 德国
- 法国
- 英国
- 俄罗斯
- 其他的
- 亚太地区
- 中国
- 印度
- 日本
- 澳洲
- 其他的
- 拉丁美洲
- 拉丁美洲
- 中东
- 非洲
第八章 竞争形势
- 介绍
- 关键成功策略
- 10家主要企业产品图谱
- 竞争对手仪表板
- 竞争热图
- 2022年主要企业定位
第九章 公司简介
- DS Smith Plc
- PLASTIPAK HOLDINGS, INC.
- Pactiv Evergreen Inc.
- Sealed Air Corporation.
- ALPLA Werke Alwin Lehner GmbH & Co KG
- Amcor PLC
- Berry Global Inc.
- Klockner Pentaplast Group GmbH & Co. KG
- Silgan Holdings Inc.
- Sonoco Products Company
According to a new report published by Allied Market Research, titled, "Rigid Plastic Packaging Market," The rigid plastic packaging market was valued at $218.6 billion in 2022, and is estimated to reach $342.8 billion by 2032, growing at a CAGR of 4.6% from 2023 to 2032.
Consumer goods is a highly fragmented industry where product differentiation and packaging play a key role. Rise in the global consumption of consumer goods fuels the growth in demand for rigid plastic packaging. In addition, improvement in packaging recycling rates globally drives the market growth. Moreover, rigid plastics are used in a wide range of packaging due to their cost-effectiveness. However, key restraint for the rigid plastic packaging market is related to rise in the use of plastics. Plastics have several harmful effects on the environment and people. Several regulations have been implemented to restrict the overuse of plastics, which is expected to negatively affect the growth of the market. Conversely, rise in e-commerce sales is anticipated to offer lucrative growth opportunities for the expansion of the global market.
The trend toward flexible packaging poses a challenge to rigid plastic packaging due to flexible packaging's advantages, including lightweight design, lower transportation costs, and environmental friendliness. Flexible packaging's adaptability to various shapes and sizes, along with its freshness-preserving innovations, drives its increasing preference. This shift reflects a growing market demand for eco-friendly and versatile packaging solutions, creating stiff competition for rigid plastic. Companies prioritizing adaptability, cost-efficiency, and sustainability increasingly favor flexible packaging, prompting the rigid plastic industry to adapt strategies to stay competitive in an evolving packaging landscape. Such factors act as a restrain for rigid plastic packaging market growth.
The global rigid plastic packaging market is segmented into material, production process, end-user industry, and region. Depending on material, the market is segregated into polyethylene terephthalate (PET), polypropylene (PP), high-density polyethylene (HDPE), and others.
Encouraging sustainable practices presents an opportunity for rigid plastic packaging applications. Advances in recyclable or biodegradable plastics advance the sector by tackling environmental issues. Eco-friendly packaging solutions satisfy consumer demand if new materials are developed, or old ones improved to make them easily recyclable or compostable. Furthermore, encouragement to a more sustainable approaches achieved by educating customers about appropriate disposal techniques and the advantages of recycling rigid plastic packaging. This presents an opportunity for the industry to respond to customer preferences for eco-friendly packaging while upholding the practical advantages of rigid plastic packaging and keeping pace with the growing environmental consciousness.
On the basis of the production process, the market is fragmented into extrusion, injection molding, blow molding, thermoforming, and others. By end-user industry, it is differentiated into food & beverages, personal care, household, healthcare, and others.
According to region, the rigid plastic packaging market is analyzed across North America (U.S., Canada, and Mexico), Europe (Germany, France, UK, Russia, and rest of Europe), Asia-Pacific (China, Japan, India, Australia, and rest of Asia-Pacific), and LAMEA (Latin America, the Middle East, and Africa).
Key market players profiled in the report include ALPLA-Werke Alwin Lehner GmbH & Co KG, Amcor Limited, DS Smith Plc, Berry Plastics Corporation, Klockner Pentaplast, Plastipak Holdings, Inc., Pactiv Evergreen Inc, Sealed Air Corporation, Silgan Holdings, Inc., and Sonoco Products Company.
Key Benefits For Stakeholders
- This report provides a quantitative analysis of the market segments, current trends, estimations, and dynamics of the rigid plastic packaging market analysis from 2022 to 2032 to identify the prevailing rigid plastic packaging market opportunities.
- The market research is offered along with information related to key drivers, restraints, and opportunities.
- Porter's five forces analysis highlights the potency of buyers and suppliers to enable stakeholders make profit-oriented business decisions and strengthen their supplier-buyer network.
- In-depth analysis of the rigid plastic packaging market segmentation assists to determine the prevailing market opportunities.
- Major countries in each region are mapped according to their revenue contribution to the global market.
- Market player positioning facilitates benchmarking and provides a clear understanding of the present position of the market players.
- The report includes the analysis of the regional as well as global rigid plastic packaging market trends, key players, market segments, application areas, and market growth strategies.
Additional benefits you will get with this purchase are:
- Quarterly Update and* (only available with a corporate license, on listed price)
- 5 additional Company Profile of client Choice pre- or Post-purchase, as a free update.
- Free Upcoming Version on the Purchase of Five and Enterprise User License.
- 16 analyst hours of support* (post-purchase, if you find additional data requirements upon review of the report, you may receive support amounting to 16 analyst hours to solve questions, and post-sale queries)
- 15% Free Customization* (in case the scope or segment of the report does not match your requirements, 15% is equivalent to 3 working days of free work, applicable once)
- Free data Pack on the Five and Enterprise User License. (Excel version of the report)
- Free Updated report if the report is 6-12 months old or older.
- 24-hour priority response*
- Free Industry updates and white papers.
Possible Customization with this report (with additional cost and timeline, please talk to the sales executive to know more)
- Investment Opportunities
- Go To Market Strategy
- Additional company profiles with specific to client's interest
- Additional country or region analysis- market size and forecast
- Expanded list for Company Profiles
- Historic market data
Key Market Segments
By Material
- Polyethylene terephthalate (PET)
- Polypropylene (PP)
- High density polypropylene (HDPE)
- Others
By Production Process
- Extrusion
- Injection Molding
- Blow Molding
- Thermoforming
- Others
By End-user Industry
- Food and Beverage
- Personal Care
- Household
- Healthcare
- Others
By Region
- North America
- U.S.
- Canada
- Mexico
- Europe
- Germany
- France
- UK
- Russia
- Rest of Europe
- Asia-Pacific
- China
- India
- Japan
- Australia
- Rest of Asia-Pacific
- LAMEA
- Latin America
- Middle East
- Africa
Key Market Players:
- Pactiv Evergreen Inc.
- Sealed Air Corporation.
- Amcor PLC
- Berry Global Inc.
- Sonoco Products Company
- DS Smith Plc
- Klockner Pentaplast Group GmbH & Co. KG
- ALPLA Werke Alwin Lehner GmbH & Co KG
- Silgan Holdings Inc.
- PLASTIPAK HOLDINGS, INC.
TABLE OF CONTENTS
CHAPTER 1: INTRODUCTION
- 1.1. Report description
- 1.2. Key market segments
- 1.3. Key benefits to the stakeholders
- 1.4. Research methodology
- 1.4.1. Primary research
- 1.4.2. Secondary research
- 1.4.3. Analyst tools and models
CHAPTER 2: EXECUTIVE SUMMARY
- 2.1. CXO Perspective
CHAPTER 3: MARKET OVERVIEW
- 3.1. Market definition and scope
- 3.2. Key findings
- 3.2.1. Top impacting factors
- 3.2.2. Top investment pockets
- 3.3. Porter's five forces analysis
- 3.3.1. Low bargaining power of suppliers
- 3.3.2. Low threat of new entrants
- 3.3.3. Low threat of substitutes
- 3.3.4. Low intensity of rivalry
- 3.3.5. Low bargaining power of buyers
- 3.4. Market dynamics
- 3.4.1. Drivers
- 3.4.1.1. Rise in global consumption of consumer goods.
- 3.4.1.2. Improved recycling rates for packaging.
- 3.4.1.3. Low cost of rigid plastics.
- 3.4.2. Restraints
- 3.4.2.1. Shift toward flexible packaging.
- 3.4.2.2. Implementation of stringent regulations toward the use of plastic.
- 3.4.2.3. Fluctuation in raw material prices.
- 3.4.3. Opportunities
- 3.4.3.1. Rise in e-commerce sales globally.
- 3.4.1. Drivers
CHAPTER 4: RIGID PLASTIC PACKAGING MARKET, BY MATERIAL
- 4.1. Overview
- 4.1.1. Market size and forecast
- 4.2. Polyethylene terephthalate (PET)
- 4.2.1. Key market trends, growth factors and opportunities
- 4.2.2. Market size and forecast, by region
- 4.2.3. Market share analysis by country
- 4.3. Polypropylene (PP)
- 4.3.1. Key market trends, growth factors and opportunities
- 4.3.2. Market size and forecast, by region
- 4.3.3. Market share analysis by country
- 4.4. High density polypropylene (HDPE)
- 4.4.1. Key market trends, growth factors and opportunities
- 4.4.2. Market size and forecast, by region
- 4.4.3. Market share analysis by country
- 4.5. Others
- 4.5.1. Key market trends, growth factors and opportunities
- 4.5.2. Market size and forecast, by region
- 4.5.3. Market share analysis by country
CHAPTER 5: RIGID PLASTIC PACKAGING MARKET, BY PRODUCTION PROCESS
- 5.1. Overview
- 5.1.1. Market size and forecast
- 5.2. Extrusion
- 5.2.1. Key market trends, growth factors and opportunities
- 5.2.2. Market size and forecast, by region
- 5.2.3. Market share analysis by country
- 5.3. Injection Molding
- 5.3.1. Key market trends, growth factors and opportunities
- 5.3.2. Market size and forecast, by region
- 5.3.3. Market share analysis by country
- 5.4. Blow Molding
- 5.4.1. Key market trends, growth factors and opportunities
- 5.4.2. Market size and forecast, by region
- 5.4.3. Market share analysis by country
- 5.5. Thermoforming
- 5.5.1. Key market trends, growth factors and opportunities
- 5.5.2. Market size and forecast, by region
- 5.5.3. Market share analysis by country
- 5.6. Others
- 5.6.1. Key market trends, growth factors and opportunities
- 5.6.2. Market size and forecast, by region
- 5.6.3. Market share analysis by country
CHAPTER 6: RIGID PLASTIC PACKAGING MARKET, BY END-USER INDUSTRY
- 6.1. Overview
- 6.1.1. Market size and forecast
- 6.2. Food and Beverage
- 6.2.1. Key market trends, growth factors and opportunities
- 6.2.2. Market size and forecast, by region
- 6.2.3. Market share analysis by country
- 6.3. Personal Care
- 6.3.1. Key market trends, growth factors and opportunities
- 6.3.2. Market size and forecast, by region
- 6.3.3. Market share analysis by country
- 6.4. Household
- 6.4.1. Key market trends, growth factors and opportunities
- 6.4.2. Market size and forecast, by region
- 6.4.3. Market share analysis by country
- 6.5. Healthcare
- 6.5.1. Key market trends, growth factors and opportunities
- 6.5.2. Market size and forecast, by region
- 6.5.3. Market share analysis by country
- 6.6. Others
- 6.6.1. Key market trends, growth factors and opportunities
- 6.6.2. Market size and forecast, by region
- 6.6.3. Market share analysis by country
CHAPTER 7: RIGID PLASTIC PACKAGING MARKET, BY REGION
- 7.1. Overview
- 7.1.1. Market size and forecast By Region
- 7.2. North America
- 7.2.1. Key market trends, growth factors and opportunities
- 7.2.2. Market size and forecast, by Material
- 7.2.3. Market size and forecast, by Production Process
- 7.2.4. Market size and forecast, by End-user Industry
- 7.2.5. Market size and forecast, by country
- 7.2.5.1. U.S.
- 7.2.5.1.1. Market size and forecast, by Material
- 7.2.5.1.2. Market size and forecast, by Production Process
- 7.2.5.1.3. Market size and forecast, by End-user Industry
- 7.2.5.2. Canada
- 7.2.5.2.1. Market size and forecast, by Material
- 7.2.5.2.2. Market size and forecast, by Production Process
- 7.2.5.2.3. Market size and forecast, by End-user Industry
- 7.2.5.3. Mexico
- 7.2.5.3.1. Market size and forecast, by Material
- 7.2.5.3.2. Market size and forecast, by Production Process
- 7.2.5.3.3. Market size and forecast, by End-user Industry
- 7.3. Europe
- 7.3.1. Key market trends, growth factors and opportunities
- 7.3.2. Market size and forecast, by Material
- 7.3.3. Market size and forecast, by Production Process
- 7.3.4. Market size and forecast, by End-user Industry
- 7.3.5. Market size and forecast, by country
- 7.3.5.1. Germany
- 7.3.5.1.1. Market size and forecast, by Material
- 7.3.5.1.2. Market size and forecast, by Production Process
- 7.3.5.1.3. Market size and forecast, by End-user Industry
- 7.3.5.2. France
- 7.3.5.2.1. Market size and forecast, by Material
- 7.3.5.2.2. Market size and forecast, by Production Process
- 7.3.5.2.3. Market size and forecast, by End-user Industry
- 7.3.5.3. UK
- 7.3.5.3.1. Market size and forecast, by Material
- 7.3.5.3.2. Market size and forecast, by Production Process
- 7.3.5.3.3. Market size and forecast, by End-user Industry
- 7.3.5.4. Russia
- 7.3.5.4.1. Market size and forecast, by Material
- 7.3.5.4.2. Market size and forecast, by Production Process
- 7.3.5.4.3. Market size and forecast, by End-user Industry
- 7.3.5.5. Rest of Europe
- 7.3.5.5.1. Market size and forecast, by Material
- 7.3.5.5.2. Market size and forecast, by Production Process
- 7.3.5.5.3. Market size and forecast, by End-user Industry
- 7.4. Asia-Pacific
- 7.4.1. Key market trends, growth factors and opportunities
- 7.4.2. Market size and forecast, by Material
- 7.4.3. Market size and forecast, by Production Process
- 7.4.4. Market size and forecast, by End-user Industry
- 7.4.5. Market size and forecast, by country
- 7.4.5.1. China
- 7.4.5.1.1. Market size and forecast, by Material
- 7.4.5.1.2. Market size and forecast, by Production Process
- 7.4.5.1.3. Market size and forecast, by End-user Industry
- 7.4.5.2. India
- 7.4.5.2.1. Market size and forecast, by Material
- 7.4.5.2.2. Market size and forecast, by Production Process
- 7.4.5.2.3. Market size and forecast, by End-user Industry
- 7.4.5.3. Japan
- 7.4.5.3.1. Market size and forecast, by Material
- 7.4.5.3.2. Market size and forecast, by Production Process
- 7.4.5.3.3. Market size and forecast, by End-user Industry
- 7.4.5.4. Australia
- 7.4.5.4.1. Market size and forecast, by Material
- 7.4.5.4.2. Market size and forecast, by Production Process
- 7.4.5.4.3. Market size and forecast, by End-user Industry
- 7.4.5.5. Rest of Asia-Pacific
- 7.4.5.5.1. Market size and forecast, by Material
- 7.4.5.5.2. Market size and forecast, by Production Process
- 7.4.5.5.3. Market size and forecast, by End-user Industry
- 7.5. LAMEA
- 7.5.1. Key market trends, growth factors and opportunities
- 7.5.2. Market size and forecast, by Material
- 7.5.3. Market size and forecast, by Production Process
- 7.5.4. Market size and forecast, by End-user Industry
- 7.5.5. Market size and forecast, by country
- 7.5.5.1. Latin America
- 7.5.5.1.1. Market size and forecast, by Material
- 7.5.5.1.2. Market size and forecast, by Production Process
- 7.5.5.1.3. Market size and forecast, by End-user Industry
- 7.5.5.2. Middle East
- 7.5.5.2.1. Market size and forecast, by Material
- 7.5.5.2.2. Market size and forecast, by Production Process
- 7.5.5.2.3. Market size and forecast, by End-user Industry
- 7.5.5.3. Africa
- 7.5.5.3.1. Market size and forecast, by Material
- 7.5.5.3.2. Market size and forecast, by Production Process
- 7.5.5.3.3. Market size and forecast, by End-user Industry
CHAPTER 8: COMPETITIVE LANDSCAPE
- 8.1. Introduction
- 8.2. Top winning strategies
- 8.3. Product mapping of top 10 player
- 8.4. Competitive dashboard
- 8.5. Competitive heatmap
- 8.6. Top player positioning, 2022
CHAPTER 9: COMPANY PROFILES
- 9.1. DS Smith Plc
- 9.1.1. Company overview
- 9.1.2. Key executives
- 9.1.3. Company snapshot
- 9.1.4. Operating business segments
- 9.1.5. Product portfolio
- 9.1.6. Business performance
- 9.1.7. Key strategic moves and developments
- 9.2. PLASTIPAK HOLDINGS, INC.
- 9.2.1. Company overview
- 9.2.2. Key executives
- 9.2.3. Company snapshot
- 9.2.4. Operating business segments
- 9.2.5. Product portfolio
- 9.2.6. Key strategic moves and developments
- 9.3. Pactiv Evergreen Inc.
- 9.3.1. Company overview
- 9.3.2. Key executives
- 9.3.3. Company snapshot
- 9.3.4. Operating business segments
- 9.3.5. Product portfolio
- 9.3.6. Business performance
- 9.3.7. Key strategic moves and developments
- 9.4. Sealed Air Corporation.
- 9.4.1. Company overview
- 9.4.2. Key executives
- 9.4.3. Company snapshot
- 9.4.4. Operating business segments
- 9.4.5. Product portfolio
- 9.4.6. Business performance
- 9.4.7. Key strategic moves and developments
- 9.5. ALPLA Werke Alwin Lehner GmbH & Co KG
- 9.5.1. Company overview
- 9.5.2. Key executives
- 9.5.3. Company snapshot
- 9.5.4. Operating business segments
- 9.5.5. Product portfolio
- 9.5.6. Key strategic moves and developments
- 9.6. Amcor PLC
- 9.6.1. Company overview
- 9.6.2. Key executives
- 9.6.3. Company snapshot
- 9.6.4. Operating business segments
- 9.6.5. Product portfolio
- 9.6.6. Business performance
- 9.6.7. Key strategic moves and developments
- 9.7. Berry Global Inc.
- 9.7.1. Company overview
- 9.7.2. Key executives
- 9.7.3. Company snapshot
- 9.7.4. Operating business segments
- 9.7.5. Product portfolio
- 9.7.6. Business performance
- 9.7.7. Key strategic moves and developments
- 9.8. Klockner Pentaplast Group GmbH & Co. KG
- 9.8.1. Company overview
- 9.8.2. Key executives
- 9.8.3. Company snapshot
- 9.8.4. Operating business segments
- 9.8.5. Product portfolio
- 9.8.6. Key strategic moves and developments
- 9.9. Silgan Holdings Inc.
- 9.9.1. Company overview
- 9.9.2. Key executives
- 9.9.3. Company snapshot
- 9.9.4. Operating business segments
- 9.9.5. Product portfolio
- 9.9.6. Business performance
- 9.9.7. Key strategic moves and developments
- 9.10. Sonoco Products Company
- 9.10.1. Company overview
- 9.10.2. Key executives
- 9.10.3. Company snapshot
- 9.10.4. Operating business segments
- 9.10.5. Product portfolio
- 9.10.6. Business performance
LIST OF TABLES
- TABLE 01. GLOBAL RIGID PLASTIC PACKAGING MARKET, BY MATERIAL, 2022-2032 ($MILLION)
- TABLE 02. RIGID PLASTIC PACKAGING MARKET FOR POLYETHYLENE TEREPHTHALATE (PET), BY REGION, 2022-2032 ($MILLION)
- TABLE 03. RIGID PLASTIC PACKAGING MARKET FOR POLYPROPYLENE (PP), BY REGION, 2022-2032 ($MILLION)
- TABLE 04. RIGID PLASTIC PACKAGING MARKET FOR HIGH DENSITY POLYPROPYLENE (HDPE), BY REGION, 2022-2032 ($MILLION)
- TABLE 05. RIGID PLASTIC PACKAGING MARKET FOR OTHERS, BY REGION, 2022-2032 ($MILLION)
- TABLE 06. GLOBAL RIGID PLASTIC PACKAGING MARKET, BY PRODUCTION PROCESS, 2022-2032 ($MILLION)
- TABLE 07. RIGID PLASTIC PACKAGING MARKET FOR EXTRUSION, BY REGION, 2022-2032 ($MILLION)
- TABLE 08. RIGID PLASTIC PACKAGING MARKET FOR INJECTION MOLDING, BY REGION, 2022-2032 ($MILLION)
- TABLE 09. RIGID PLASTIC PACKAGING MARKET FOR BLOW MOLDING, BY REGION, 2022-2032 ($MILLION)
- TABLE 10. RIGID PLASTIC PACKAGING MARKET FOR THERMOFORMING, BY REGION, 2022-2032 ($MILLION)
- TABLE 11. RIGID PLASTIC PACKAGING MARKET FOR OTHERS, BY REGION, 2022-2032 ($MILLION)
- TABLE 12. GLOBAL RIGID PLASTIC PACKAGING MARKET, BY END-USER INDUSTRY, 2022-2032 ($MILLION)
- TABLE 13. RIGID PLASTIC PACKAGING MARKET FOR FOOD AND BEVERAGE, BY REGION, 2022-2032 ($MILLION)
- TABLE 14. RIGID PLASTIC PACKAGING MARKET FOR PERSONAL CARE, BY REGION, 2022-2032 ($MILLION)
- TABLE 15. RIGID PLASTIC PACKAGING MARKET FOR HOUSEHOLD, BY REGION, 2022-2032 ($MILLION)
- TABLE 16. RIGID PLASTIC PACKAGING MARKET FOR HEALTHCARE, BY REGION, 2022-2032 ($MILLION)
- TABLE 17. RIGID PLASTIC PACKAGING MARKET FOR OTHERS, BY REGION, 2022-2032 ($MILLION)
- TABLE 18. RIGID PLASTIC PACKAGING MARKET, BY REGION, 2022-2032 ($MILLION)
- TABLE 19. NORTH AMERICA RIGID PLASTIC PACKAGING MARKET, BY MATERIAL, 2022-2032 ($MILLION)
- TABLE 20. NORTH AMERICA RIGID PLASTIC PACKAGING MARKET, BY PRODUCTION PROCESS, 2022-2032 ($MILLION)
- TABLE 21. NORTH AMERICA RIGID PLASTIC PACKAGING MARKET, BY END-USER INDUSTRY, 2022-2032 ($MILLION)
- TABLE 22. NORTH AMERICA RIGID PLASTIC PACKAGING MARKET, BY COUNTRY, 2022-2032 ($MILLION)
- TABLE 23. U.S. RIGID PLASTIC PACKAGING MARKET, BY MATERIAL, 2022-2032 ($MILLION)
- TABLE 24. U.S. RIGID PLASTIC PACKAGING MARKET, BY PRODUCTION PROCESS, 2022-2032 ($MILLION)
- TABLE 25. U.S. RIGID PLASTIC PACKAGING MARKET, BY END-USER INDUSTRY, 2022-2032 ($MILLION)
- TABLE 26. CANADA RIGID PLASTIC PACKAGING MARKET, BY MATERIAL, 2022-2032 ($MILLION)
- TABLE 27. CANADA RIGID PLASTIC PACKAGING MARKET, BY PRODUCTION PROCESS, 2022-2032 ($MILLION)
- TABLE 28. CANADA RIGID PLASTIC PACKAGING MARKET, BY END-USER INDUSTRY, 2022-2032 ($MILLION)
- TABLE 29. MEXICO RIGID PLASTIC PACKAGING MARKET, BY MATERIAL, 2022-2032 ($MILLION)
- TABLE 30. MEXICO RIGID PLASTIC PACKAGING MARKET, BY PRODUCTION PROCESS, 2022-2032 ($MILLION)
- TABLE 31. MEXICO RIGID PLASTIC PACKAGING MARKET, BY END-USER INDUSTRY, 2022-2032 ($MILLION)
- TABLE 32. EUROPE RIGID PLASTIC PACKAGING MARKET, BY MATERIAL, 2022-2032 ($MILLION)
- TABLE 33. EUROPE RIGID PLASTIC PACKAGING MARKET, BY PRODUCTION PROCESS, 2022-2032 ($MILLION)
- TABLE 34. EUROPE RIGID PLASTIC PACKAGING MARKET, BY END-USER INDUSTRY, 2022-2032 ($MILLION)
- TABLE 35. EUROPE RIGID PLASTIC PACKAGING MARKET, BY COUNTRY, 2022-2032 ($MILLION)
- TABLE 36. GERMANY RIGID PLASTIC PACKAGING MARKET, BY MATERIAL, 2022-2032 ($MILLION)
- TABLE 37. GERMANY RIGID PLASTIC PACKAGING MARKET, BY PRODUCTION PROCESS, 2022-2032 ($MILLION)
- TABLE 38. GERMANY RIGID PLASTIC PACKAGING MARKET, BY END-USER INDUSTRY, 2022-2032 ($MILLION)
- TABLE 39. FRANCE RIGID PLASTIC PACKAGING MARKET, BY MATERIAL, 2022-2032 ($MILLION)
- TABLE 40. FRANCE RIGID PLASTIC PACKAGING MARKET, BY PRODUCTION PROCESS, 2022-2032 ($MILLION)
- TABLE 41. FRANCE RIGID PLASTIC PACKAGING MARKET, BY END-USER INDUSTRY, 2022-2032 ($MILLION)
- TABLE 42. UK RIGID PLASTIC PACKAGING MARKET, BY MATERIAL, 2022-2032 ($MILLION)
- TABLE 43. UK RIGID PLASTIC PACKAGING MARKET, BY PRODUCTION PROCESS, 2022-2032 ($MILLION)
- TABLE 44. UK RIGID PLASTIC PACKAGING MARKET, BY END-USER INDUSTRY, 2022-2032 ($MILLION)
- TABLE 45. RUSSIA RIGID PLASTIC PACKAGING MARKET, BY MATERIAL, 2022-2032 ($MILLION)
- TABLE 46. RUSSIA RIGID PLASTIC PACKAGING MARKET, BY PRODUCTION PROCESS, 2022-2032 ($MILLION)
- TABLE 47. RUSSIA RIGID PLASTIC PACKAGING MARKET, BY END-USER INDUSTRY, 2022-2032 ($MILLION)
- TABLE 48. REST OF EUROPE RIGID PLASTIC PACKAGING MARKET, BY MATERIAL, 2022-2032 ($MILLION)
- TABLE 49. REST OF EUROPE RIGID PLASTIC PACKAGING MARKET, BY PRODUCTION PROCESS, 2022-2032 ($MILLION)
- TABLE 50. REST OF EUROPE RIGID PLASTIC PACKAGING MARKET, BY END-USER INDUSTRY, 2022-2032 ($MILLION)
- TABLE 51. ASIA-PACIFIC RIGID PLASTIC PACKAGING MARKET, BY MATERIAL, 2022-2032 ($MILLION)
- TABLE 52. ASIA-PACIFIC RIGID PLASTIC PACKAGING MARKET, BY PRODUCTION PROCESS, 2022-2032 ($MILLION)
- TABLE 53. ASIA-PACIFIC RIGID PLASTIC PACKAGING MARKET, BY END-USER INDUSTRY, 2022-2032 ($MILLION)
- TABLE 54. ASIA-PACIFIC RIGID PLASTIC PACKAGING MARKET, BY COUNTRY, 2022-2032 ($MILLION)
- TABLE 55. CHINA RIGID PLASTIC PACKAGING MARKET, BY MATERIAL, 2022-2032 ($MILLION)
- TABLE 56. CHINA RIGID PLASTIC PACKAGING MARKET, BY PRODUCTION PROCESS, 2022-2032 ($MILLION)
- TABLE 57. CHINA RIGID PLASTIC PACKAGING MARKET, BY END-USER INDUSTRY, 2022-2032 ($MILLION)
- TABLE 58. INDIA RIGID PLASTIC PACKAGING MARKET, BY MATERIAL, 2022-2032 ($MILLION)
- TABLE 59. INDIA RIGID PLASTIC PACKAGING MARKET, BY PRODUCTION PROCESS, 2022-2032 ($MILLION)
- TABLE 60. INDIA RIGID PLASTIC PACKAGING MARKET, BY END-USER INDUSTRY, 2022-2032 ($MILLION)
- TABLE 61. JAPAN RIGID PLASTIC PACKAGING MARKET, BY MATERIAL, 2022-2032 ($MILLION)
- TABLE 62. JAPAN RIGID PLASTIC PACKAGING MARKET, BY PRODUCTION PROCESS, 2022-2032 ($MILLION)
- TABLE 63. JAPAN RIGID PLASTIC PACKAGING MARKET, BY END-USER INDUSTRY, 2022-2032 ($MILLION)
- TABLE 64. AUSTRALIA RIGID PLASTIC PACKAGING MARKET, BY MATERIAL, 2022-2032 ($MILLION)
- TABLE 65. AUSTRALIA RIGID PLASTIC PACKAGING MARKET, BY PRODUCTION PROCESS, 2022-2032 ($MILLION)
- TABLE 66. AUSTRALIA RIGID PLASTIC PACKAGING MARKET, BY END-USER INDUSTRY, 2022-2032 ($MILLION)
- TABLE 67. REST OF ASIA-PACIFIC RIGID PLASTIC PACKAGING MARKET, BY MATERIAL, 2022-2032 ($MILLION)
- TABLE 68. REST OF ASIA-PACIFIC RIGID PLASTIC PACKAGING MARKET, BY PRODUCTION PROCESS, 2022-2032 ($MILLION)
- TABLE 69. REST OF ASIA-PACIFIC RIGID PLASTIC PACKAGING MARKET, BY END-USER INDUSTRY, 2022-2032 ($MILLION)
- TABLE 70. LAMEA RIGID PLASTIC PACKAGING MARKET, BY MATERIAL, 2022-2032 ($MILLION)
- TABLE 71. LAMEA RIGID PLASTIC PACKAGING MARKET, BY PRODUCTION PROCESS, 2022-2032 ($MILLION)
- TABLE 72. LAMEA RIGID PLASTIC PACKAGING MARKET, BY END-USER INDUSTRY, 2022-2032 ($MILLION)
- TABLE 73. LAMEA RIGID PLASTIC PACKAGING MARKET, BY COUNTRY, 2022-2032 ($MILLION)
- TABLE 74. LATIN AMERICA RIGID PLASTIC PACKAGING MARKET, BY MATERIAL, 2022-2032 ($MILLION)
- TABLE 75. LATIN AMERICA RIGID PLASTIC PACKAGING MARKET, BY PRODUCTION PROCESS, 2022-2032 ($MILLION)
- TABLE 76. LATIN AMERICA RIGID PLASTIC PACKAGING MARKET, BY END-USER INDUSTRY, 2022-2032 ($MILLION)
- TABLE 77. MIDDLE EAST RIGID PLASTIC PACKAGING MARKET, BY MATERIAL, 2022-2032 ($MILLION)
- TABLE 78. MIDDLE EAST RIGID PLASTIC PACKAGING MARKET, BY PRODUCTION PROCESS, 2022-2032 ($MILLION)
- TABLE 79. MIDDLE EAST RIGID PLASTIC PACKAGING MARKET, BY END-USER INDUSTRY, 2022-2032 ($MILLION)
- TABLE 80. AFRICA RIGID PLASTIC PACKAGING MARKET, BY MATERIAL, 2022-2032 ($MILLION)
- TABLE 81. AFRICA RIGID PLASTIC PACKAGING MARKET, BY PRODUCTION PROCESS, 2022-2032 ($MILLION)
- TABLE 82. AFRICA RIGID PLASTIC PACKAGING MARKET, BY END-USER INDUSTRY, 2022-2032 ($MILLION)
- TABLE 83. DS SMITH PLC: KEY EXECUTIVES
- TABLE 84. DS SMITH PLC: COMPANY SNAPSHOT
- TABLE 85. DS SMITH PLC: PRODUCT SEGMENTS
- TABLE 86. DS SMITH PLC: PRODUCT PORTFOLIO
- TABLE 87. DS SMITH PLC: KEY STRATERGIES
- TABLE 88. PLASTIPAK HOLDINGS, INC.: KEY EXECUTIVES
- TABLE 89. PLASTIPAK HOLDINGS, INC.: COMPANY SNAPSHOT
- TABLE 90. PLASTIPAK HOLDINGS, INC.: PRODUCT SEGMENTS
- TABLE 91. PLASTIPAK HOLDINGS, INC.: PRODUCT PORTFOLIO
- TABLE 92. PLASTIPAK HOLDINGS, INC.: KEY STRATERGIES
- TABLE 93. PACTIV EVERGREEN INC.: KEY EXECUTIVES
- TABLE 94. PACTIV EVERGREEN INC.: COMPANY SNAPSHOT
- TABLE 95. PACTIV EVERGREEN INC.: PRODUCT SEGMENTS
- TABLE 96. PACTIV EVERGREEN INC.: PRODUCT PORTFOLIO
- TABLE 97. PACTIV EVERGREEN INC.: KEY STRATERGIES
- TABLE 98. SEALED AIR CORPORATION.: KEY EXECUTIVES
- TABLE 99. SEALED AIR CORPORATION.: COMPANY SNAPSHOT
- TABLE 100. SEALED AIR CORPORATION.: PRODUCT SEGMENTS
- TABLE 101. SEALED AIR CORPORATION.: PRODUCT PORTFOLIO
- TABLE 102. SEALED AIR CORPORATION.: KEY STRATERGIES
- TABLE 103. ALPLA WERKE ALWIN LEHNER GMBH & CO KG: KEY EXECUTIVES
- TABLE 104. ALPLA WERKE ALWIN LEHNER GMBH & CO KG: COMPANY SNAPSHOT
- TABLE 105. ALPLA WERKE ALWIN LEHNER GMBH & CO KG: PRODUCT SEGMENTS
- TABLE 106. ALPLA WERKE ALWIN LEHNER GMBH & CO KG: PRODUCT PORTFOLIO
- TABLE 107. ALPLA WERKE ALWIN LEHNER GMBH & CO KG: KEY STRATERGIES
- TABLE 108. AMCOR PLC: KEY EXECUTIVES
- TABLE 109. AMCOR PLC: COMPANY SNAPSHOT
- TABLE 110. AMCOR PLC: PRODUCT SEGMENTS
- TABLE 111. AMCOR PLC: PRODUCT PORTFOLIO
- TABLE 112. AMCOR PLC: KEY STRATERGIES
- TABLE 113. BERRY GLOBAL INC.: KEY EXECUTIVES
- TABLE 114. BERRY GLOBAL INC.: COMPANY SNAPSHOT
- TABLE 115. BERRY GLOBAL INC.: PRODUCT SEGMENTS
- TABLE 116. BERRY GLOBAL INC.: PRODUCT PORTFOLIO
- TABLE 117. BERRY GLOBAL INC.: KEY STRATERGIES
- TABLE 118. KLOCKNER PENTAPLAST GROUP GMBH & CO. KG: KEY EXECUTIVES
- TABLE 119. KLOCKNER PENTAPLAST GROUP GMBH & CO. KG: COMPANY SNAPSHOT
- TABLE 120. KLOCKNER PENTAPLAST GROUP GMBH & CO. KG: PRODUCT SEGMENTS
- TABLE 121. KLOCKNER PENTAPLAST GROUP GMBH & CO. KG: PRODUCT PORTFOLIO
- TABLE 122. KLOCKNER PENTAPLAST GROUP GMBH & CO. KG: KEY STRATERGIES
- TABLE 123. SILGAN HOLDINGS INC.: KEY EXECUTIVES
- TABLE 124. SILGAN HOLDINGS INC.: COMPANY SNAPSHOT
- TABLE 125. SILGAN HOLDINGS INC.: PRODUCT SEGMENTS
- TABLE 126. SILGAN HOLDINGS INC.: PRODUCT PORTFOLIO
- TABLE 127. SILGAN HOLDINGS INC.: KEY STRATERGIES
- TABLE 128. SONOCO PRODUCTS COMPANY: KEY EXECUTIVES
- TABLE 129. SONOCO PRODUCTS COMPANY: COMPANY SNAPSHOT
- TABLE 130. SONOCO PRODUCTS COMPANY: PRODUCT SEGMENTS
- TABLE 131. SONOCO PRODUCTS COMPANY: PRODUCT PORTFOLIO
LIST OF FIGURES
- FIGURE 01. RIGID PLASTIC PACKAGING MARKET, 2022-2032
- FIGURE 02. SEGMENTATION OF RIGID PLASTIC PACKAGING MARKET,2022-2032
- FIGURE 03. TOP IMPACTING FACTORS IN RIGID PLASTIC PACKAGING MARKET (2022 TO 2032)
- FIGURE 04. TOP INVESTMENT POCKETS IN RIGID PLASTIC PACKAGING MARKET (2023-2032)
- FIGURE 05. LOW BARGAINING POWER OF SUPPLIERS
- FIGURE 06. LOW THREAT OF NEW ENTRANTS
- FIGURE 07. LOW THREAT OF SUBSTITUTES
- FIGURE 08. LOW INTENSITY OF RIVALRY
- FIGURE 09. LOW BARGAINING POWER OF BUYERS
- FIGURE 10. GLOBAL RIGID PLASTIC PACKAGING MARKET:DRIVERS, RESTRAINTS AND OPPORTUNITIES
- FIGURE 11. RIGID PLASTIC PACKAGING MARKET, BY MATERIAL, 2022 AND 2032(%)
- FIGURE 12. COMPARATIVE SHARE ANALYSIS OF RIGID PLASTIC PACKAGING MARKET FOR POLYETHYLENE TEREPHTHALATE (PET), BY COUNTRY 2022 AND 2032(%)
- FIGURE 13. COMPARATIVE SHARE ANALYSIS OF RIGID PLASTIC PACKAGING MARKET FOR POLYPROPYLENE (PP), BY COUNTRY 2022 AND 2032(%)
- FIGURE 14. COMPARATIVE SHARE ANALYSIS OF RIGID PLASTIC PACKAGING MARKET FOR HIGH DENSITY POLYPROPYLENE (HDPE), BY COUNTRY 2022 AND 2032(%)
- FIGURE 15. COMPARATIVE SHARE ANALYSIS OF RIGID PLASTIC PACKAGING MARKET FOR OTHERS, BY COUNTRY 2022 AND 2032(%)
- FIGURE 16. RIGID PLASTIC PACKAGING MARKET, BY PRODUCTION PROCESS, 2022 AND 2032(%)
- FIGURE 17. COMPARATIVE SHARE ANALYSIS OF RIGID PLASTIC PACKAGING MARKET FOR EXTRUSION, BY COUNTRY 2022 AND 2032(%)
- FIGURE 18. COMPARATIVE SHARE ANALYSIS OF RIGID PLASTIC PACKAGING MARKET FOR INJECTION MOLDING, BY COUNTRY 2022 AND 2032(%)
- FIGURE 19. COMPARATIVE SHARE ANALYSIS OF RIGID PLASTIC PACKAGING MARKET FOR BLOW MOLDING, BY COUNTRY 2022 AND 2032(%)
- FIGURE 20. COMPARATIVE SHARE ANALYSIS OF RIGID PLASTIC PACKAGING MARKET FOR THERMOFORMING, BY COUNTRY 2022 AND 2032(%)
- FIGURE 21. COMPARATIVE SHARE ANALYSIS OF RIGID PLASTIC PACKAGING MARKET FOR OTHERS, BY COUNTRY 2022 AND 2032(%)
- FIGURE 22. RIGID PLASTIC PACKAGING MARKET, BY END-USER INDUSTRY, 2022 AND 2032(%)
- FIGURE 23. COMPARATIVE SHARE ANALYSIS OF RIGID PLASTIC PACKAGING MARKET FOR FOOD AND BEVERAGE, BY COUNTRY 2022 AND 2032(%)
- FIGURE 24. COMPARATIVE SHARE ANALYSIS OF RIGID PLASTIC PACKAGING MARKET FOR PERSONAL CARE, BY COUNTRY 2022 AND 2032(%)
- FIGURE 25. COMPARATIVE SHARE ANALYSIS OF RIGID PLASTIC PACKAGING MARKET FOR HOUSEHOLD, BY COUNTRY 2022 AND 2032(%)
- FIGURE 26. COMPARATIVE SHARE ANALYSIS OF RIGID PLASTIC PACKAGING MARKET FOR HEALTHCARE, BY COUNTRY 2022 AND 2032(%)
- FIGURE 27. COMPARATIVE SHARE ANALYSIS OF RIGID PLASTIC PACKAGING MARKET FOR OTHERS, BY COUNTRY 2022 AND 2032(%)
- FIGURE 28. RIGID PLASTIC PACKAGING MARKET BY REGION, 2022 AND 2032(%)
- FIGURE 29. U.S. RIGID PLASTIC PACKAGING MARKET, 2022-2032 ($MILLION)
- FIGURE 30. CANADA RIGID PLASTIC PACKAGING MARKET, 2022-2032 ($MILLION)
- FIGURE 31. MEXICO RIGID PLASTIC PACKAGING MARKET, 2022-2032 ($MILLION)
- FIGURE 32. GERMANY RIGID PLASTIC PACKAGING MARKET, 2022-2032 ($MILLION)
- FIGURE 33. FRANCE RIGID PLASTIC PACKAGING MARKET, 2022-2032 ($MILLION)
- FIGURE 34. UK RIGID PLASTIC PACKAGING MARKET, 2022-2032 ($MILLION)
- FIGURE 35. RUSSIA RIGID PLASTIC PACKAGING MARKET, 2022-2032 ($MILLION)
- FIGURE 36. REST OF EUROPE RIGID PLASTIC PACKAGING MARKET, 2022-2032 ($MILLION)
- FIGURE 37. CHINA RIGID PLASTIC PACKAGING MARKET, 2022-2032 ($MILLION)
- FIGURE 38. INDIA RIGID PLASTIC PACKAGING MARKET, 2022-2032 ($MILLION)
- FIGURE 39. JAPAN RIGID PLASTIC PACKAGING MARKET, 2022-2032 ($MILLION)
- FIGURE 40. AUSTRALIA RIGID PLASTIC PACKAGING MARKET, 2022-2032 ($MILLION)
- FIGURE 41. REST OF ASIA-PACIFIC RIGID PLASTIC PACKAGING MARKET, 2022-2032 ($MILLION)
- FIGURE 42. LATIN AMERICA RIGID PLASTIC PACKAGING MARKET, 2022-2032 ($MILLION)
- FIGURE 43. MIDDLE EAST RIGID PLASTIC PACKAGING MARKET, 2022-2032 ($MILLION)
- FIGURE 44. AFRICA RIGID PLASTIC PACKAGING MARKET, 2022-2032 ($MILLION)
- FIGURE 45. TOP WINNING STRATEGIES, BY YEAR (2021-2023)
- FIGURE 46. TOP WINNING STRATEGIES, BY DEVELOPMENT (2021-2023)
- FIGURE 47. TOP WINNING STRATEGIES, BY COMPANY (2021-2023)
- FIGURE 48. PRODUCT MAPPING OF TOP 10 PLAYERS
- FIGURE 49. COMPETITIVE DASHBOARD
- FIGURE 50. COMPETITIVE HEATMAP: RIGID PLASTIC PACKAGING MARKET
- FIGURE 51. TOP PLAYER POSITIONING, 2022
- FIGURE 52. DS SMITH PLC: NET REVENUE, 2021-2023 ($MILLION)
- FIGURE 53. DS SMITH PLC: RESEARCH & DEVELOPMENT EXPENDITURE, 2021-2023 ($MILLION)
- FIGURE 54. DS SMITH PLC: REVENUE SHARE BY REGION, 2023 (%)
- FIGURE 55. PACTIV EVERGREEN INC.: NET SALES, 2020-2022 ($MILLION)
- FIGURE 56. PACTIV EVERGREEN INC.: RESEARCH & DEVELOPMENT EXPENDITURE, 2020-2022 ($MILLION)
- FIGURE 57. PACTIV EVERGREEN INC.: REVENUE SHARE BY REGION, 2022 (%)
- FIGURE 58. PACTIV EVERGREEN INC.: REVENUE SHARE BY SEGMENT, 2022 (%)
- FIGURE 59. SEALED AIR CORPORATION.: NET SALES, 2020-2022 ($MILLION)
- FIGURE 60. SEALED AIR CORPORATION.: RESEARCH & DEVELOPMENT EXPENDITURE, 2020-2022 ($MILLION)
- FIGURE 61. SEALED AIR CORPORATION.: REVENUE SHARE BY REGION, 2022 (%)
- FIGURE 62. SEALED AIR CORPORATION.: REVENUE SHARE BY SEGMENT, 2022 (%)
- FIGURE 63. AMCOR PLC: NET SALES, 2021-2023 ($MILLION)
- FIGURE 64. AMCOR PLC: RESEARCH & DEVELOPMENT EXPENDITURE, 2021-2023 ($MILLION)
- FIGURE 65. AMCOR PLC: REVENUE SHARE BY SEGMENT, 2023 (%)
- FIGURE 66. AMCOR PLC: REVENUE SHARE BY REGION, 2023 (%)
- FIGURE 67. BERRY GLOBAL INC.: NET SALES, 2020-2022 ($MILLION)
- FIGURE 68. BERRY GLOBAL INC.: RESEARCH & DEVELOPMENT EXPENDITURE, 2020-2022 ($MILLION)
- FIGURE 69. BERRY GLOBAL INC.: REVENUE SHARE BY SEGMENT, 2022 (%)
- FIGURE 70. BERRY GLOBAL INC.: REVENUE SHARE BY REGION, 2022 (%)
- FIGURE 71. SILGAN HOLDINGS INC.: NET REVENUE, 2020-2022 ($MILLION)
- FIGURE 72. SILGAN HOLDINGS INC.: REVENUE SHARE BY REGION, 2022 (%)
- FIGURE 73. SONOCO PRODUCTS COMPANY: NET SALES, 2020-2022 ($MILLION)
- FIGURE 74. SONOCO PRODUCTS COMPANY: RESEARCH & DEVELOPMENT EXPENDITURE, 2020-2022 ($MILLION)
- FIGURE 75. SONOCO PRODUCTS COMPANY: REVENUE SHARE BY SEGMENT, 2022 (%)
- FIGURE 76. SONOCO PRODUCTS COMPANY: REVENUE SHARE BY REGION, 2022 (%)
 硬质塑胶包装市场(2025-2029)
 2032 年硬质塑胶包装市场预测:按包装类型、材料类型、技术、应用、最终用户和地区进行的全球分析
 硬质塑胶包装:市场占有率分析、产业趋势与统计、成长预测(2025-2030)
 2025 年硬质塑胶包装全球市场报告印尼硬质塑胶包装:市场占有率分析、行业趋势和统计、成长预测(2025-2030 年)硬质塑胶包装市场规模、份额、成长分析、按产品类型、按原材料、按生产过程、按最终用途、按地区 - 行业预测,2024-2031 年
 硬质塑胶包装市场:按原料、产品类型、製造流程和应用分类 - 2025-2030 年全球预测
 硬质塑胶包装市场:依原料、类型、应用、地区划分,2024-2031
 2024-2032 年按产品、材料(聚乙烯、聚丙烯、高密度聚丙烯等)、生产流程、最终用途产业和地区分類的硬塑胶包装市场报告
 硬质塑胶包装市场,按产品类型、按应用、按材料、按配销通路、按国家和地区 - 2024-2032 年行业分析、市场规模、市场份额和预测