


 |
市场调查报告书
商品编码
1472396
纹理蛋白市场:按应用、形式和产品类型:2023-2032 年全球机会分析和产业预测Textured Protein Market By Application, By Form, By Product Type : Global Opportunity Analysis and Industry Forecast, 2023-2032 |
||||||
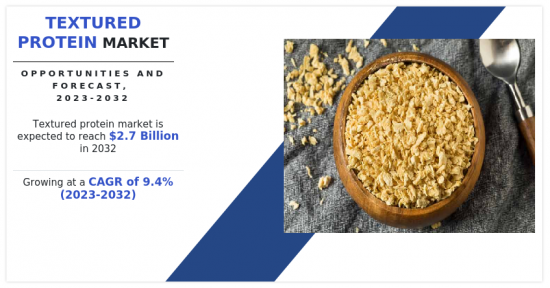
2022年全球纹理蛋白市值为11亿美元,预计2023年至2032年复合年增长率为9.4%,到2032年达到27亿美元。
纹理蛋白是基于植物或实验室种植的加工蛋白产品,旨在模仿肉类的味道、质地和营养成分。常见来源包括大豆、小麦和豌豆蛋白。透过挤压成型和发酵等各种技术,这些蛋白质被加工成素食汉堡和素食和纯素饮食的肉类替代品等产品。
消费者对永续和道德食品的偏好显着增加了对纹理蛋白市场的需求。许多消费者现在正在寻找符合他们永续性和道德对待动物价值的肉类替代品。植物来源纹理蛋白提供了类似肉类的体验,但没有相关的环境缺陷和道德问题,使其成为解决这些问题的理想解决方案。
此外,随着人们健康意识的增强,他们越来越多地寻求植物来源,例如纹理蛋白。这一趋势正在推动食品製造商投资研发,以改善组织蛋白产品的口味、质地和营养成分,进一步推动市场成长。因此,消费者对永续和道德食品选择的偏好不断增长,推动了对纹理蛋白质的需求,并重塑食品产业,朝着更绿色和对社会负责的做法发展。
此外,技术创新在推动纹理蛋白市场的需求方面发挥着至关重要的作用。特别是在调味和质地改善技术领域,这些进步使製造商能够创造出非常接近肉类味道和质地的产品,从而对寻求替代品的消费者更具吸引力。透过改善组织蛋白产品的风味和质地,公司可以吸引更广泛的消费者,包括那些先前对尝试植物来源产品犹豫不决的消费者。
此外,这些技术创新使得各种纹理蛋白产品的开发成为可能,以满足不同的偏好和文化偏好。无论是製作多汁的汉堡肉饼、美味的肉丸还是嫩鸡肉条,在不使用动物食品的情况下重现肉的感觉的能力是市场增长的主要驱动力。随着消费者在食品选择上变得更加挑剔并寻求更健康和更永续的选择,调味和质感增强技术的持续创新将进一步推动质感蛋白质市场的扩张。
与名厨和影响者的合作为纹理蛋白市场提供了重要机会。这些人通常拥有大量追随者并影响消费者的偏好和趋势。透过与他们合作,纹理蛋白製造商可以利用他们的影响力,向更多人推广他们的产品。名厨利用纹理蛋白创造出创新且有吸引力的食谱,以突显其多功能性和烹饪潜力。他们的认可为纹理蛋白产品带来了可信度和声望,使它们更受消费者欢迎。
此外,有影响力的人利用他们的平台创建有关纹理蛋白质的引人入胜的内容,并与他们的追随者共用食谱、烹饪技巧和个人经验。这引起了人们对组织蛋白产品的热议和兴奋,增加了消费者的兴趣和需求。此外,与影响者的合作提供了宝贵的回馈和对消费者偏好的洞察,帮助製造商调整其产品以更好地满足市场需求。总体而言,与名厨和有影响力的人合作可以提高纹理蛋白的知名度、可信度和消费者接受度,最终推动市场的成长和扩张。
然而,由于监管清晰度和缺乏标准,纹理蛋白市场面临重大挑战。监管机构缺乏明确的指导方针和标准,导致组织蛋白产品的生产、标籤和行销出现混乱和不确定性。由于担心这些产品的安全性、品质和真实性,这阻碍了消费者购买这些产品。此外,缺乏标准化法规使食品製造商难以确保遵守地区不同的要求,从而导致市场分散和效率低下。
此外,缺乏明确的监管也阻碍了组织蛋白市场的创新和投资。在不清楚法律和监管环境的情况下,公司对于开发新产品或扩大业务犹豫不决。这种不确定性也阻碍了潜在投资者资助旨在增强纹理蛋白产品的研发倡议。最终,法规和标准的不明确是市场成长的障碍,阻碍了纹理蛋白作为传统肉类的可行替代品的普及。
组织蛋白市场分为产品类型、形式、应用和区域。依产品类型划分,市场分为组织化大豆蛋白(TSP)、组织化小麦蛋白(TWP)和组织化豆类蛋白(TPP)。依格式,市场分为片状、片状、颗粒状和块状。根据应用,市场分为肉类替代品、肉类补充剂、汤和炖菜、零食、谷物、烘焙产品等。从区域来看,我们对北美、欧洲、亚太地区、洛杉矶和中东和非洲地区进行了分析。
英国食品公司 (British Foods PLC)、Bob's Red Mill Natural Foods、Ingredion Inc.、Roquette Frere 和 Vippy Industries Ltd 等主要企业正在进行主要产品核可、联盟、协议和收购,以改善产品系列。
相关人员的主要利益
- 该报告提供了 2022 年至 2032 年纹理蛋白市场分析的细分市场、当前趋势、估计和趋势以及动态的定量分析,并确定了纹理蛋白市场的主要机会。
- 我们提供市场研究以及与市场驱动因素、市场限制和市场机会相关的资讯。
- 波特的五力分析强调买家和供应商帮助相关人员做出以利润为导向的商业决策并加强供应商-买家网路的潜力。
- 对纹理蛋白市场细分的详细分析有助于识别市场机会。
- 每个地区的主要国家都根据其对全球市场的收益贡献绘製了地图。
- 市场参与者定位有助于基准化分析,并提供对市场参与者当前位置的清晰了解。
- 该报告包括对区域和全球纹理蛋白市场趋势、主要企业、细分市场、应用领域和市场成长策略的分析。
可以使用此报告进行客製化(需要额外费用和时间表)
- 消费者购买行为分析
- 最终用户偏好和痛点
- 产品生命週期
- 按产品/细分市场细分
- 新产品开发/主要企业产品矩阵
- 根据客户兴趣新增其他公司简介
- 按国家或地区进行的附加分析 – 市场规模和预测
- 平均售价分析/价位分析
- 品牌占有率分析
- 十字交叉细分市场分析—市场规模与预测
- 公司简介的扩充列表
- 历史市场资料
- 导入/汇出分析/资料
- 主要参与者的详细资料(Excel格式,包括位置、联络资讯、供应商/供应商网路等)
目录
第一章简介
第 2 章执行摘要
第三章市场概况
- 市场定义和范围
- 主要发现
- 影响因素
- 主要投资机会
- 波特五力分析
- 市场动态
- 促进因素
- 抑制因素
- 机会
- 市场占有率分析
- 价值链分析
- 主要球员详细信息
第四章 组织蛋白市场:依应用分类
- 概述
- 肉类替代品
- 汤和炖菜
- 零嘴零食
- 连续剧
- 烘焙食品
- 其他的
第五章 组织蛋白市场:依形式
- 概述
- 片
- 薄片
- 颗粒
- 区块
第六章 组织蛋白市场:依产品类型
- 概述
- 大豆组织蛋白
- 组织化小麦蛋白
- 纹理豌豆蛋白
第七章 纹理蛋白市场:依地区
- 概述
- 北美洲
- 美国
- 加拿大
- 墨西哥
- 欧洲
- 西班牙
- 俄罗斯
- 德国
- 法国
- 荷兰
- 义大利
- 其他的
- 亚太地区
- 中国
- 印度
- 日本
- 印尼
- 韩国
- 其他亚太地区
- 拉丁美洲
- 巴西
- 阿根廷
- 其他拉丁美洲
- 中东/北非
- 沙乌地阿拉伯
- UAE
- 南非
- 其他的
第八章 竞争格局
- 介绍
- 关键成功策略
- 10家主要企业产品图谱
- 竞争对手仪表板
- 竞争热图
- 2022年主要企业定位
第九章 公司简介
- Cargill Incorporated
- ADM
- DuPont
- The Scoular Company
- beneo
- Axiom Foods Inc.
- Shandong Yuxin Biotechnology Co., Ltd
- MGP
- Kansas Protein Foods LLC
- Foodchem International Corporation
The global textured protein market was valued at $1.1 billion in 2022, and is projected to reach $2.7 billion by 2032, growing at a CAGR of 9.4% from 2023 to 2032.
Textured protein refers to processed plant-based or lab-grown protein products designed to mimic the taste, texture, and nutritional profile of meat. Common sources include soy, wheat, and pea protein. Through various techniques such as extrusion or fermentation, these proteins are transformed into products such as veggie burgers or meat substitutes for vegetarian and vegan diets.
The demand for textured protein in the market has significantly increased due to consumer preference for sustainable and ethical food choices. Many consumers now seek alternatives to meat that align with their values of sustainability and ethical treatment of animals. Textured protein, which is derived from plant sources, provides a meat-like experience without the associated environmental drawbacks or ethical concerns, making it an ideal solution to address these concerns.
Moreover, people have become more health conscious, which has led them to seek out plant-based protein options such as textured protein. This trend has resulted in food manufacturers investing in research and development to improve the taste, texture, and nutritional profile of textured protein products, further driving market growth. Consequently, the rise in consumer preference for sustainable and ethical food choices drives the demand for textured protein and reshapes the food industry toward more environmentally friendly and socially responsible practices.
In addition, innovation plays a vital role in driving demand for the textured protein market. Especially in the areas of flavoring and texturizing technologies, these advancements have enabled manufacturers to create products that closely resemble the taste and texture of meat, making them more appealing to consumers who are seeking alternatives. By improving the flavor profile and texture of textured protein products, companies attract a wider audience, including those who were hesitant to try plant-based options in the past.
Furthermore, innovation in these technologies has allowed the development of a diverse range of textured protein products that cater to various dietary preferences and cultural tastes. Whether it is creating juicy burger patties, savory meatballs, or tender chicken strips, the ability to replicate the sensory experience of meat without using animal products is a significant driver for market growth. As consumers become more discerning about their food choices and seek healthier, more sustainable options, the continued innovation in flavoring and texturizing technologies is likely to further fuel the expansion of the textured protein market.
Collaborating with celebrity chefs and influencers provide significant opportunities for the Textured Protein market. These individuals often have large followings and influence over consumer preferences and trends. By partnering with them, manufacturers of textured protein leverage their reach to promote their products to a wider audience. Celebrity chefs create innovative and appealing recipes using textured protein, showcasing its versatility and culinary potential. Their endorsement lend credibility and prestige to textured protein products, making them more desirable to consumers.
Moreover, influencers use their platforms to create engaging content around textured protein, sharing recipes, cooking tips, and personal experiences with their followers. This generate buzz and excitement around textured protein products, driving consumer interest and demand. In addition, collaborations with influencers provide valuable feedback and insights into consumer preferences, helping manufacturers tailor their products to better meet market needs. Overall, partnering with celebrity chefs and influencers increase the visibility, credibility, and consumer acceptance of textured protein, ultimately fueling market growth and expansion.
However, the textured protein market is facing a significant challenge due to the absence of regulatory clarity and standards. The lack of clear guidelines or standards established by regulatory authorities creates confusion and uncertainty around the production, labeling, and marketing of textured protein products. This discourage consumers from purchasing these products due to concerns about their safety, quality, and authenticity. In addition, the absence of standardized regulations make it difficult for food manufacturers to ensure compliance with varying requirements across different regions, leading to market fragmentation and inefficiencies.
Moreover, the lack of clear regulations also impede innovation and investment in the textured protein market. Companies are hesitant to develop new products or expand their operations without a clear understanding of the legal and regulatory landscape. This uncertainty also discourage potential investors from providing funding for research and development initiatives aimed at enhancing textured protein products. Ultimately, the lack of regulatory clarity or standards create barriers to market growth and hinder the widespread adoption of textured protein as a viable alternative to traditional meat products.
The textured protein market is segmented into product type, form, application, and region. By product type, the market is classified into textured soy protein (TSP), textured wheat protein (TWP), and textured pea protein (TPP). By form, the market is divided into slices, flakes, granules, and chunks. By application, the market is segregated into meat alternatives, meat extenders, soups and stews, snacks, cereals, bakery products, and others. By region, the market is analyzed across North America, Europe, Asia-Pacific, LA, and MEA.
Major players such as British Foods PLC, Bob's Red Mill Natural Foods, Ingredion Inc., Roquette Frere, and Vippy Industries Ltd have adopted product approval, partnership, agreement, and acquisition as key developmental strategies to improve the product portfolio of the textured protein market.
Key Benefits for Stakeholders
- This report provides a quantitative analysis of the market segments, current trends, estimations, and dynamics of the textured protein market analysis from 2022 to 2032 to identify the prevailing textured protein market opportunities.
- The market research is offered along with information related to key drivers, restraints, and opportunities.
- Porter's five forces analysis highlights the potency of buyers and suppliers to enable stakeholders make profit-oriented business decisions and strengthen their supplier-buyer network.
- In-depth analysis of the textured protein market segmentation assists to determine the prevailing market opportunities.
- Major countries in each region are mapped according to their revenue contribution to the global market.
- Market player positioning facilitates benchmarking and provides a clear understanding of the present position of the market players.
- The report includes the analysis of the regional as well as global textured protein market trends, key players, market segments, application areas, and market growth strategies.
Additional benefits you will get with this purchase are:
- Quarterly Update and* (only available with a corporate license, on listed price)
- 5 additional Company Profile of client Choice pre- or Post-purchase, as a free update.
- Free Upcoming Version on the Purchase of Five and Enterprise User License.
- 16 analyst hours of support* (post-purchase, if you find additional data requirements upon review of the report, you may receive support amounting to 16 analyst hours to solve questions, and post-sale queries)
- 15% Free Customization* (in case the scope or segment of the report does not match your requirements, 15% is equivalent to 3 working days of free work, applicable once)
- Free data Pack on the Five and Enterprise User License. (Excel version of the report)
- Free Updated report if the report is 6-12 months old or older.
- 24-hour priority response*
- Free Industry updates and white papers.
Possible Customization with this report (with additional cost and timeline, please talk to the sales executive to know more)
- Consumer Buying Behavior Analysis
- End user preferences and pain points
- Product Life Cycles
- Market share analysis of players by products/segments
- New Product Development/ Product Matrix of Key Players
- Additional company profiles with specific to client's interest
- Additional country or region analysis- market size and forecast
- Average Selling Price Analysis / Price Point Analysis
- Brands Share Analysis
- Criss-cross segment analysis- market size and forecast
- Expanded list for Company Profiles
- Historic market data
- Import Export Analysis/Data
- Key player details (including location, contact details, supplier/vendor network etc. in excel format)
Key Market Segments
By Application
- Meat alternatives
- Soups and stews
- Snacks
- Cereals
- Bakery products
- Others
By Form
- Slices
- Flakes
- Granules
- Chunks
By Product Type
- Textured Soy Protein
- Textured Wheat Protein
- Textured Pea Protein
By Region
- North America
- U.S.
- Canada
- Mexico
- Europe
- Spain
- Russia
- Germany
- France
- Netherlands
- Italy
- Rest of Europe
- Asia-Pacific
- China
- India
- Japan
- Indonesia
- South Korea
- Rest Of Asia Pacafic
- Latin America
- Brazil
- Argentina
- Rest of LAMEA
- Middle East and North Africa
- Saudi Arabia
- UAE
- South Africa
- Rest Of Mea
Key Market Players:
- Cargill Incorporated
- ADM
- DuPont
- The Scoular Company
- beneo
- Axiom Foods Inc.
- Shandong Yuxin Biotechnology Co., Ltd
- MGP
- Kansas Protein Foods LLC
- Foodchem International Corporation
TABLE OF CONTENTS
CHAPTER 1: INTRODUCTION
- 1.1. Report description
- 1.2. Key market segments
- 1.3. Key benefits to the stakeholders
- 1.4. Research methodology
- 1.4.1. Primary research
- 1.4.2. Secondary research
- 1.4.3. Analyst tools and models
CHAPTER 2: EXECUTIVE SUMMARY
- 2.1. CXO perspective
CHAPTER 3: MARKET OVERVIEW
- 3.1. Market definition and scope
- 3.2. Key findings
- 3.2.1. Top impacting factors
- 3.2.2. Top investment pockets
- 3.3. Porter's five forces analysis
- 3.4. Market dynamics
- 3.4.1. Drivers
- 3.4.2. Restraints
- 3.4.3. Opportunities
- 3.5. Market Share Analysis
- 3.6. Value Chain Analysis
- 3.7. Key Players Details
CHAPTER 4: TEXTURED PROTEIN MARKET, BY APPLICATION
- 4.1. Overview
- 4.1.1. Market size and forecast
- 4.2. Meat alternatives
- 4.2.1. Key market trends, growth factors and opportunities
- 4.2.2. Market size and forecast, by region
- 4.2.3. Market share analysis by country
- 4.3. Soups and stews
- 4.3.1. Key market trends, growth factors and opportunities
- 4.3.2. Market size and forecast, by region
- 4.3.3. Market share analysis by country
- 4.4. Snacks
- 4.4.1. Key market trends, growth factors and opportunities
- 4.4.2. Market size and forecast, by region
- 4.4.3. Market share analysis by country
- 4.5. Cereals
- 4.5.1. Key market trends, growth factors and opportunities
- 4.5.2. Market size and forecast, by region
- 4.5.3. Market share analysis by country
- 4.6. Bakery products
- 4.6.1. Key market trends, growth factors and opportunities
- 4.6.2. Market size and forecast, by region
- 4.6.3. Market share analysis by country
- 4.7. Others
- 4.7.1. Key market trends, growth factors and opportunities
- 4.7.2. Market size and forecast, by region
- 4.7.3. Market share analysis by country
CHAPTER 5: TEXTURED PROTEIN MARKET, BY FORM
- 5.1. Overview
- 5.1.1. Market size and forecast
- 5.2. Slices
- 5.2.1. Key market trends, growth factors and opportunities
- 5.2.2. Market size and forecast, by region
- 5.2.3. Market share analysis by country
- 5.3. Flakes
- 5.3.1. Key market trends, growth factors and opportunities
- 5.3.2. Market size and forecast, by region
- 5.3.3. Market share analysis by country
- 5.4. Granules
- 5.4.1. Key market trends, growth factors and opportunities
- 5.4.2. Market size and forecast, by region
- 5.4.3. Market share analysis by country
- 5.5. Chunks
- 5.5.1. Key market trends, growth factors and opportunities
- 5.5.2. Market size and forecast, by region
- 5.5.3. Market share analysis by country
CHAPTER 6: TEXTURED PROTEIN MARKET, BY PRODUCT TYPE
- 6.1. Overview
- 6.1.1. Market size and forecast
- 6.2. Textured Soy Protein
- 6.2.1. Key market trends, growth factors and opportunities
- 6.2.2. Market size and forecast, by region
- 6.2.3. Market share analysis by country
- 6.3. Textured Wheat Protein
- 6.3.1. Key market trends, growth factors and opportunities
- 6.3.2. Market size and forecast, by region
- 6.3.3. Market share analysis by country
- 6.4. Textured Pea Protein
- 6.4.1. Key market trends, growth factors and opportunities
- 6.4.2. Market size and forecast, by region
- 6.4.3. Market share analysis by country
CHAPTER 7: TEXTURED PROTEIN MARKET, BY REGION
- 7.1. Overview
- 7.1.1. Market size and forecast By Region
- 7.2. North America
- 7.2.1. Key market trends, growth factors and opportunities
- 7.2.2. Market size and forecast, by Application
- 7.2.3. Market size and forecast, by Form
- 7.2.4. Market size and forecast, by Product Type
- 7.2.5. Market size and forecast, by country
- 7.2.5.1. U.S.
- 7.2.5.1.1. Market size and forecast, by Application
- 7.2.5.1.2. Market size and forecast, by Form
- 7.2.5.1.3. Market size and forecast, by Product Type
- 7.2.5.2. Canada
- 7.2.5.2.1. Market size and forecast, by Application
- 7.2.5.2.2. Market size and forecast, by Form
- 7.2.5.2.3. Market size and forecast, by Product Type
- 7.2.5.3. Mexico
- 7.2.5.3.1. Market size and forecast, by Application
- 7.2.5.3.2. Market size and forecast, by Form
- 7.2.5.3.3. Market size and forecast, by Product Type
- 7.3. Europe
- 7.3.1. Key market trends, growth factors and opportunities
- 7.3.2. Market size and forecast, by Application
- 7.3.3. Market size and forecast, by Form
- 7.3.4. Market size and forecast, by Product Type
- 7.3.5. Market size and forecast, by country
- 7.3.5.1. Spain
- 7.3.5.1.1. Market size and forecast, by Application
- 7.3.5.1.2. Market size and forecast, by Form
- 7.3.5.1.3. Market size and forecast, by Product Type
- 7.3.5.2. Russia
- 7.3.5.2.1. Market size and forecast, by Application
- 7.3.5.2.2. Market size and forecast, by Form
- 7.3.5.2.3. Market size and forecast, by Product Type
- 7.3.5.3. Germany
- 7.3.5.3.1. Market size and forecast, by Application
- 7.3.5.3.2. Market size and forecast, by Form
- 7.3.5.3.3. Market size and forecast, by Product Type
- 7.3.5.4. France
- 7.3.5.4.1. Market size and forecast, by Application
- 7.3.5.4.2. Market size and forecast, by Form
- 7.3.5.4.3. Market size and forecast, by Product Type
- 7.3.5.5. Netherlands
- 7.3.5.5.1. Market size and forecast, by Application
- 7.3.5.5.2. Market size and forecast, by Form
- 7.3.5.5.3. Market size and forecast, by Product Type
- 7.3.5.6. Italy
- 7.3.5.6.1. Market size and forecast, by Application
- 7.3.5.6.2. Market size and forecast, by Form
- 7.3.5.6.3. Market size and forecast, by Product Type
- 7.3.5.7. Rest of Europe
- 7.3.5.7.1. Market size and forecast, by Application
- 7.3.5.7.2. Market size and forecast, by Form
- 7.3.5.7.3. Market size and forecast, by Product Type
- 7.4. Asia-Pacific
- 7.4.1. Key market trends, growth factors and opportunities
- 7.4.2. Market size and forecast, by Application
- 7.4.3. Market size and forecast, by Form
- 7.4.4. Market size and forecast, by Product Type
- 7.4.5. Market size and forecast, by country
- 7.4.5.1. China
- 7.4.5.1.1. Market size and forecast, by Application
- 7.4.5.1.2. Market size and forecast, by Form
- 7.4.5.1.3. Market size and forecast, by Product Type
- 7.4.5.2. India
- 7.4.5.2.1. Market size and forecast, by Application
- 7.4.5.2.2. Market size and forecast, by Form
- 7.4.5.2.3. Market size and forecast, by Product Type
- 7.4.5.3. Japan
- 7.4.5.3.1. Market size and forecast, by Application
- 7.4.5.3.2. Market size and forecast, by Form
- 7.4.5.3.3. Market size and forecast, by Product Type
- 7.4.5.4. Indonesia
- 7.4.5.4.1. Market size and forecast, by Application
- 7.4.5.4.2. Market size and forecast, by Form
- 7.4.5.4.3. Market size and forecast, by Product Type
- 7.4.5.5. South Korea
- 7.4.5.5.1. Market size and forecast, by Application
- 7.4.5.5.2. Market size and forecast, by Form
- 7.4.5.5.3. Market size and forecast, by Product Type
- 7.4.5.6. Rest Of Asia Pacafic
- 7.4.5.6.1. Market size and forecast, by Application
- 7.4.5.6.2. Market size and forecast, by Form
- 7.4.5.6.3. Market size and forecast, by Product Type
- 7.5. Latin America
- 7.5.1. Key market trends, growth factors and opportunities
- 7.5.2. Market size and forecast, by Application
- 7.5.3. Market size and forecast, by Form
- 7.5.4. Market size and forecast, by Product Type
- 7.5.5. Market size and forecast, by country
- 7.5.5.1. Brazil
- 7.5.5.1.1. Market size and forecast, by Application
- 7.5.5.1.2. Market size and forecast, by Form
- 7.5.5.1.3. Market size and forecast, by Product Type
- 7.5.5.2. Argentina
- 7.5.5.2.1. Market size and forecast, by Application
- 7.5.5.2.2. Market size and forecast, by Form
- 7.5.5.2.3. Market size and forecast, by Product Type
- 7.5.5.3. Rest of LAMEA
- 7.5.5.3.1. Market size and forecast, by Application
- 7.5.5.3.2. Market size and forecast, by Form
- 7.5.5.3.3. Market size and forecast, by Product Type
- 7.6. Middle East and North Africa
- 7.6.1. Key market trends, growth factors and opportunities
- 7.6.2. Market size and forecast, by Application
- 7.6.3. Market size and forecast, by Form
- 7.6.4. Market size and forecast, by Product Type
- 7.6.5. Market size and forecast, by country
- 7.6.5.1. Saudi Arabia
- 7.6.5.1.1. Market size and forecast, by Application
- 7.6.5.1.2. Market size and forecast, by Form
- 7.6.5.1.3. Market size and forecast, by Product Type
- 7.6.5.2. UAE
- 7.6.5.2.1. Market size and forecast, by Application
- 7.6.5.2.2. Market size and forecast, by Form
- 7.6.5.2.3. Market size and forecast, by Product Type
- 7.6.5.3. South Africa
- 7.6.5.3.1. Market size and forecast, by Application
- 7.6.5.3.2. Market size and forecast, by Form
- 7.6.5.3.3. Market size and forecast, by Product Type
- 7.6.5.4. Rest Of Mea
- 7.6.5.4.1. Market size and forecast, by Application
- 7.6.5.4.2. Market size and forecast, by Form
- 7.6.5.4.3. Market size and forecast, by Product Type
CHAPTER 8: COMPETITIVE LANDSCAPE
- 8.1. Introduction
- 8.2. Top winning strategies
- 8.3. Product mapping of top 10 player
- 8.4. Competitive dashboard
- 8.5. Competitive heatmap
- 8.6. Top player positioning, 2022
CHAPTER 9: COMPANY PROFILES
- 9.1. Cargill Incorporated
- 9.1.1. Company overview
- 9.1.2. Key executives
- 9.1.3. Company snapshot
- 9.1.4. Operating business segments
- 9.1.5. Product portfolio
- 9.1.6. Business performance
- 9.1.7. Key strategic moves and developments
- 9.2. ADM
- 9.2.1. Company overview
- 9.2.2. Key executives
- 9.2.3. Company snapshot
- 9.2.4. Operating business segments
- 9.2.5. Product portfolio
- 9.2.6. Business performance
- 9.2.7. Key strategic moves and developments
- 9.3. DuPont
- 9.3.1. Company overview
- 9.3.2. Key executives
- 9.3.3. Company snapshot
- 9.3.4. Operating business segments
- 9.3.5. Product portfolio
- 9.3.6. Business performance
- 9.3.7. Key strategic moves and developments
- 9.4. The Scoular Company
- 9.4.1. Company overview
- 9.4.2. Key executives
- 9.4.3. Company snapshot
- 9.4.4. Operating business segments
- 9.4.5. Product portfolio
- 9.4.6. Business performance
- 9.4.7. Key strategic moves and developments
- 9.5. beneo
- 9.5.1. Company overview
- 9.5.2. Key executives
- 9.5.3. Company snapshot
- 9.5.4. Operating business segments
- 9.5.5. Product portfolio
- 9.5.6. Business performance
- 9.5.7. Key strategic moves and developments
- 9.6. Axiom Foods Inc.
- 9.6.1. Company overview
- 9.6.2. Key executives
- 9.6.3. Company snapshot
- 9.6.4. Operating business segments
- 9.6.5. Product portfolio
- 9.6.6. Business performance
- 9.6.7. Key strategic moves and developments
- 9.7. Shandong Yuxin Biotechnology Co., Ltd
- 9.7.1. Company overview
- 9.7.2. Key executives
- 9.7.3. Company snapshot
- 9.7.4. Operating business segments
- 9.7.5. Product portfolio
- 9.7.6. Business performance
- 9.7.7. Key strategic moves and developments
- 9.8. MGP
- 9.8.1. Company overview
- 9.8.2. Key executives
- 9.8.3. Company snapshot
- 9.8.4. Operating business segments
- 9.8.5. Product portfolio
- 9.8.6. Business performance
- 9.8.7. Key strategic moves and developments
- 9.9. Kansas Protein Foods LLC
- 9.9.1. Company overview
- 9.9.2. Key executives
- 9.9.3. Company snapshot
- 9.9.4. Operating business segments
- 9.9.5. Product portfolio
- 9.9.6. Business performance
- 9.9.7. Key strategic moves and developments
- 9.10. Foodchem International Corporation
- 9.10.1. Company overview
- 9.10.2. Key executives
- 9.10.3. Company snapshot
- 9.10.4. Operating business segments
- 9.10.5. Product portfolio
- 9.10.6. Business performance
- 9.10.7. Key strategic moves and developments
LIST OF TABLES
- TABLE 01. GLOBAL TEXTURED PROTEIN MARKET, BY APPLICATION, 2022-2032 ($MILLION)
- TABLE 02. TEXTURED PROTEIN MARKET FOR MEAT ALTERNATIVES, BY REGION, 2022-2032 ($MILLION)
- TABLE 03. TEXTURED PROTEIN MARKET FOR SOUPS AND STEWS, BY REGION, 2022-2032 ($MILLION)
- TABLE 04. TEXTURED PROTEIN MARKET FOR SNACKS, BY REGION, 2022-2032 ($MILLION)
- TABLE 05. TEXTURED PROTEIN MARKET FOR CEREALS, BY REGION, 2022-2032 ($MILLION)
- TABLE 06. TEXTURED PROTEIN MARKET FOR BAKERY PRODUCTS, BY REGION, 2022-2032 ($MILLION)
- TABLE 07. TEXTURED PROTEIN MARKET FOR OTHERS, BY REGION, 2022-2032 ($MILLION)
- TABLE 08. GLOBAL TEXTURED PROTEIN MARKET, BY FORM, 2022-2032 ($MILLION)
- TABLE 09. TEXTURED PROTEIN MARKET FOR SLICES, BY REGION, 2022-2032 ($MILLION)
- TABLE 10. TEXTURED PROTEIN MARKET FOR FLAKES, BY REGION, 2022-2032 ($MILLION)
- TABLE 11. TEXTURED PROTEIN MARKET FOR GRANULES, BY REGION, 2022-2032 ($MILLION)
- TABLE 12. TEXTURED PROTEIN MARKET FOR CHUNKS, BY REGION, 2022-2032 ($MILLION)
- TABLE 13. GLOBAL TEXTURED PROTEIN MARKET, BY PRODUCT TYPE, 2022-2032 ($MILLION)
- TABLE 14. TEXTURED PROTEIN MARKET FOR TEXTURED SOY PROTEIN, BY REGION, 2022-2032 ($MILLION)
- TABLE 15. TEXTURED PROTEIN MARKET FOR TEXTURED WHEAT PROTEIN, BY REGION, 2022-2032 ($MILLION)
- TABLE 16. TEXTURED PROTEIN MARKET FOR TEXTURED PEA PROTEIN, BY REGION, 2022-2032 ($MILLION)
- TABLE 17. TEXTURED PROTEIN MARKET, BY REGION, 2022-2032 ($MILLION)
- TABLE 18. NORTH AMERICA TEXTURED PROTEIN MARKET, BY APPLICATION, 2022-2032 ($MILLION)
- TABLE 19. NORTH AMERICA TEXTURED PROTEIN MARKET, BY FORM, 2022-2032 ($MILLION)
- TABLE 20. NORTH AMERICA TEXTURED PROTEIN MARKET, BY PRODUCT TYPE, 2022-2032 ($MILLION)
- TABLE 21. NORTH AMERICA TEXTURED PROTEIN MARKET, BY COUNTRY, 2022-2032 ($MILLION)
- TABLE 22. U.S. TEXTURED PROTEIN MARKET, BY APPLICATION, 2022-2032 ($MILLION)
- TABLE 23. U.S. TEXTURED PROTEIN MARKET, BY FORM, 2022-2032 ($MILLION)
- TABLE 24. U.S. TEXTURED PROTEIN MARKET, BY PRODUCT TYPE, 2022-2032 ($MILLION)
- TABLE 25. CANADA TEXTURED PROTEIN MARKET, BY APPLICATION, 2022-2032 ($MILLION)
- TABLE 26. CANADA TEXTURED PROTEIN MARKET, BY FORM, 2022-2032 ($MILLION)
- TABLE 27. CANADA TEXTURED PROTEIN MARKET, BY PRODUCT TYPE, 2022-2032 ($MILLION)
- TABLE 28. MEXICO TEXTURED PROTEIN MARKET, BY APPLICATION, 2022-2032 ($MILLION)
- TABLE 29. MEXICO TEXTURED PROTEIN MARKET, BY FORM, 2022-2032 ($MILLION)
- TABLE 30. MEXICO TEXTURED PROTEIN MARKET, BY PRODUCT TYPE, 2022-2032 ($MILLION)
- TABLE 31. EUROPE TEXTURED PROTEIN MARKET, BY APPLICATION, 2022-2032 ($MILLION)
- TABLE 32. EUROPE TEXTURED PROTEIN MARKET, BY FORM, 2022-2032 ($MILLION)
- TABLE 33. EUROPE TEXTURED PROTEIN MARKET, BY PRODUCT TYPE, 2022-2032 ($MILLION)
- TABLE 34. EUROPE TEXTURED PROTEIN MARKET, BY COUNTRY, 2022-2032 ($MILLION)
- TABLE 35. SPAIN TEXTURED PROTEIN MARKET, BY APPLICATION, 2022-2032 ($MILLION)
- TABLE 36. SPAIN TEXTURED PROTEIN MARKET, BY FORM, 2022-2032 ($MILLION)
- TABLE 37. SPAIN TEXTURED PROTEIN MARKET, BY PRODUCT TYPE, 2022-2032 ($MILLION)
- TABLE 38. RUSSIA TEXTURED PROTEIN MARKET, BY APPLICATION, 2022-2032 ($MILLION)
- TABLE 39. RUSSIA TEXTURED PROTEIN MARKET, BY FORM, 2022-2032 ($MILLION)
- TABLE 40. RUSSIA TEXTURED PROTEIN MARKET, BY PRODUCT TYPE, 2022-2032 ($MILLION)
- TABLE 41. GERMANY TEXTURED PROTEIN MARKET, BY APPLICATION, 2022-2032 ($MILLION)
- TABLE 42. GERMANY TEXTURED PROTEIN MARKET, BY FORM, 2022-2032 ($MILLION)
- TABLE 43. GERMANY TEXTURED PROTEIN MARKET, BY PRODUCT TYPE, 2022-2032 ($MILLION)
- TABLE 44. FRANCE TEXTURED PROTEIN MARKET, BY APPLICATION, 2022-2032 ($MILLION)
- TABLE 45. FRANCE TEXTURED PROTEIN MARKET, BY FORM, 2022-2032 ($MILLION)
- TABLE 46. FRANCE TEXTURED PROTEIN MARKET, BY PRODUCT TYPE, 2022-2032 ($MILLION)
- TABLE 47. NETHERLANDS TEXTURED PROTEIN MARKET, BY APPLICATION, 2022-2032 ($MILLION)
- TABLE 48. NETHERLANDS TEXTURED PROTEIN MARKET, BY FORM, 2022-2032 ($MILLION)
- TABLE 49. NETHERLANDS TEXTURED PROTEIN MARKET, BY PRODUCT TYPE, 2022-2032 ($MILLION)
- TABLE 50. ITALY TEXTURED PROTEIN MARKET, BY APPLICATION, 2022-2032 ($MILLION)
- TABLE 51. ITALY TEXTURED PROTEIN MARKET, BY FORM, 2022-2032 ($MILLION)
- TABLE 52. ITALY TEXTURED PROTEIN MARKET, BY PRODUCT TYPE, 2022-2032 ($MILLION)
- TABLE 53. REST OF EUROPE TEXTURED PROTEIN MARKET, BY APPLICATION, 2022-2032 ($MILLION)
- TABLE 54. REST OF EUROPE TEXTURED PROTEIN MARKET, BY FORM, 2022-2032 ($MILLION)
- TABLE 55. REST OF EUROPE TEXTURED PROTEIN MARKET, BY PRODUCT TYPE, 2022-2032 ($MILLION)
- TABLE 56. ASIA-PACIFIC TEXTURED PROTEIN MARKET, BY APPLICATION, 2022-2032 ($MILLION)
- TABLE 57. ASIA-PACIFIC TEXTURED PROTEIN MARKET, BY FORM, 2022-2032 ($MILLION)
- TABLE 58. ASIA-PACIFIC TEXTURED PROTEIN MARKET, BY PRODUCT TYPE, 2022-2032 ($MILLION)
- TABLE 59. ASIA-PACIFIC TEXTURED PROTEIN MARKET, BY COUNTRY, 2022-2032 ($MILLION)
- TABLE 60. CHINA TEXTURED PROTEIN MARKET, BY APPLICATION, 2022-2032 ($MILLION)
- TABLE 61. CHINA TEXTURED PROTEIN MARKET, BY FORM, 2022-2032 ($MILLION)
- TABLE 62. CHINA TEXTURED PROTEIN MARKET, BY PRODUCT TYPE, 2022-2032 ($MILLION)
- TABLE 63. INDIA TEXTURED PROTEIN MARKET, BY APPLICATION, 2022-2032 ($MILLION)
- TABLE 64. INDIA TEXTURED PROTEIN MARKET, BY FORM, 2022-2032 ($MILLION)
- TABLE 65. INDIA TEXTURED PROTEIN MARKET, BY PRODUCT TYPE, 2022-2032 ($MILLION)
- TABLE 66. JAPAN TEXTURED PROTEIN MARKET, BY APPLICATION, 2022-2032 ($MILLION)
- TABLE 67. JAPAN TEXTURED PROTEIN MARKET, BY FORM, 2022-2032 ($MILLION)
- TABLE 68. JAPAN TEXTURED PROTEIN MARKET, BY PRODUCT TYPE, 2022-2032 ($MILLION)
- TABLE 69. INDONESIA TEXTURED PROTEIN MARKET, BY APPLICATION, 2022-2032 ($MILLION)
- TABLE 70. INDONESIA TEXTURED PROTEIN MARKET, BY FORM, 2022-2032 ($MILLION)
- TABLE 71. INDONESIA TEXTURED PROTEIN MARKET, BY PRODUCT TYPE, 2022-2032 ($MILLION)
- TABLE 72. SOUTH KOREA TEXTURED PROTEIN MARKET, BY APPLICATION, 2022-2032 ($MILLION)
- TABLE 73. SOUTH KOREA TEXTURED PROTEIN MARKET, BY FORM, 2022-2032 ($MILLION)
- TABLE 74. SOUTH KOREA TEXTURED PROTEIN MARKET, BY PRODUCT TYPE, 2022-2032 ($MILLION)
- TABLE 75. REST OF ASIA PACAFIC TEXTURED PROTEIN MARKET, BY APPLICATION, 2022-2032 ($MILLION)
- TABLE 76. REST OF ASIA PACAFIC TEXTURED PROTEIN MARKET, BY FORM, 2022-2032 ($MILLION)
- TABLE 77. REST OF ASIA PACAFIC TEXTURED PROTEIN MARKET, BY PRODUCT TYPE, 2022-2032 ($MILLION)
- TABLE 78. LATIN AMERICA TEXTURED PROTEIN MARKET, BY APPLICATION, 2022-2032 ($MILLION)
- TABLE 79. LATIN AMERICA TEXTURED PROTEIN MARKET, BY FORM, 2022-2032 ($MILLION)
- TABLE 80. LATIN AMERICA TEXTURED PROTEIN MARKET, BY PRODUCT TYPE, 2022-2032 ($MILLION)
- TABLE 81. LATIN AMERICA TEXTURED PROTEIN MARKET, BY COUNTRY, 2022-2032 ($MILLION)
- TABLE 82. BRAZIL TEXTURED PROTEIN MARKET, BY APPLICATION, 2022-2032 ($MILLION)
- TABLE 83. BRAZIL TEXTURED PROTEIN MARKET, BY FORM, 2022-2032 ($MILLION)
- TABLE 84. BRAZIL TEXTURED PROTEIN MARKET, BY PRODUCT TYPE, 2022-2032 ($MILLION)
- TABLE 85. ARGENTINA TEXTURED PROTEIN MARKET, BY APPLICATION, 2022-2032 ($MILLION)
- TABLE 86. ARGENTINA TEXTURED PROTEIN MARKET, BY FORM, 2022-2032 ($MILLION)
- TABLE 87. ARGENTINA TEXTURED PROTEIN MARKET, BY PRODUCT TYPE, 2022-2032 ($MILLION)
- TABLE 88. REST OF LAMEA TEXTURED PROTEIN MARKET, BY APPLICATION, 2022-2032 ($MILLION)
- TABLE 89. REST OF LAMEA TEXTURED PROTEIN MARKET, BY FORM, 2022-2032 ($MILLION)
- TABLE 90. REST OF LAMEA TEXTURED PROTEIN MARKET, BY PRODUCT TYPE, 2022-2032 ($MILLION)
- TABLE 91. MIDDLE EAST AND NORTH AFRICA TEXTURED PROTEIN MARKET, BY APPLICATION, 2022-2032 ($MILLION)
- TABLE 92. MIDDLE EAST AND NORTH AFRICA TEXTURED PROTEIN MARKET, BY FORM, 2022-2032 ($MILLION)
- TABLE 93. MIDDLE EAST AND NORTH AFRICA TEXTURED PROTEIN MARKET, BY PRODUCT TYPE, 2022-2032 ($MILLION)
- TABLE 94. MIDDLE EAST AND NORTH AFRICA TEXTURED PROTEIN MARKET, BY COUNTRY, 2022-2032 ($MILLION)
- TABLE 95. SAUDI ARABIA TEXTURED PROTEIN MARKET, BY APPLICATION, 2022-2032 ($MILLION)
- TABLE 96. SAUDI ARABIA TEXTURED PROTEIN MARKET, BY FORM, 2022-2032 ($MILLION)
- TABLE 97. SAUDI ARABIA TEXTURED PROTEIN MARKET, BY PRODUCT TYPE, 2022-2032 ($MILLION)
- TABLE 98. UAE TEXTURED PROTEIN MARKET, BY APPLICATION, 2022-2032 ($MILLION)
- TABLE 99. UAE TEXTURED PROTEIN MARKET, BY FORM, 2022-2032 ($MILLION)
- TABLE 100. UAE TEXTURED PROTEIN MARKET, BY PRODUCT TYPE, 2022-2032 ($MILLION)
- TABLE 101. SOUTH AFRICA TEXTURED PROTEIN MARKET, BY APPLICATION, 2022-2032 ($MILLION)
- TABLE 102. SOUTH AFRICA TEXTURED PROTEIN MARKET, BY FORM, 2022-2032 ($MILLION)
- TABLE 103. SOUTH AFRICA TEXTURED PROTEIN MARKET, BY PRODUCT TYPE, 2022-2032 ($MILLION)
- TABLE 104. REST OF MEA TEXTURED PROTEIN MARKET, BY APPLICATION, 2022-2032 ($MILLION)
- TABLE 105. REST OF MEA TEXTURED PROTEIN MARKET, BY FORM, 2022-2032 ($MILLION)
- TABLE 106. REST OF MEA TEXTURED PROTEIN MARKET, BY PRODUCT TYPE, 2022-2032 ($MILLION)
- TABLE 107. CARGILL INCORPORATED: KEY EXECUTIVES
- TABLE 108. CARGILL INCORPORATED: COMPANY SNAPSHOT
- TABLE 109. CARGILL INCORPORATED: PRODUCT SEGMENTS
- TABLE 110. CARGILL INCORPORATED: SERVICE SEGMENTS
- TABLE 111. CARGILL INCORPORATED: PRODUCT PORTFOLIO
- TABLE 112. CARGILL INCORPORATED: KEY STRATERGIES
- TABLE 113. ADM: KEY EXECUTIVES
- TABLE 114. ADM: COMPANY SNAPSHOT
- TABLE 115. ADM: PRODUCT SEGMENTS
- TABLE 116. ADM: SERVICE SEGMENTS
- TABLE 117. ADM: PRODUCT PORTFOLIO
- TABLE 118. ADM: KEY STRATERGIES
- TABLE 119. DUPONT: KEY EXECUTIVES
- TABLE 120. DUPONT: COMPANY SNAPSHOT
- TABLE 121. DUPONT: PRODUCT SEGMENTS
- TABLE 122. DUPONT: SERVICE SEGMENTS
- TABLE 123. DUPONT: PRODUCT PORTFOLIO
- TABLE 124. DUPONT: KEY STRATERGIES
- TABLE 125. THE SCOULAR COMPANY: KEY EXECUTIVES
- TABLE 126. THE SCOULAR COMPANY: COMPANY SNAPSHOT
- TABLE 127. THE SCOULAR COMPANY: PRODUCT SEGMENTS
- TABLE 128. THE SCOULAR COMPANY: SERVICE SEGMENTS
- TABLE 129. THE SCOULAR COMPANY: PRODUCT PORTFOLIO
- TABLE 130. THE SCOULAR COMPANY: KEY STRATERGIES
- TABLE 131. BENEO: KEY EXECUTIVES
- TABLE 132. BENEO: COMPANY SNAPSHOT
- TABLE 133. BENEO: PRODUCT SEGMENTS
- TABLE 134. BENEO: SERVICE SEGMENTS
- TABLE 135. BENEO: PRODUCT PORTFOLIO
- TABLE 136. BENEO: KEY STRATERGIES
- TABLE 137. AXIOM FOODS INC.: KEY EXECUTIVES
- TABLE 138. AXIOM FOODS INC.: COMPANY SNAPSHOT
- TABLE 139. AXIOM FOODS INC.: PRODUCT SEGMENTS
- TABLE 140. AXIOM FOODS INC.: SERVICE SEGMENTS
- TABLE 141. AXIOM FOODS INC.: PRODUCT PORTFOLIO
- TABLE 142. AXIOM FOODS INC.: KEY STRATERGIES
- TABLE 143. SHANDONG YUXIN BIOTECHNOLOGY CO., LTD: KEY EXECUTIVES
- TABLE 144. SHANDONG YUXIN BIOTECHNOLOGY CO., LTD: COMPANY SNAPSHOT
- TABLE 145. SHANDONG YUXIN BIOTECHNOLOGY CO., LTD: PRODUCT SEGMENTS
- TABLE 146. SHANDONG YUXIN BIOTECHNOLOGY CO., LTD: SERVICE SEGMENTS
- TABLE 147. SHANDONG YUXIN BIOTECHNOLOGY CO., LTD: PRODUCT PORTFOLIO
- TABLE 148. SHANDONG YUXIN BIOTECHNOLOGY CO., LTD: KEY STRATERGIES
- TABLE 149. MGP: KEY EXECUTIVES
- TABLE 150. MGP: COMPANY SNAPSHOT
- TABLE 151. MGP: PRODUCT SEGMENTS
- TABLE 152. MGP: SERVICE SEGMENTS
- TABLE 153. MGP: PRODUCT PORTFOLIO
- TABLE 154. MGP: KEY STRATERGIES
- TABLE 155. KANSAS PROTEIN FOODS LLC: KEY EXECUTIVES
- TABLE 156. KANSAS PROTEIN FOODS LLC: COMPANY SNAPSHOT
- TABLE 157. KANSAS PROTEIN FOODS LLC: PRODUCT SEGMENTS
- TABLE 158. KANSAS PROTEIN FOODS LLC: SERVICE SEGMENTS
- TABLE 159. KANSAS PROTEIN FOODS LLC: PRODUCT PORTFOLIO
- TABLE 160. KANSAS PROTEIN FOODS LLC: KEY STRATERGIES
- TABLE 161. FOODCHEM INTERNATIONAL CORPORATION: KEY EXECUTIVES
- TABLE 162. FOODCHEM INTERNATIONAL CORPORATION: COMPANY SNAPSHOT
- TABLE 163. FOODCHEM INTERNATIONAL CORPORATION: PRODUCT SEGMENTS
- TABLE 164. FOODCHEM INTERNATIONAL CORPORATION: SERVICE SEGMENTS
- TABLE 165. FOODCHEM INTERNATIONAL CORPORATION: PRODUCT PORTFOLIO
- TABLE 166. FOODCHEM INTERNATIONAL CORPORATION: KEY STRATERGIES
LIST OF FIGURES
- FIGURE 01. TEXTURED PROTEIN MARKET, 2022-2032
- FIGURE 02. SEGMENTATION OF TEXTURED PROTEIN MARKET,2022-2032
- FIGURE 03. TOP IMPACTING FACTORS IN TEXTURED PROTEIN MARKET
- FIGURE 04. TOP INVESTMENT POCKETS IN TEXTURED PROTEIN MARKET (2023-2032)
- FIGURE 05. BARGAINING POWER OF SUPPLIERS
- FIGURE 06. BARGAINING POWER OF BUYERS
- FIGURE 07. THREAT OF SUBSTITUTION
- FIGURE 08. THREAT OF SUBSTITUTION
- FIGURE 09. COMPETITIVE RIVALRY
- FIGURE 10. GLOBAL TEXTURED PROTEIN MARKET:DRIVERS, RESTRAINTS AND OPPORTUNITIES
- FIGURE 11. TEXTURED PROTEIN MARKET, BY APPLICATION, 2022 AND 2032(%)
- FIGURE 12. COMPARATIVE SHARE ANALYSIS OF TEXTURED PROTEIN MARKET FOR MEAT ALTERNATIVES, BY COUNTRY 2022 AND 2032(%)
- FIGURE 13. COMPARATIVE SHARE ANALYSIS OF TEXTURED PROTEIN MARKET FOR SOUPS AND STEWS, BY COUNTRY 2022 AND 2032(%)
- FIGURE 14. COMPARATIVE SHARE ANALYSIS OF TEXTURED PROTEIN MARKET FOR SNACKS, BY COUNTRY 2022 AND 2032(%)
- FIGURE 15. COMPARATIVE SHARE ANALYSIS OF TEXTURED PROTEIN MARKET FOR CEREALS, BY COUNTRY 2022 AND 2032(%)
- FIGURE 16. COMPARATIVE SHARE ANALYSIS OF TEXTURED PROTEIN MARKET FOR BAKERY PRODUCTS, BY COUNTRY 2022 AND 2032(%)
- FIGURE 17. COMPARATIVE SHARE ANALYSIS OF TEXTURED PROTEIN MARKET FOR OTHERS, BY COUNTRY 2022 AND 2032(%)
- FIGURE 18. TEXTURED PROTEIN MARKET, BY FORM, 2022 AND 2032(%)
- FIGURE 19. COMPARATIVE SHARE ANALYSIS OF TEXTURED PROTEIN MARKET FOR SLICES, BY COUNTRY 2022 AND 2032(%)
- FIGURE 20. COMPARATIVE SHARE ANALYSIS OF TEXTURED PROTEIN MARKET FOR FLAKES, BY COUNTRY 2022 AND 2032(%)
- FIGURE 21. COMPARATIVE SHARE ANALYSIS OF TEXTURED PROTEIN MARKET FOR GRANULES, BY COUNTRY 2022 AND 2032(%)
- FIGURE 22. COMPARATIVE SHARE ANALYSIS OF TEXTURED PROTEIN MARKET FOR CHUNKS, BY COUNTRY 2022 AND 2032(%)
- FIGURE 23. TEXTURED PROTEIN MARKET, BY PRODUCT TYPE, 2022 AND 2032(%)
- FIGURE 24. COMPARATIVE SHARE ANALYSIS OF TEXTURED PROTEIN MARKET FOR TEXTURED SOY PROTEIN, BY COUNTRY 2022 AND 2032(%)
- FIGURE 25. COMPARATIVE SHARE ANALYSIS OF TEXTURED PROTEIN MARKET FOR TEXTURED WHEAT PROTEIN, BY COUNTRY 2022 AND 2032(%)
- FIGURE 26. COMPARATIVE SHARE ANALYSIS OF TEXTURED PROTEIN MARKET FOR TEXTURED PEA PROTEIN, BY COUNTRY 2022 AND 2032(%)
- FIGURE 27. TEXTURED PROTEIN MARKET BY REGION, 2022 AND 2032(%)
- FIGURE 28. U.S. TEXTURED PROTEIN MARKET, 2022-2032 ($MILLION)
- FIGURE 29. CANADA TEXTURED PROTEIN MARKET, 2022-2032 ($MILLION)
- FIGURE 30. MEXICO TEXTURED PROTEIN MARKET, 2022-2032 ($MILLION)
- FIGURE 31. SPAIN TEXTURED PROTEIN MARKET, 2022-2032 ($MILLION)
- FIGURE 32. RUSSIA TEXTURED PROTEIN MARKET, 2022-2032 ($MILLION)
- FIGURE 33. GERMANY TEXTURED PROTEIN MARKET, 2022-2032 ($MILLION)
- FIGURE 34. FRANCE TEXTURED PROTEIN MARKET, 2022-2032 ($MILLION)
- FIGURE 35. NETHERLANDS TEXTURED PROTEIN MARKET, 2022-2032 ($MILLION)
- FIGURE 36. ITALY TEXTURED PROTEIN MARKET, 2022-2032 ($MILLION)
- FIGURE 37. REST OF EUROPE TEXTURED PROTEIN MARKET, 2022-2032 ($MILLION)
- FIGURE 38. CHINA TEXTURED PROTEIN MARKET, 2022-2032 ($MILLION)
- FIGURE 39. INDIA TEXTURED PROTEIN MARKET, 2022-2032 ($MILLION)
- FIGURE 40. JAPAN TEXTURED PROTEIN MARKET, 2022-2032 ($MILLION)
- FIGURE 41. INDONESIA TEXTURED PROTEIN MARKET, 2022-2032 ($MILLION)
- FIGURE 42. SOUTH KOREA TEXTURED PROTEIN MARKET, 2022-2032 ($MILLION)
- FIGURE 43. REST OF ASIA PACAFIC TEXTURED PROTEIN MARKET, 2022-2032 ($MILLION)
- FIGURE 44. BRAZIL TEXTURED PROTEIN MARKET, 2022-2032 ($MILLION)
- FIGURE 45. ARGENTINA TEXTURED PROTEIN MARKET, 2022-2032 ($MILLION)
- FIGURE 46. REST OF LAMEA TEXTURED PROTEIN MARKET, 2022-2032 ($MILLION)
- FIGURE 47. SAUDI ARABIA TEXTURED PROTEIN MARKET, 2022-2032 ($MILLION)
- FIGURE 48. UAE TEXTURED PROTEIN MARKET, 2022-2032 ($MILLION)
- FIGURE 49. SOUTH AFRICA TEXTURED PROTEIN MARKET, 2022-2032 ($MILLION)
- FIGURE 50. REST OF MEA TEXTURED PROTEIN MARKET, 2022-2032 ($MILLION)
- FIGURE 51. TOP WINNING STRATEGIES, BY YEAR
- FIGURE 52. TOP WINNING STRATEGIES, BY DEVELOPMENT
- FIGURE 53. TOP WINNING STRATEGIES, BY COMPANY
- FIGURE 54. PRODUCT MAPPING OF TOP 10 PLAYERS
- FIGURE 55. COMPETITIVE DASHBOARD
- FIGURE 56. COMPETITIVE HEATMAP: TEXTURED PROTEIN MARKET
- FIGURE 57. TOP PLAYER POSITIONING, 2022
 全球草饲蛋白质市场全球β-乳球蛋白市场
 全球有机米蛋白市场研究报告 - 产业分析、规模、份额、成长、趋势及预测(2025 年至 2033 年)
 全球蛋白脆片市场:产业分析、规模、份额、成长、趋势与预测(2025-2032)
 蛋白薯片市场-全球产业规模、份额、趋势、机会及预测(依产品、销售通路、地区及竞争状况,2020-2030 年)
 蛋白质晶片市场,按来源、按类型、按包装、按分销渠道、按最终用途、按地区
 全球蛋白质晶片市场:市场规模、份额、趋势分析(按分销管道、应用和产品)、区域展望和未来预测(2024-2031 年)海洋蛋白的全球市场 - 全球产业分析,规模,占有率,成长,趋势,预测(2032年)海洋衍生蛋白市场机会、成长动力、产业趋势分析及 2025 - 2034 年预测
 微生物蛋白市场规模、份额和成长分析(按微生物来源、功能、生产方法、应用、形状和地区):产业预测(2025-2032)