


 |
市场调查报告书
商品编码
1513425
主食市场:依产品类型、性质、通路划分:2023-2032 年全球机会分析与产业预测Staple Food Market By Product Type, By Nature, By Distribution Channel (Direct-to-Consumer, Retail Stores, Wholesale Distributors, Online Retailers, Others): Global Opportunity Analysis and Industry Forecast, 2023-2032 |
||||||
价格
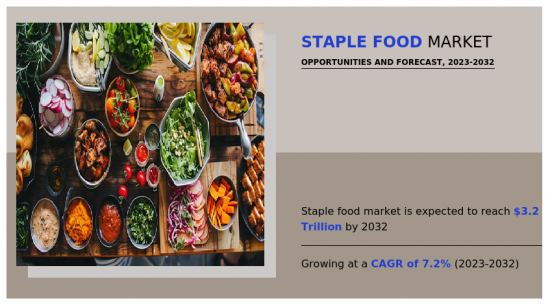
全球主粮市场预计将从2022年的16,844亿美元成长到2032年的32,102亿美元,2023年至2032年复合年增长率为7.2%。
 主食是基本的、普遍食用的食品,在特定文化或地区是营养和能源来源的重要来源。主食通常价格便宜、来源广泛且易于储存。主食可以有多种来源,包括谷类(如大米、小麦和玉米)、块茎类(如马铃薯和木薯)、豆类(如蚕豆和扁豆)和其他富含碳水化合物的食品。食品清洁标籤已成为食品产业的重要趋势,影响消费者的选择并推动市场成长,特别是在主食领域。清洁标籤一词通常是指简单透明、成分最少的食品,通常避免人工添加剂、防腐剂和合成化学物质。这一趋势与消费者对更健康、天然食品的需求不断增长相一致。随着消费者的健康意识越来越强,他们正在寻找符合更健康生活方式的食品。食品上的清洁标籤表明人工成分较少,表明这些产品更健康。清洁标籤趋势通常与对天然和食品的偏好密切相关。采用这种方法的食品生产商可能会吸引寻求更少加工、更天然食品选择的消费者。食品需要复杂的供应链,包括运输、储存和分销网络,才能到达消费者手中。地缘政治问题、流行病、罢工或自然灾害造成的干扰可能会扰乱这些食品的供应,导致价格波动和短缺。关税、进出口限制和其他贸易壁垒可能会限制主食的跨境流动。与食品安全、品质标准和标籤相关的法规也可能给生产商和经销商带来挑战。人们对植物性饮食的兴趣日益浓厚,为主食製造商提供创新产品创造了机会。例如,扁豆、鹰嘴豆和藜麦等植物蛋白可以补充或取代传统主食,吸引註重健康和环保的消费者。消费者越来越重视食品生产对环境的影响。企业可以透过采用可再生农业、减少用水和环保包装等永续实践来抓住这一机会。这些倡议可以吸引具有环保意识的消费者并支持长期永续性。机能性食品趋势不断发展,为添加维生素、矿物质和抗氧化剂等营养素来强化食品提供了机会。本报告介绍的主要企业包括雀巢、百事可乐、嘉吉、ADM 公司、可口可乐、百威英博、JBS SA、亿滋、达能和帝亚吉欧公司。市场相关人员继续使用联盟和收购等策略来在这个竞争激烈的市场中获得优势。
- 该报告提供了 2022 年至 2032 年主食市场分析的细分市场、当前趋势、估计/趋势和动态的定量分析,并确定了主食市场的主要机会。
- 我们提供市场研究以及与市场驱动因素、市场限制和市场机会相关的资讯。
- 波特的五力分析揭示了买家和供应商的潜力,帮助相关人员做出利润驱动的业务决策并加强供应商和买家网路。
- 对主食市场细分的详细分析有助于识别市场机会。
- 每个地区的主要国家都根据其对全球市场的收益贡献绘製了地图。
- 市场参与者定位有助于基准化分析,并提供对市场参与者当前地位的清晰了解。
- 该报告包括对区域和全球主食市场趋势、主要企业、细分市场、应用领域和市场成长策略的分析。您透过此次购买获得的其他好处包括:
- 季度更新*(仅适用于公司许可证。)
- 在购买之前或之后免费更新您选择的 5 个额外公司简介。
- 如果您购买 5 使用者许可证或企业使用者许可证,将免费提供下一个版本。
- 16 小时分析师支援*(购买后,如果您的报告审查发现有额外的资料要求,您将获得 16 小时分析师支持,以解决任何问题或售后查询。)
- 15% 免费自订*(如果报告的范围或细分不符合您的要求,15% 相当于 3 个工作日的免费工作。)
- 5 个用户许可证和企业用户许可证的免费资料包。 (Excel版报告)
- 如果您的报告超过 6-12 个月,我们将免费提供更新的报告。
- 24 小时优先回应*。
- 可以使用此报告进行客製化(需要额外费用和时间表)
- 产品中所含原料分析(%)
- 最终用户偏好和痛点
- 投资机会
- 产品生命週期
- 按地区分類的新参与企业
- 平均消费者支出
- 经销商利润分析
- 按产品/细分市场细分
- 监管指引
- 策略建议
- 针对客户兴趣的其他公司简介
- 按国家或地区进行的附加分析 – 市场规模和预测
- 平均售价分析/价位分析
- 十字交叉细分市场分析—市场规模与预测
- 公司简介的扩充列表
- 历史市场资料
- 主要参与者的详细资料(Excel格式,包括位置、联络资讯、供应商/供应商网路等)
- 全球/区域/国家层级参与者的市场占有率分析
- SWOT分析
- 市场规模及预测
目录
第一章简介
第 2 章执行摘要
第三章市场概况
- 市场定义和范围
- 主要发现
- 影响因素
- 主要投资机会
- 波特五力分析
- 市场动态
- 促进因素
- 抑制因素
- 机会
- 平均售价
- 市场占有率分析
- 品牌占有率分析
- 贸易资料分析
- 产品消费
- 价值链分析
- 主要球员详细信息
- 关键监管分析
- 监管指引
- 专利情况
- 赎回场景
第四章 主食市场:依产品类型
- 概述
- 谷类
- 砂糖
- 根茎类蔬菜
- 水果
- 蔬菜
- 油
- 其他的
第五章 主食市场:本质
- 概述
- 有机的
- 传统的
第六章 主食市场:依流通管道
- 概述
- 直接面向消费者 (D2C)
- 零售店
- 批发商
- 网路零售商
- 其他的
第七章 主食市场:分地区
- 概述
- 北美洲
- 美国
- 加拿大
- 墨西哥
- 欧洲
- 德国
- 英国
- 法国
- 西班牙
- 义大利
- 其他的
- 亚太地区
- 中国
- 日本
- 印度
- 韩国
- 澳洲
- 其他的
- 拉丁美洲/中东/非洲
- 巴西
- 南非
- 阿拉伯聯合大公国
- 南非
- 其他的
第八章 竞争格局
- 介绍
- 关键成功策略
- 10家主要企业产品图谱
- 竞争对手仪表板
- 竞争热图
- 2022年主要企业定位
第九章 公司简介
- Nestle
- PepsiCo
- Cargill
- ADM Company
- Coca-Cola
- AB InBev
- JBS SA
- Mondelez
- Danone
- DIAGEO PLC
Product Code: A323381
The global staple food market is anticipated to reach $3,210.2 billion by 2032, growing from $1,684.4 billion in 2022 at a CAGR of 7.2% from 2023 to 2032.Key Benefits For Stakeholders
- This report provides a quantitative analysis of the market segments, current trends, estimations, and dynamics of the staple food market analysis from 2022 to 2032 to identify the prevailing staple food market opportunities.
- The market research is offered along with information related to key drivers, restraints, and opportunities.
- Porter's five forces analysis highlights the potency of buyers and suppliers to enable stakeholders make profit-oriented business decisions and strengthen their supplier-buyer network.
- In-depth analysis of the staple food market segmentation assists to determine the prevailing market opportunities.
- Major countries in each region are mapped according to their revenue contribution to the global market.
- Market player positioning facilitates benchmarking and provides a clear understanding of the present position of the market players.
- The report includes the analysis of the regional as well as global staple food market trends, key players, market segments, application areas, and market growth strategies.Additional benefits you will get with this purchase are:
- Quarterly Update and* (only available with a corporate license, on listed price)
- 5 additional Company Profile of client Choice pre- or Post-purchase, as a free update.
- Free Upcoming Version on the Purchase of Five and Enterprise User License.
- 16 analyst hours of support* (post-purchase, if you find additional data requirements upon review of the report, you may receive support amounting to 16 analyst hours to solve questions, and post-sale queries)
- 15% Free Customization* (in case the scope or segment of the report does not match your requirements, 15% is equivalent to 3 working days of free work, applicable once)
- Free data Pack on the Five and Enterprise User License. (Excel version of the report)
- Free Updated report if the report is 6-12 months old or older.
- 24-hour priority response*
- Free Industry updates and white papers.Possible Customization with this report (with additional cost and timeline, please talk to the sales executive to know more)
- Analysis of raw material in a product (by %)
- End user preferences and pain points
- Investment Opportunities
- Product Life Cycle
- Upcoming/New Entrant by Regions
- Average Consumer Expenditure
- Distributor margin Analysis
- Market share analysis of players by products/segments
- Regulatory Guidelines
- Strategic Recommendations
- Additional company profiles with specific to client's interest
- Additional country or region analysis- market size and forecast
- Average Selling Price Analysis / Price Point Analysis
- Criss-cross segment analysis- market size and forecast
- Expanded list for Company Profiles
- Historic market data
- Key player details (including location, contact details, supplier/vendor network etc. in excel format)
- Market share analysis of players at global/region/country level
- SWOT Analysis
- Volume Market Size and Forecast
Key Market Segments
By Product Type
- Cereals
- Sugar
- Roots and Tuber
- Fruit
- Vegetables
- Oil
- Others
By Nature
- Organic
- Conventional
By Distribution Channel
- Wholesale Distributors
- Online Retailers
- Others
- Direct-to-Consumer (D2C)
- Retail Stores
By Region
- North America
- U.S.
- Canada
- Mexico
- Europe
- Germany
- UK
- France
- Spain
- Italy
- Rest of Europe
- Asia-Pacific
- China
- Japan
- India
- South Korea
- Australia
- Rest of Asia-Pacific
- LAMEA
- Brazil
- South Africa,
- United Arab Emirates
- South Africa
- Rest of LAMEA
Key Market Players:
- Nestle
- PepsiCo
- Cargill
- ADM Company
- Coca-Cola
- AB InBev
- JBS S.A.
- Mondelez
- Danone
- DIAGEO PLC
TABLE OF CONTENTS
CHAPTER 1: INTRODUCTION
- 1.1. Report description
- 1.2. Key market segments
- 1.3. Key benefits to the stakeholders
- 1.4. Research methodology
- 1.4.1. Primary research
- 1.4.2. Secondary research
- 1.4.3. Analyst tools and models
CHAPTER 2: EXECUTIVE SUMMARY
- 2.1. CXO perspective
CHAPTER 3: MARKET OVERVIEW
- 3.1. Market definition and scope
- 3.2. Key findings
- 3.2.1. Top impacting factors
- 3.2.2. Top investment pockets
- 3.3. Porter's five forces analysis
- 3.4. Market dynamics
- 3.4.1. Drivers
- 3.4.2. Restraints
- 3.4.3. Opportunities
- 3.5. Average Selling Price
- 3.6. Market Share Analysis
- 3.7. Brand Share Analysis
- 3.8. Trade Data Analysis
- 3.9. Product Consumption
- 3.10. Value Chain Analysis
- 3.11. Key Players Details
- 3.12. Key Regulation Analysis
- 3.13. Regulatory Guidelines
- 3.14. Patent Landscape
- 3.15. Reimbursement Scenario
CHAPTER 4: STAPLE FOOD MARKET, BY PRODUCT TYPE
- 4.1. Overview
- 4.1.1. Market size and forecast
- 4.2. Cereals
- 4.2.1. Key market trends, growth factors and opportunities
- 4.2.2. Market size and forecast, by region
- 4.2.3. Market share analysis by country
- 4.3. Sugar
- 4.3.1. Key market trends, growth factors and opportunities
- 4.3.2. Market size and forecast, by region
- 4.3.3. Market share analysis by country
- 4.4. Roots and Tuber
- 4.4.1. Key market trends, growth factors and opportunities
- 4.4.2. Market size and forecast, by region
- 4.4.3. Market share analysis by country
- 4.5. Fruit
- 4.5.1. Key market trends, growth factors and opportunities
- 4.5.2. Market size and forecast, by region
- 4.5.3. Market share analysis by country
- 4.6. Vegetables
- 4.6.1. Key market trends, growth factors and opportunities
- 4.6.2. Market size and forecast, by region
- 4.6.3. Market share analysis by country
- 4.7. Oil
- 4.7.1. Key market trends, growth factors and opportunities
- 4.7.2. Market size and forecast, by region
- 4.7.3. Market share analysis by country
- 4.8. Others
- 4.8.1. Key market trends, growth factors and opportunities
- 4.8.2. Market size and forecast, by region
- 4.8.3. Market share analysis by country
CHAPTER 5: STAPLE FOOD MARKET, BY NATURE
- 5.1. Overview
- 5.1.1. Market size and forecast
- 5.2. Organic
- 5.2.1. Key market trends, growth factors and opportunities
- 5.2.2. Market size and forecast, by region
- 5.2.3. Market share analysis by country
- 5.3. Conventional
- 5.3.1. Key market trends, growth factors and opportunities
- 5.3.2. Market size and forecast, by region
- 5.3.3. Market share analysis by country
CHAPTER 6: STAPLE FOOD MARKET, BY DISTRIBUTION CHANNEL
- 6.1. Overview
- 6.1.1. Market size and forecast
- 6.2. Direct-to-Consumer (D2C)
- 6.2.1. Key market trends, growth factors and opportunities
- 6.2.2. Market size and forecast, by region
- 6.2.3. Market share analysis by country
- 6.3. Retail Stores
- 6.3.1. Key market trends, growth factors and opportunities
- 6.3.2. Market size and forecast, by region
- 6.3.3. Market share analysis by country
- 6.4. Wholesale Distributors
- 6.4.1. Key market trends, growth factors and opportunities
- 6.4.2. Market size and forecast, by region
- 6.4.3. Market share analysis by country
- 6.5. Online Retailers
- 6.5.1. Key market trends, growth factors and opportunities
- 6.5.2. Market size and forecast, by region
- 6.5.3. Market share analysis by country
- 6.6. Others
- 6.6.1. Key market trends, growth factors and opportunities
- 6.6.2. Market size and forecast, by region
- 6.6.3. Market share analysis by country
CHAPTER 7: STAPLE FOOD MARKET, BY REGION
- 7.1. Overview
- 7.1.1. Market size and forecast By Region
- 7.2. North America
- 7.2.1. Key market trends, growth factors and opportunities
- 7.2.2. Market size and forecast, by Product Type
- 7.2.3. Market size and forecast, by Nature
- 7.2.4. Market size and forecast, by Distribution Channel
- 7.2.5. Market size and forecast, by country
- 7.2.5.1. U.S.
- 7.2.5.1.1. Market size and forecast, by Product Type
- 7.2.5.1.2. Market size and forecast, by Nature
- 7.2.5.1.3. Market size and forecast, by Distribution Channel
- 7.2.5.2. Canada
- 7.2.5.2.1. Market size and forecast, by Product Type
- 7.2.5.2.2. Market size and forecast, by Nature
- 7.2.5.2.3. Market size and forecast, by Distribution Channel
- 7.2.5.3. Mexico
- 7.2.5.3.1. Market size and forecast, by Product Type
- 7.2.5.3.2. Market size and forecast, by Nature
- 7.2.5.3.3. Market size and forecast, by Distribution Channel
- 7.3. Europe
- 7.3.1. Key market trends, growth factors and opportunities
- 7.3.2. Market size and forecast, by Product Type
- 7.3.3. Market size and forecast, by Nature
- 7.3.4. Market size and forecast, by Distribution Channel
- 7.3.5. Market size and forecast, by country
- 7.3.5.1. Germany
- 7.3.5.1.1. Market size and forecast, by Product Type
- 7.3.5.1.2. Market size and forecast, by Nature
- 7.3.5.1.3. Market size and forecast, by Distribution Channel
- 7.3.5.2. UK
- 7.3.5.2.1. Market size and forecast, by Product Type
- 7.3.5.2.2. Market size and forecast, by Nature
- 7.3.5.2.3. Market size and forecast, by Distribution Channel
- 7.3.5.3. France
- 7.3.5.3.1. Market size and forecast, by Product Type
- 7.3.5.3.2. Market size and forecast, by Nature
- 7.3.5.3.3. Market size and forecast, by Distribution Channel
- 7.3.5.4. Spain
- 7.3.5.4.1. Market size and forecast, by Product Type
- 7.3.5.4.2. Market size and forecast, by Nature
- 7.3.5.4.3. Market size and forecast, by Distribution Channel
- 7.3.5.5. Italy
- 7.3.5.5.1. Market size and forecast, by Product Type
- 7.3.5.5.2. Market size and forecast, by Nature
- 7.3.5.5.3. Market size and forecast, by Distribution Channel
- 7.3.5.6. Rest of Europe
- 7.3.5.6.1. Market size and forecast, by Product Type
- 7.3.5.6.2. Market size and forecast, by Nature
- 7.3.5.6.3. Market size and forecast, by Distribution Channel
- 7.4. Asia-Pacific
- 7.4.1. Key market trends, growth factors and opportunities
- 7.4.2. Market size and forecast, by Product Type
- 7.4.3. Market size and forecast, by Nature
- 7.4.4. Market size and forecast, by Distribution Channel
- 7.4.5. Market size and forecast, by country
- 7.4.5.1. China
- 7.4.5.1.1. Market size and forecast, by Product Type
- 7.4.5.1.2. Market size and forecast, by Nature
- 7.4.5.1.3. Market size and forecast, by Distribution Channel
- 7.4.5.2. Japan
- 7.4.5.2.1. Market size and forecast, by Product Type
- 7.4.5.2.2. Market size and forecast, by Nature
- 7.4.5.2.3. Market size and forecast, by Distribution Channel
- 7.4.5.3. India
- 7.4.5.3.1. Market size and forecast, by Product Type
- 7.4.5.3.2. Market size and forecast, by Nature
- 7.4.5.3.3. Market size and forecast, by Distribution Channel
- 7.4.5.4. South Korea
- 7.4.5.4.1. Market size and forecast, by Product Type
- 7.4.5.4.2. Market size and forecast, by Nature
- 7.4.5.4.3. Market size and forecast, by Distribution Channel
- 7.4.5.5. Australia
- 7.4.5.5.1. Market size and forecast, by Product Type
- 7.4.5.5.2. Market size and forecast, by Nature
- 7.4.5.5.3. Market size and forecast, by Distribution Channel
- 7.4.5.6. Rest of Asia-Pacific
- 7.4.5.6.1. Market size and forecast, by Product Type
- 7.4.5.6.2. Market size and forecast, by Nature
- 7.4.5.6.3. Market size and forecast, by Distribution Channel
- 7.5. LAMEA
- 7.5.1. Key market trends, growth factors and opportunities
- 7.5.2. Market size and forecast, by Product Type
- 7.5.3. Market size and forecast, by Nature
- 7.5.4. Market size and forecast, by Distribution Channel
- 7.5.5. Market size and forecast, by country
- 7.5.5.1. Brazil
- 7.5.5.1.1. Market size and forecast, by Product Type
- 7.5.5.1.2. Market size and forecast, by Nature
- 7.5.5.1.3. Market size and forecast, by Distribution Channel
- 7.5.5.2. South Africa,
- 7.5.5.2.1. Market size and forecast, by Product Type
- 7.5.5.2.2. Market size and forecast, by Nature
- 7.5.5.2.3. Market size and forecast, by Distribution Channel
- 7.5.5.3. United Arab Emirates
- 7.5.5.3.1. Market size and forecast, by Product Type
- 7.5.5.3.2. Market size and forecast, by Nature
- 7.5.5.3.3. Market size and forecast, by Distribution Channel
- 7.5.5.4. South Africa
- 7.5.5.4.1. Market size and forecast, by Product Type
- 7.5.5.4.2. Market size and forecast, by Nature
- 7.5.5.4.3. Market size and forecast, by Distribution Channel
- 7.5.5.5. Rest of LAMEA
- 7.5.5.5.1. Market size and forecast, by Product Type
- 7.5.5.5.2. Market size and forecast, by Nature
- 7.5.5.5.3. Market size and forecast, by Distribution Channel
CHAPTER 8: COMPETITIVE LANDSCAPE
- 8.1. Introduction
- 8.2. Top winning strategies
- 8.3. Product mapping of top 10 player
- 8.4. Competitive dashboard
- 8.5. Competitive heatmap
- 8.6. Top player positioning, 2022
CHAPTER 9: COMPANY PROFILES
- 9.1. Nestle
- 9.1.1. Company overview
- 9.1.2. Key executives
- 9.1.3. Company snapshot
- 9.2. PepsiCo
- 9.2.1. Company overview
- 9.2.2. Key executives
- 9.2.3. Company snapshot
- 9.3. Cargill
- 9.3.1. Company overview
- 9.3.2. Key executives
- 9.3.3. Company snapshot
- 9.4. ADM Company
- 9.4.1. Company overview
- 9.4.2. Key executives
- 9.4.3. Company snapshot
- 9.5. Coca-Cola
- 9.5.1. Company overview
- 9.5.2. Key executives
- 9.5.3. Company snapshot
- 9.6. AB InBev
- 9.6.1. Company overview
- 9.6.2. Key executives
- 9.6.3. Company snapshot
- 9.7. JBS S.A.
- 9.7.1. Company overview
- 9.7.2. Key executives
- 9.7.3. Company snapshot
- 9.8. Mondelez
- 9.8.1. Company overview
- 9.8.2. Key executives
- 9.8.3. Company snapshot
- 9.9. Danone
- 9.9.1. Company overview
- 9.9.2. Key executives
- 9.9.3. Company snapshot
- 9.10. DIAGEO PLC
- 9.10.1. Company overview
- 9.10.2. Key executives
- 9.10.3. Company snapshot
LIST OF TABLES
- TABLE 01. GLOBAL STAPLE FOOD MARKET, BY PRODUCT TYPE, 2022-2032 ($BILLION)
- TABLE 02. STAPLE FOOD MARKET FOR CEREALS, BY REGION, 2022-2032 ($BILLION)
- TABLE 03. STAPLE FOOD MARKET FOR SUGAR, BY REGION, 2022-2032 ($BILLION)
- TABLE 04. STAPLE FOOD MARKET FOR ROOTS AND TUBER, BY REGION, 2022-2032 ($BILLION)
- TABLE 05. STAPLE FOOD MARKET FOR FRUIT, BY REGION, 2022-2032 ($BILLION)
- TABLE 06. STAPLE FOOD MARKET FOR VEGETABLES, BY REGION, 2022-2032 ($BILLION)
- TABLE 07. STAPLE FOOD MARKET FOR OIL, BY REGION, 2022-2032 ($BILLION)
- TABLE 08. STAPLE FOOD MARKET FOR OTHERS, BY REGION, 2022-2032 ($BILLION)
- TABLE 09. GLOBAL STAPLE FOOD MARKET, BY NATURE, 2022-2032 ($BILLION)
- TABLE 10. STAPLE FOOD MARKET FOR ORGANIC, BY REGION, 2022-2032 ($BILLION)
- TABLE 11. STAPLE FOOD MARKET FOR CONVENTIONAL, BY REGION, 2022-2032 ($BILLION)
- TABLE 12. GLOBAL STAPLE FOOD MARKET, BY DISTRIBUTION CHANNEL, 2022-2032 ($BILLION)
- TABLE 13. STAPLE FOOD MARKET FOR DIRECT-TO-CONSUMER (D2C), BY REGION, 2022-2032 ($BILLION)
- TABLE 14. STAPLE FOOD MARKET FOR RETAIL STORES, BY REGION, 2022-2032 ($BILLION)
- TABLE 15. STAPLE FOOD MARKET FOR WHOLESALE DISTRIBUTORS, BY REGION, 2022-2032 ($BILLION)
- TABLE 16. STAPLE FOOD MARKET FOR ONLINE RETAILERS, BY REGION, 2022-2032 ($BILLION)
- TABLE 17. STAPLE FOOD MARKET FOR OTHERS, BY REGION, 2022-2032 ($BILLION)
- TABLE 18. STAPLE FOOD MARKET, BY REGION, 2022-2032 ($BILLION)
- TABLE 19. NORTH AMERICA STAPLE FOOD MARKET, BY PRODUCT TYPE, 2022-2032 ($BILLION)
- TABLE 20. NORTH AMERICA STAPLE FOOD MARKET, BY NATURE, 2022-2032 ($BILLION)
- TABLE 21. NORTH AMERICA STAPLE FOOD MARKET, BY DISTRIBUTION CHANNEL, 2022-2032 ($BILLION)
- TABLE 22. NORTH AMERICA STAPLE FOOD MARKET, BY COUNTRY, 2022-2032 ($BILLION)
- TABLE 23. U.S. STAPLE FOOD MARKET, BY PRODUCT TYPE, 2022-2032 ($BILLION)
- TABLE 24. U.S. STAPLE FOOD MARKET, BY NATURE, 2022-2032 ($BILLION)
- TABLE 25. U.S. STAPLE FOOD MARKET, BY DISTRIBUTION CHANNEL, 2022-2032 ($BILLION)
- TABLE 26. CANADA STAPLE FOOD MARKET, BY PRODUCT TYPE, 2022-2032 ($BILLION)
- TABLE 27. CANADA STAPLE FOOD MARKET, BY NATURE, 2022-2032 ($BILLION)
- TABLE 28. CANADA STAPLE FOOD MARKET, BY DISTRIBUTION CHANNEL, 2022-2032 ($BILLION)
- TABLE 29. MEXICO STAPLE FOOD MARKET, BY PRODUCT TYPE, 2022-2032 ($BILLION)
- TABLE 30. MEXICO STAPLE FOOD MARKET, BY NATURE, 2022-2032 ($BILLION)
- TABLE 31. MEXICO STAPLE FOOD MARKET, BY DISTRIBUTION CHANNEL, 2022-2032 ($BILLION)
- TABLE 32. EUROPE STAPLE FOOD MARKET, BY PRODUCT TYPE, 2022-2032 ($BILLION)
- TABLE 33. EUROPE STAPLE FOOD MARKET, BY NATURE, 2022-2032 ($BILLION)
- TABLE 34. EUROPE STAPLE FOOD MARKET, BY DISTRIBUTION CHANNEL, 2022-2032 ($BILLION)
- TABLE 35. EUROPE STAPLE FOOD MARKET, BY COUNTRY, 2022-2032 ($BILLION)
- TABLE 36. GERMANY STAPLE FOOD MARKET, BY PRODUCT TYPE, 2022-2032 ($BILLION)
- TABLE 37. GERMANY STAPLE FOOD MARKET, BY NATURE, 2022-2032 ($BILLION)
- TABLE 38. GERMANY STAPLE FOOD MARKET, BY DISTRIBUTION CHANNEL, 2022-2032 ($BILLION)
- TABLE 39. UK STAPLE FOOD MARKET, BY PRODUCT TYPE, 2022-2032 ($BILLION)
- TABLE 40. UK STAPLE FOOD MARKET, BY NATURE, 2022-2032 ($BILLION)
- TABLE 41. UK STAPLE FOOD MARKET, BY DISTRIBUTION CHANNEL, 2022-2032 ($BILLION)
- TABLE 42. FRANCE STAPLE FOOD MARKET, BY PRODUCT TYPE, 2022-2032 ($BILLION)
- TABLE 43. FRANCE STAPLE FOOD MARKET, BY NATURE, 2022-2032 ($BILLION)
- TABLE 44. FRANCE STAPLE FOOD MARKET, BY DISTRIBUTION CHANNEL, 2022-2032 ($BILLION)
- TABLE 45. SPAIN STAPLE FOOD MARKET, BY PRODUCT TYPE, 2022-2032 ($BILLION)
- TABLE 46. SPAIN STAPLE FOOD MARKET, BY NATURE, 2022-2032 ($BILLION)
- TABLE 47. SPAIN STAPLE FOOD MARKET, BY DISTRIBUTION CHANNEL, 2022-2032 ($BILLION)
- TABLE 48. ITALY STAPLE FOOD MARKET, BY PRODUCT TYPE, 2022-2032 ($BILLION)
- TABLE 49. ITALY STAPLE FOOD MARKET, BY NATURE, 2022-2032 ($BILLION)
- TABLE 50. ITALY STAPLE FOOD MARKET, BY DISTRIBUTION CHANNEL, 2022-2032 ($BILLION)
- TABLE 51. REST OF EUROPE STAPLE FOOD MARKET, BY PRODUCT TYPE, 2022-2032 ($BILLION)
- TABLE 52. REST OF EUROPE STAPLE FOOD MARKET, BY NATURE, 2022-2032 ($BILLION)
- TABLE 53. REST OF EUROPE STAPLE FOOD MARKET, BY DISTRIBUTION CHANNEL, 2022-2032 ($BILLION)
- TABLE 54. ASIA-PACIFIC STAPLE FOOD MARKET, BY PRODUCT TYPE, 2022-2032 ($BILLION)
- TABLE 55. ASIA-PACIFIC STAPLE FOOD MARKET, BY NATURE, 2022-2032 ($BILLION)
- TABLE 56. ASIA-PACIFIC STAPLE FOOD MARKET, BY DISTRIBUTION CHANNEL, 2022-2032 ($BILLION)
- TABLE 57. ASIA-PACIFIC STAPLE FOOD MARKET, BY COUNTRY, 2022-2032 ($BILLION)
- TABLE 58. CHINA STAPLE FOOD MARKET, BY PRODUCT TYPE, 2022-2032 ($BILLION)
- TABLE 59. CHINA STAPLE FOOD MARKET, BY NATURE, 2022-2032 ($BILLION)
- TABLE 60. CHINA STAPLE FOOD MARKET, BY DISTRIBUTION CHANNEL, 2022-2032 ($BILLION)
- TABLE 61. JAPAN STAPLE FOOD MARKET, BY PRODUCT TYPE, 2022-2032 ($BILLION)
- TABLE 62. JAPAN STAPLE FOOD MARKET, BY NATURE, 2022-2032 ($BILLION)
- TABLE 63. JAPAN STAPLE FOOD MARKET, BY DISTRIBUTION CHANNEL, 2022-2032 ($BILLION)
- TABLE 64. INDIA STAPLE FOOD MARKET, BY PRODUCT TYPE, 2022-2032 ($BILLION)
- TABLE 65. INDIA STAPLE FOOD MARKET, BY NATURE, 2022-2032 ($BILLION)
- TABLE 66. INDIA STAPLE FOOD MARKET, BY DISTRIBUTION CHANNEL, 2022-2032 ($BILLION)
- TABLE 67. SOUTH KOREA STAPLE FOOD MARKET, BY PRODUCT TYPE, 2022-2032 ($BILLION)
- TABLE 68. SOUTH KOREA STAPLE FOOD MARKET, BY NATURE, 2022-2032 ($BILLION)
- TABLE 69. SOUTH KOREA STAPLE FOOD MARKET, BY DISTRIBUTION CHANNEL, 2022-2032 ($BILLION)
- TABLE 70. AUSTRALIA STAPLE FOOD MARKET, BY PRODUCT TYPE, 2022-2032 ($BILLION)
- TABLE 71. AUSTRALIA STAPLE FOOD MARKET, BY NATURE, 2022-2032 ($BILLION)
- TABLE 72. AUSTRALIA STAPLE FOOD MARKET, BY DISTRIBUTION CHANNEL, 2022-2032 ($BILLION)
- TABLE 73. REST OF ASIA-PACIFIC STAPLE FOOD MARKET, BY PRODUCT TYPE, 2022-2032 ($BILLION)
- TABLE 74. REST OF ASIA-PACIFIC STAPLE FOOD MARKET, BY NATURE, 2022-2032 ($BILLION)
- TABLE 75. REST OF ASIA-PACIFIC STAPLE FOOD MARKET, BY DISTRIBUTION CHANNEL, 2022-2032 ($BILLION)
- TABLE 76. LAMEA STAPLE FOOD MARKET, BY PRODUCT TYPE, 2022-2032 ($BILLION)
- TABLE 77. LAMEA STAPLE FOOD MARKET, BY NATURE, 2022-2032 ($BILLION)
- TABLE 78. LAMEA STAPLE FOOD MARKET, BY DISTRIBUTION CHANNEL, 2022-2032 ($BILLION)
- TABLE 79. LAMEA STAPLE FOOD MARKET, BY COUNTRY, 2022-2032 ($BILLION)
- TABLE 80. BRAZIL STAPLE FOOD MARKET, BY PRODUCT TYPE, 2022-2032 ($BILLION)
- TABLE 81. BRAZIL STAPLE FOOD MARKET, BY NATURE, 2022-2032 ($BILLION)
- TABLE 82. BRAZIL STAPLE FOOD MARKET, BY DISTRIBUTION CHANNEL, 2022-2032 ($BILLION)
- TABLE 83. SOUTH AFRICA, STAPLE FOOD MARKET, BY PRODUCT TYPE, 2022-2032 ($BILLION)
- TABLE 84. SOUTH AFRICA, STAPLE FOOD MARKET, BY NATURE, 2022-2032 ($BILLION)
- TABLE 85. SOUTH AFRICA, STAPLE FOOD MARKET, BY DISTRIBUTION CHANNEL, 2022-2032 ($BILLION)
- TABLE 86. UNITED ARAB EMIRATES STAPLE FOOD MARKET, BY PRODUCT TYPE, 2022-2032 ($BILLION)
- TABLE 87. UNITED ARAB EMIRATES STAPLE FOOD MARKET, BY NATURE, 2022-2032 ($BILLION)
- TABLE 88. UNITED ARAB EMIRATES STAPLE FOOD MARKET, BY DISTRIBUTION CHANNEL, 2022-2032 ($BILLION)
- TABLE 89. SOUTH AFRICA STAPLE FOOD MARKET, BY PRODUCT TYPE, 2022-2032 ($BILLION)
- TABLE 90. SOUTH AFRICA STAPLE FOOD MARKET, BY NATURE, 2022-2032 ($BILLION)
- TABLE 91. SOUTH AFRICA STAPLE FOOD MARKET, BY DISTRIBUTION CHANNEL, 2022-2032 ($BILLION)
- TABLE 92. REST OF LAMEA STAPLE FOOD MARKET, BY PRODUCT TYPE, 2022-2032 ($BILLION)
- TABLE 93. REST OF LAMEA STAPLE FOOD MARKET, BY NATURE, 2022-2032 ($BILLION)
- TABLE 94. REST OF LAMEA STAPLE FOOD MARKET, BY DISTRIBUTION CHANNEL, 2022-2032 ($BILLION)
- TABLE 95. NESTLE: KEY EXECUTIVES
- TABLE 96. NESTLE: COMPANY SNAPSHOT
- TABLE 97. PEPSICO: KEY EXECUTIVES
- TABLE 98. PEPSICO: COMPANY SNAPSHOT
- TABLE 99. CARGILL: KEY EXECUTIVES
- TABLE 100. CARGILL: COMPANY SNAPSHOT
- TABLE 101. ADM COMPANY: KEY EXECUTIVES
- TABLE 102. ADM COMPANY: COMPANY SNAPSHOT
- TABLE 103. COCA-COLA: KEY EXECUTIVES
- TABLE 104. COCA-COLA: COMPANY SNAPSHOT
- TABLE 105. AB INBEV: KEY EXECUTIVES
- TABLE 106. AB INBEV: COMPANY SNAPSHOT
- TABLE 107. JBS S.A.: KEY EXECUTIVES
- TABLE 108. JBS S.A.: COMPANY SNAPSHOT
- TABLE 109. MONDELEZ: KEY EXECUTIVES
- TABLE 110. MONDELEZ: COMPANY SNAPSHOT
- TABLE 111. DANONE: KEY EXECUTIVES
- TABLE 112. DANONE: COMPANY SNAPSHOT
- TABLE 113. DIAGEO PLC: KEY EXECUTIVES
- TABLE 114. DIAGEO PLC: COMPANY SNAPSHOT
LIST OF FIGURES
- FIGURE 01. STAPLE FOOD MARKET, 2022-2032
- FIGURE 02. SEGMENTATION OF STAPLE FOOD MARKET,2022-2032
- FIGURE 03. TOP IMPACTING FACTORS IN STAPLE FOOD MARKET
- FIGURE 04. TOP INVESTMENT POCKETS IN STAPLE FOOD MARKET (2023-2032)
- FIGURE 05. BARGAINING POWER OF SUPPLIERS
- FIGURE 06. BARGAINING POWER OF BUYERS
- FIGURE 07. THREAT OF SUBSTITUTION
- FIGURE 08. THREAT OF SUBSTITUTION
- FIGURE 09. COMPETITIVE RIVALRY
- FIGURE 10. GLOBAL STAPLE FOOD MARKET:DRIVERS, RESTRAINTS AND OPPORTUNITIES
- FIGURE 11. IMPACT OF KEY REGULATION: STAPLE FOOD MARKET
- FIGURE 12. PATENT ANALYSIS BY COMPANY
- FIGURE 13. PATENT ANALYSIS BY COUNTRY
- FIGURE 14. STAPLE FOOD MARKET, BY PRODUCT TYPE, 2022 AND 2032(%)
- FIGURE 15. COMPARATIVE SHARE ANALYSIS OF STAPLE FOOD MARKET FOR CEREALS, BY COUNTRY 2022 AND 2032(%)
- FIGURE 16. COMPARATIVE SHARE ANALYSIS OF STAPLE FOOD MARKET FOR SUGAR, BY COUNTRY 2022 AND 2032(%)
- FIGURE 17. COMPARATIVE SHARE ANALYSIS OF STAPLE FOOD MARKET FOR ROOTS AND TUBER, BY COUNTRY 2022 AND 2032(%)
- FIGURE 18. COMPARATIVE SHARE ANALYSIS OF STAPLE FOOD MARKET FOR FRUIT, BY COUNTRY 2022 AND 2032(%)
- FIGURE 19. COMPARATIVE SHARE ANALYSIS OF STAPLE FOOD MARKET FOR VEGETABLES, BY COUNTRY 2022 AND 2032(%)
- FIGURE 20. COMPARATIVE SHARE ANALYSIS OF STAPLE FOOD MARKET FOR OIL, BY COUNTRY 2022 AND 2032(%)
- FIGURE 21. COMPARATIVE SHARE ANALYSIS OF STAPLE FOOD MARKET FOR OTHERS, BY COUNTRY 2022 AND 2032(%)
- FIGURE 22. STAPLE FOOD MARKET, BY NATURE, 2022 AND 2032(%)
- FIGURE 23. COMPARATIVE SHARE ANALYSIS OF STAPLE FOOD MARKET FOR ORGANIC, BY COUNTRY 2022 AND 2032(%)
- FIGURE 24. COMPARATIVE SHARE ANALYSIS OF STAPLE FOOD MARKET FOR CONVENTIONAL, BY COUNTRY 2022 AND 2032(%)
- FIGURE 25. STAPLE FOOD MARKET, BY DISTRIBUTION CHANNEL, 2022 AND 2032(%)
- FIGURE 26. COMPARATIVE SHARE ANALYSIS OF STAPLE FOOD MARKET FOR DIRECT-TO-CONSUMER (D2C), BY COUNTRY 2022 AND 2032(%)
- FIGURE 27. COMPARATIVE SHARE ANALYSIS OF STAPLE FOOD MARKET FOR RETAIL STORES, BY COUNTRY 2022 AND 2032(%)
- FIGURE 28. COMPARATIVE SHARE ANALYSIS OF STAPLE FOOD MARKET FOR WHOLESALE DISTRIBUTORS, BY COUNTRY 2022 AND 2032(%)
- FIGURE 29. COMPARATIVE SHARE ANALYSIS OF STAPLE FOOD MARKET FOR ONLINE RETAILERS, BY COUNTRY 2022 AND 2032(%)
- FIGURE 30. COMPARATIVE SHARE ANALYSIS OF STAPLE FOOD MARKET FOR OTHERS, BY COUNTRY 2022 AND 2032(%)
- FIGURE 31. STAPLE FOOD MARKET BY REGION, 2022 AND 2032(%)
- FIGURE 32. U.S. STAPLE FOOD MARKET, 2022-2032 ($BILLION)
- FIGURE 33. CANADA STAPLE FOOD MARKET, 2022-2032 ($BILLION)
- FIGURE 34. MEXICO STAPLE FOOD MARKET, 2022-2032 ($BILLION)
- FIGURE 35. GERMANY STAPLE FOOD MARKET, 2022-2032 ($BILLION)
- FIGURE 36. UK STAPLE FOOD MARKET, 2022-2032 ($BILLION)
- FIGURE 37. FRANCE STAPLE FOOD MARKET, 2022-2032 ($BILLION)
- FIGURE 38. SPAIN STAPLE FOOD MARKET, 2022-2032 ($BILLION)
- FIGURE 39. ITALY STAPLE FOOD MARKET, 2022-2032 ($BILLION)
- FIGURE 40. REST OF EUROPE STAPLE FOOD MARKET, 2022-2032 ($BILLION)
- FIGURE 41. CHINA STAPLE FOOD MARKET, 2022-2032 ($BILLION)
- FIGURE 42. JAPAN STAPLE FOOD MARKET, 2022-2032 ($BILLION)
- FIGURE 43. INDIA STAPLE FOOD MARKET, 2022-2032 ($BILLION)
- FIGURE 44. SOUTH KOREA STAPLE FOOD MARKET, 2022-2032 ($BILLION)
- FIGURE 45. AUSTRALIA STAPLE FOOD MARKET, 2022-2032 ($BILLION)
- FIGURE 46. REST OF ASIA-PACIFIC STAPLE FOOD MARKET, 2022-2032 ($BILLION)
- FIGURE 47. BRAZIL STAPLE FOOD MARKET, 2022-2032 ($BILLION)
- FIGURE 48. SOUTH AFRICA, STAPLE FOOD MARKET, 2022-2032 ($BILLION)
- FIGURE 49. UNITED ARAB EMIRATES STAPLE FOOD MARKET, 2022-2032 ($BILLION)
- FIGURE 50. SOUTH AFRICA STAPLE FOOD MARKET, 2022-2032 ($BILLION)
- FIGURE 51. REST OF LAMEA STAPLE FOOD MARKET, 2022-2032 ($BILLION)
- FIGURE 52. PRODUCT MAPPING OF TOP 10 PLAYERS
- FIGURE 53. COMPETITIVE DASHBOARD
- FIGURE 54. COMPETITIVE HEATMAP: STAPLE FOOD MARKET
- FIGURE 55. TOP PLAYER POSITIONING, 2022


