


 |
市场调查报告书
商品编码
1936055
全球国防引气系统市场:2026-2036Global Defense Bleed Air Systems Market 2026-2036 |
||||||
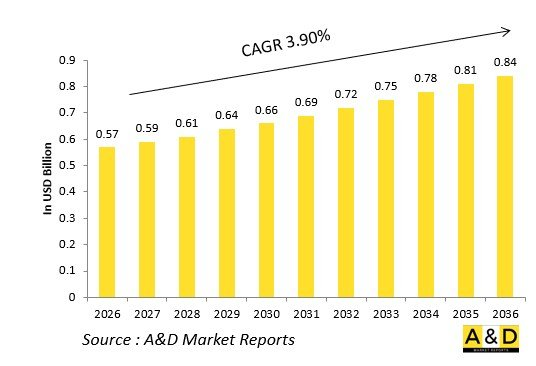
全球国防引气系统市场预计将从2026年的5.7亿美元成长到2036年的8.4亿美元,预测期间内复合年增长率(CAGR)为3.90%。
简介
全球国防引气系统市场利用涡轮压缩机,透过预冷器、压力调节器和截止阀驱动环境控制、引擎启动和武器舱操作。高压引气口驱动液压备用系统,而低压引气口则为座舱服和座舱盖供气。
市场趋势正朝着更电气化的飞机发展,以电动压缩机取代引气抽气以维持推力裕度。核心技术包括可变孔径预冷器、气动继电器和防污染歧管,可将热空气引导至机翼前缘。模组化阀组可根据任务剖面快速重新配置。
持续作战的地缘政治需求正在推动发展,优先考虑与自适应循环核心和定向能冷却相容的系统。开放式架构支援向气动-电动混合动力过渡。供应链的重点是高温管道和形状记忆合金致动器。在竞争格局中,霍尼韦尔、柯林斯太空和赛峰集团正在率先开发无引气版本。
国防引气系统:技术的影响
电动空气压缩完全取代了引气阀,并透过整合在机翼中的马达驱动客舱鼓风机和防冰垫,从而降低效率损失。可变速电动增压压缩机可依需提供压缩空气,避免了持续引气带来的损耗。
智慧型预冷器旁通阀可依即时热交换器温差调节燃油流量,防止待机期间过冷。形状记忆合金止回阀可自动密封受损管道,以维持压力完整性。整合式光纤温度感测器可在涡轮过热前触发全权限数位引擎控制系统 (FADEC) 关闭。
积层製造的旋流预冷器可在几吋厚的壳体内优化气流混合。带有自清洁涡流发生器的抗污染歧管可防止因霜冻造成的阻塞。混合架构可在引擎启动时保持引气,同时为辅助负载供电。
数位孪生技术可根据受损的压缩机图验证引气方案。陶瓷涂层阀门可抵抗合成燃料燃烧副产物的影响。这些创新在恢復推力的同时,也实现了全电动子系统。
国防引气系统的关键驱动因素
随着电气化程度的提高,需要向气动-电动混合动力系统过渡,以最大限度地减少引气效率的损失。第六代平台强调可变需求压缩,而非连续抽气。
永续性促使采用模组化阀组,以便更换阀芯。出口项目要求系统与各种煤油混合物相容。极寒环境部署需要可靠的防冰性能,同时不牺牲引擎功率。
预算压力推动了采用军用级加固的商用无引气衍生产品的发展。供应容忍度有助于应对钛合金管道短缺的问题。互通性使得整个舰队可以使用通用歧管。
定向能量冷却需要高品质流量的引气。这些因素将引气系统定位为一项过渡性技术。
本报告分析了全球国防引气系统市场,并总结了关键趋势、市场影响因素、关键技术及其影响、主要地区和国家的趋势以及市场机会分析。
目录
国防引气系统市场:目录
国防引气系统市场:报告定义
国防引气系统市场:细分
依平台
依应用
依来源
未来十年国防引气系统市场分析
国防引气系统市场成长细节、趋势变化、技术应用概述与市场状况吸引力
国防引气系统市场:技术
预计将影响市场的十大技术及其对整体市场的潜在影响
全球国防引气系统市场:预测
本报告详细涵盖了上述各细分市场未来十年的国防引气系统市场预测。
国防引气系统市场趋势与预测:依地区划分
本报告涵盖市场趋势、驱动因素、限制因素、挑战以及政治、经济、社会和技术因素。报告还提供了详细的区域市场预测和情境分析。区域分析最后包括主要公司概况、供应商状况和公司基准分析。目前市场规模是基于一切照旧情境估算的。
北美
驱动因素、限制因素与挑战
PEST分析
市场预测与情境分析
主要公司
供应商层级概览
公司标竿分析
欧洲
中东
亚太地区
南美洲
国防引气系统市场:国家分析
美国
国防项目
最新资讯
专利
当前市场技术成熟度
市场预测与情境分析
加拿大
义大利
法国
德国
荷兰
比利时
西班牙
瑞典
希腊
澳洲
南非
印度
中国
俄罗斯
韩国
日本
马来西亚
新加坡
巴西
国防引气系统市场:机会矩阵
国防引气系统市场:专家意见
结论
关于航空与国防市场报告
The Global Defense Bleed Air Systems Market is estimated at USD 0.57 billion in 2026, projected to grow to USD 0.84 billion by 2036 at a Compound Annual Growth Rate (CAGR) of 3.90% over the forecast period 2026-2036.
Introduction
The global Defense Bleed Air Systems market taps turbine compressors to drive environmental controls, engine starts, and weapons bay actuation through precoolers, pressure regulators, and shutoff valves. High-pressure taps power hydraulic backups while low-pressure stages feed cabin suits and canopies.
Market evolution tracks more-electric aircraft replacing bleed extraction with electrically driven compressors, preserving thrust margins. Core technologies include variable-orifice precoolers, pneumatic relays, and contamination-resistant manifolds routing hot air to leading edges. Modular valve stacks enable rapid reconfiguration for mission profiles.
Geopolitical demands for sustained operations drive development, prioritizing systems compatible with adaptive cycle cores and directed-energy cooling. Open architectures support hybrid pneumatic-electric transitions. Supply chains focus on high-temperature ducting and shape memory alloy actuators. Competition features Honeywell, Collins Aerospace, and Safran pioneering bleedless variants.
Technology Impact in Defense Bleed Air Systems
Electric air compression replaces bleed taps entirely, driving cabin blowers and anti-ice mats via wing-embedded motors, eliminating efficiency-robbing extraction. Variable-speed electric boost compressors deliver pressurized air on-demand versus continuous bleed penalty.
Smart precooler bypass valves modulate fuel flow based on real-time heat exchanger delta-T, preventing overcooling during loiter. Shape memory alloy check valves auto-seal damaged ducts, maintaining pressure integrity. Embedded fiber-optic temp sensors trigger FADEC shutdowns before turbine overtemps.
Additively manufactured swirl precoolers optimize airflow mixing within inches-thick envelopes. Contamination-resistant manifolds with self-cleaning vortex generators prevent icing blockages. Hybrid architectures retain bleed for engine starts while electrifying secondary loads.
Digital twins validate bleed schedules against battle-damaged compressor maps. Ceramic-coated valves withstand synthetic fuel combustion byproducts. These innovations reclaim thrust while enabling all-electric subsystems.
Key Drivers in Defense Bleed Air Systems
More-electric architectures demand hybrid pneumatic-electric transitions, minimizing bleed extraction efficiency losses. Sixth-generation platforms prioritize variable-demand compression versus continuous taps.
Sustainment favors modular valve stacks enabling cartridge swaps. Export programs require synthetic compatibility across kerosene blends. Arctic deployments mandate reliable anti-icing without engine power diversion.
Budget pressures drive commercial bleedless derivatives with mil-spec hardening. Supply resilience counters titanium duct shortages. Interoperability enables common manifolds across coalition fleets.
Directed-energy cooling requires high-mass flow extraction. These position bleed air as transitional technology.
Regional Trends in Defense Bleed Air Systems
North America leads F-35 sustainment, pioneering electric compression for STOVL profiles.
Europe upgrades Rafale/Typhoon manifolds for dispersed basing with synthetic fuels.
Asia-Pacific surges with indigenous fighters-India's AMCA, China's J-35-prioritizing high-altitude extraction.
Middle East adapts precoolers for desert overtemps.
Russia hardens systems for Su-57 sustained afterburner.
South Korea integrates KF-21 with hybrid electric-pneumatic.
Trends favor electric replacement; Asia-Pacific captures growth.
Key Defense Bleed Air Systems Programs
F135 bleedless electric compression powers STOVL lift systems without core penalty.
NGAD variable extraction syncs with adaptive third-stream cycles.
EJ200 upgrades deliver supercruise bleed via optimized low-pressure taps.
AMCA equips indigenous electric boost for weapons bay actuation.
F119 systems enable stealth missions with minimized infrared extraction.
Rafale M88 integrates carrier catapult pneumatic assist.
Su-57 AL-41F1 powers 3D thrust vectoring hydraulics.
T-50 FADEC-controlled precooling prevents turbine overtemperature.
Table of Contents
Defense Bleed Air Systems Market - Table of Contents
Defense Bleed Air Systems Market Report Definition
Defense Bleed Air Systems Market Segmentation
By Platform
By Application
By Source
Defense Bleed Air Systems Market Analysis for next 10 Years
The 10-year Defense Bleed Air Systems market analysis would give a detailed overview of Defense Bleed Air Systems market growth, changing dynamics, technology adoption overviews and the overall market attractiveness is covered in this chapter.
Market Technologies of Defense Bleed Air Systems Market
This segment covers the top 10 technologies that is expected to impact this market and the possible implications these technologies would have on the overall market.
Global Defense Bleed Air Systems Market Forecast
The 10-year Defense Bleed Air Systems market forecast of this market is covered in detailed across the segments which are mentioned above.
Regional Defense Bleed Air Systems Market Trends & Forecast
The regional counter drone market trends, drivers, restraints and Challenges of this market, the Political, Economic, Social and Technology aspects are covered in this segment. The market forecast and scenario analysis across regions are also covered in detailed in this segment. The last part of the regional analysis includes profiling of the key companies, supplier landscape and company benchmarking. The current market size is estimated based on the normal scenario.
North America
Drivers, Restraints and Challenges
PEST
Market Forecast & Scenario Analysis
Key Companies
Supplier Tier Landscape
Company Benchmarking
Europe
Middle East
APAC
South America
Country Analysis of Defense Bleed Air Systems Market
This chapter deals with the key defense programs in this market, it also covers the latest news and patents which have been filed in this market. Country level 10 year market forecast and scenario analysis are also covered in this chapter.
US
Defense Programs
Latest News
Patents
Current levels of technology maturation in this market
Market Forecast & Scenario Analysis
Canada
Italy
France
Germany
Netherlands
Belgium
Spain
Sweden
Greece
Australia
South Africa
India
China
Russia
South Korea
Japan
Malaysia
Singapore
Brazil
Opportunity Matrix for Defense Bleed Air Systems Market
The opportunity matrix helps the readers understand the high opportunity segments in this market.
Expert Opinions on Defense Bleed Air Systems Market Report
Hear from our experts their opinion of the possible analysis for this market.
Conclusions
About Aviation and Defense Market Reports
List of Tables
- Table 1: 10 Year Market Outlook, 2026-2036
- Table 2: Drivers, Impact Analysis, North America
- Table 3: Restraints, Impact Analysis, North America
- Table 4: Challenges, Impact Analysis, North America
- Table 5: Drivers, Impact Analysis, Europe
- Table 6: Restraints, Impact Analysis, Europe
- Table 7: Challenges, Impact Analysis, Europe
- Table 8: Drivers, Impact Analysis, Middle East
- Table 9: Restraints, Impact Analysis, Middle East
- Table 10: Challenges, Impact Analysis, Middle East
- Table 11: Drivers, Impact Analysis, APAC
- Table 12: Restraints, Impact Analysis, APAC
- Table 13: Challenges, Impact Analysis, APAC
- Table 14: Drivers, Impact Analysis, South America
- Table 15: Restraints, Impact Analysis, South America
- Table 16: Challenges, Impact Analysis, South America
- Table 17: Scenario Analysis, Scenario 1, By Source, 2026-2036
- Table 18: Scenario Analysis, Scenario 1, By Platform, 2026-2036
- Table 19: Scenario Analysis, Scenario 1, By Region, 2026-2036
- Table 20: Scenario Analysis, Scenario 2, By Source, 2026-2036
- Table 21: Scenario Analysis, Scenario 2, By Platform, 2026-2036
- Table 22: Scenario Analysis, Scenario 2, By Region, 2026-2036
List of Figures
- Figure 1: Global Defense Bleed Air Systems Market Forecast, 2026-2036
- Figure 2: Global Defense Bleed Air Systems Market Forecast, By Source, 2026-2036
- Figure 3: Global Defense Bleed Air Systems Market Forecast, By Platform, 2026-2036
- Figure 4: Global Defense Bleed Air Systems Market Forecast, By Region, 2026-2036
- Figure 5: North America, Defense Bleed Air Systems Market, Forecast, 2026-2036
- Figure 6: Europe, Defense Bleed Air Systems Market, Forecast, 2026-2036
- Figure 7: Middle East, Defense Bleed Air Systems Market, Forecast, 2026-2036
- Figure 8: APAC, Defense Bleed Air Systems Market, Forecast, 2026-2036
- Figure 9: South America, Defense Bleed Air Systems Market, Forecast, 2026-2036
- Figure 10: United States, Defense Bleed Air Systems Market, Technology Maturation, 2026-2036
- Figure 11: United States, Defense Bleed Air Systems Market, Forecast, 2026-2036
- Figure 12: Canada, Defense Bleed Air Systems Market, Technology Maturation, 2026-2036
- Figure 13: Canada, Defense Bleed Air Systems Market, Forecast, 2026-2036
- Figure 14: Italy, Defense Bleed Air Systems Market, Technology Maturation, 2026-2036
- Figure 15: Italy, Defense Bleed Air Systems Market, Market Forecast, 2026-2036
- Figure 16: France, Defense Bleed Air Systems Market, Technology Maturation, 2026-2036
- Figure 17: France, Defense Bleed Air Systems Market, Market Forecast, 2026-2036
- Figure 18: Germany, Defense Bleed Air Systems Market, Technology Maturation, 2026-2036
- Figure 19: Germany, Defense Bleed Air Systems Market, Market Forecast, 2026-2036
- Figure 20: Netherlands, Defense Bleed Air Systems Market, Technology Maturation, 2026-2036
- Figure 21: Netherlands, Defense Bleed Air Systems Market, Market Forecast, 2026-2036
- Figure 22: Belgium, Defense Bleed Air Systems Market, Technology Maturation, 2026-2036
- Figure 23: Belgium, Defense Bleed Air Systems Market, Market Forecast, 2026-2036
- Figure 24: Spain, Defense Bleed Air Systems Market, Technology Maturation, 2026-2036
- Figure 25: Spain, Defense Bleed Air Systems Market, Market Forecast, 2026-2036
- Figure 26: Sweden, Defense Bleed Air Systems Market, Technology Maturation, 2026-2036
- Figure 27: Sweden, , Market Forecast, 2026-2036
- Figure 28: Brazil, Defense Bleed Air Systems Market, Technology Maturation, 2026-2036
- Figure 29: Brazil, Defense Bleed Air Systems Market, Market Forecast, 2026-2036
- Figure 30: Australia, Defense Bleed Air Systems Market, Technology Maturation, 2026-2036
- Figure 31: Australia, Defense Bleed Air Systems Market, Market Forecast, 2026-2036
- Figure 32: India, Defense Bleed Air Systems Market, Technology Maturation, 2026-2036
- Figure 33: India, Defense Bleed Air Systems Market, Market Forecast, 2026-2036
- Figure 34: China, Defense Bleed Air Systems Market, Technology Maturation, 2026-2036
- Figure 35: China, Defense Bleed Air Systems Market, Market Forecast, 2026-2036
- Figure 36: Saudi Arabia, Defense Bleed Air Systems Market, Technology Maturation, 2026-2036
- Figure 37: Saudi Arabia, Defense Bleed Air Systems Market, Market Forecast, 2026-2036
- Figure 38: South Korea, Defense Bleed Air Systems Market, Technology Maturation, 2026-2036
- Figure 39: South Korea, Defense Bleed Air Systems Market, Market Forecast, 2026-2036
- Figure 40: Japan, Defense Bleed Air Systems Market, Technology Maturation, 2026-2036
- Figure 41: Japan, Defense Bleed Air Systems Market, Market Forecast, 2026-2036
- Figure 42: Malaysia, Defense Bleed Air Systems Market, Technology Maturation, 2026-2036
- Figure 43: Malaysia, Defense Bleed Air Systems Market, Market Forecast, 2026-2036
- Figure 44: Singapore, Defense Bleed Air Systems Market, Technology Maturation, 2026-2036
- Figure 45: Singapore, Defense Bleed Air Systems Market, Market Forecast, 2026-2036
- Figure 46: United Kingdom, Defense Bleed Air Systems Market, Technology Maturation, 2026-2036
- Figure 47: United Kingdom, Defense Bleed Air Systems Market, Market Forecast, 2026-2036
- Figure 48: Opportunity Analysis, Defense Bleed Air Systems Market, By Source (Cumulative Market), 2026-2036
- Figure 49: Opportunity Analysis, Defense Bleed Air Systems Market, By Source (CAGR), 2026-2036
- Figure 50: Opportunity Analysis, Defense Bleed Air Systems Market, By (Cumulative Market), 2026-2036
- Figure 51: Opportunity Analysis, Defense Bleed Air Systems Market, By Platform(CAGR), 2026-2036
- Figure 52: Opportunity Analysis, Defense Bleed Air Systems Market, By Region (Cumulative Market), 2026-2036
- Figure 53: Opportunity Analysis, Defense Bleed Air Systems Market, By Region (CAGR), 2026-2036
- Figure 54: Scenario Analysis, Defense Bleed Air Systems Market, Cumulative Market, 2026-2036
- Figure 55: Scenario Analysis, Defense Bleed Air Systems Market, Global Market, 2026-2036
- Figure 56: Scenario 1, Defense Bleed Air Systems Market, Total Market, 2026-2036
- Figure 57: Scenario 1, Defense Bleed Air Systems Market, By Source, 2026-2036
- Figure 58: Scenario 1, Defense Bleed Air Systems Market, By Platform, 2026-2036
- Figure 59: Scenario 1, Defense Bleed Air Systems Market, By Region, 2026-2036
- Figure 60: Scenario 2, Defense Bleed Air Systems Market, Total Market, 2026-2036
- Figure 61: Scenario 2, Defense Bleed Air Systems Market, By Source, 2026-2036
- Figure 62: Scenario 2, Defense Bleed Air Systems Market, By Platform, 2026-2036
- Figure 63: Scenario 2, Defense Bleed Air Systems Market, By Region, 2026-2036
- Figure 64: Company Benchmark, Defense Bleed Air Systems Market, 2026-2036


