


 |
市场调查报告书
商品编码
1699527
按资料来源、应用程式和地区分類的客户旅程分析市场Customer Journey Analytics Market, By Data Source, By Application, By Geography |
||||||
预计 2025 年全球客户旅程分析市场价值将达到 179.1 亿美元,到 2032 年将达到 470.6 亿美元,2025 年至 2032 年的复合年增长率为 14.8%。
| 报告范围 | 报告详细信息 | ||
|---|---|---|---|
| 基准年 | 2024 | 2025年的市场规模 | 179.1亿美元 |
| 效能数据 | 从2020年到2024年 | 预测期 | 2025年至2032年 |
| 预测期:2025-2032年复合年增长率: | 14.80% | 2032年价值预测 | 470.6亿美元 |
近年来,全球客户旅程分析市场取得了巨大的成长。客户旅程分析是指在多个管道中绘製客户行为和互动,以获得有关客户如何完成购买过程的宝贵见解。数位技术的日益普及使可用的客户资料的数量和种类呈指数级增长。公司正在使用客户旅程分析解决方案来收集和分析大量数据,以获得对客户的单一视图并发现提高满意度的机会。不断增长的客户经验改善需求、对全通路参与策略的重视以及衡量行销支出投资回报率(ROI) 的能力是推动该市场需求的关键因素。然而,资料隐私法规为分析解决方案提供者带来了一些挑战。
市场动态:
各行各业的快速数位化正在产生大量的客户数据,需要使用先进的技术进行处理和分析。一个主要的成长要素是越来越多地采用分析工具来了解客户行为模式并推动个人化参与。然而,对资料安全的担忧和熟练专业人员的短缺带来了挑战。市场先驱者正专注于开发围绕社交媒体互动和行动应用程式使用模式的新功能。人工智慧和机器学习等新技术融入旅程分析平台也正在扩大商业机会。由于分析供应商范围广泛且企业快速采用,北美目前在收益占有率方面占据市场主导地位。然而,由于数位转型措施的增加,亚太地区的客户旅程分析市场正迅速获得关注。
本研究的主要特点
本报告对全球客户旅程分析市场进行了详细分析,并以 2024 年为基准年,展示了预测期(2025-2032 年)的市场规模和年复合成长率(CAGR%)。
它还强调了各个领域的潜在商机,并说明了该市场的有吸引力的投资提案矩阵。
它还提供了有关市场驱动因素、限制因素、机会、新产品发布和核准、市场趋势、区域前景和主要企业采用的竞争策略的重要见解。
全球客户旅程分析市场的主要企业是根据公司亮点、产品系列、关键亮点、财务绩效和策略等参数进行的分析。
研究涉及的主要企业包括 Adobe Inc.、Salesforce.com, Inc.、IBM Corporation、SAP SE、Microsoft Corporation、Oracle Corporation、NICE Ltd.、Verint Systems Inc.、Pointillist、ClickFox、Kitewheel、Quadient、Thunderhead、Genesys 和 Servion Global Solutions。
本报告的见解将使负责人和公司经营团队能够就未来的产品发布、类型升级、市场扩张和行销策略做出明智的决策。
全球客户旅程分析市场报告针对该行业的各个相关人员,包括投资者、供应商、产品製造商、经销商、新进业者和金融分析师。
可以透过用于分析全球客户旅程分析市场的各种策略矩阵来促进相关人员的决策。
目录
第一章 调查目的与前提条件
- 研究目标
- 先决条件
- 简称
第二章 市场展望
- 报告描述
- 市场定义和范围
- 执行摘要
第三章市场动态、法规与趋势分析
- 市场动态
- 影响分析
- 主要亮点
- 监管情景
- 产品发布/核准
- PEST分析
- 波特分析
- 市场机会
- 监管情景
- 主要进展
- 产业趋势
4. 2020 年至 2032 年全球顾客旅程分析市场(依资料来源)
- 网路
- 社群媒体
- 智慧型手机
- 电子邮件
5. 2020 年至 2032 年全球顾客旅程分析市场(按应用划分)
- 客户体验管理
- 客户细分与定位
- 品牌管理
- 其他的
6. 2020 年至 2032 年全球顾客旅程分析市场(按地区)
- 北美洲
- 拉丁美洲
- 欧洲
- 亚太地区
- 中东
- 非洲
第七章竞争格局
- Adobe Inc.
- Salesforce.com, Inc.
- IBM Corporation
- SAP SE
- Microsoft Corporation
- Oracle Corporation
- NICE Ltd.
- Verint Systems Inc.
- Pointillist
- ClickFox
- Kitewheel
- Quadient
- Thunderhead
- Genesys
- Servion Global Solutions
第 8 章分析师建议
- 命运之轮
- 分析师观点
- 一致的机会图
第九章参考文献与调查方法
- 参考
- 调查方法
- 关于出版商
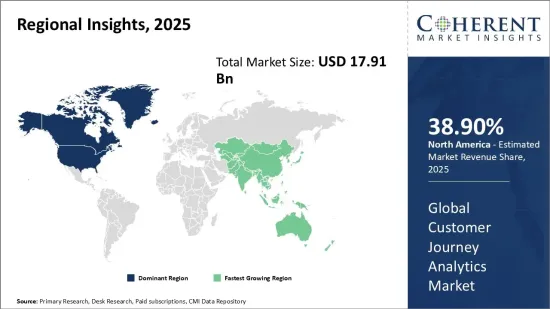
Global Customer Journey Analytics Market is estimated to be valued at US$ 17.91 Bn in 2025 and is expected to reach US$ 47.06 Bn by 2032, growing at a compound annual growth rate (CAGR) of 14.8% from 2025 to 2032.
| Report Coverage | Report Details | ||
|---|---|---|---|
| Base Year: | 2024 | Market Size in 2025: | USD 17.91 Bn |
| Historical Data for: | 2020 To 2024 | Forecast Period: | 2025 To 2032 |
| Forecast Period 2025 to 2032 CAGR: | 14.80% | 2032 Value Projection: | USD 47.06 Bn |
The global customer journey analytics market has been gaining significant traction over the past few years. Customer journey analytics refers to mapping out customer behavior and interactions across multiple channels to gain valuable insights into how customers move through the buying process. Rising adoption of digital technologies has dramatically increased the volume and variety of customer data available. Businesses are leveraging customer journey analytics solutions to collect and analyze this huge trove of data to gain a unified view of the customer and identify opportunities to improve satisfaction levels. Growing need for enhanced customer experience, focus on omni-channel engagement strategies, and ability to measure Return on Investment (ROI) of marketing spend are some of the key factors fueling demand in this market. However, data privacy regulations pose challenges for analytics solution providers to some extent.
Market Dynamics:
Rapid digitalization across industries has created an abundance of customer data that need to be processed and analyzed using advanced technologies. Rising adoption of analytics tools to tap into customer behavioral patterns and drive personalized engagements is a major growth driver. However, data security concerns and lack of skilled professionals pose challenges. Market players are focusing on developing new capabilities around social media interactions and mobile apps usage patterns. Integration of emerging technologies, such as artificial intelligence and machine learning into journey analytics platforms, is also expanding business opportunities. North America currently dominates the market in terms of revenue share owing to a wide presence of analytics vendors and early adoption by businesses. However, the Asia Pacific customer journey analytics market is gaining traction rapidly with growing digital transformation initiatives.
Key Features of the Study:
This report provides in-depth analysis of the global customer journey analytics market, and provides market size (US$ Billion) and compound annual growth rate (CAGR%) for the forecast period (2025-2032), considering 2024 as the base year
It elucidates potential revenue opportunities across different segments and explains attractive investment proposition matrices for this market
This study also provides key insights about market drivers, restraints, opportunities, new product launches or approvals, market trends, regional outlook, and competitive strategies adopted by key players
It profiles key players in the global customer journey analytics market based on the following parameters - company highlights, products portfolio, key highlights, financial performance, and strategies
Key companies covered as a part of this study include Adobe Inc., Salesforce.com, Inc., IBM Corporation, SAP SE, Microsoft Corporation, Oracle Corporation, NICE Ltd., Verint Systems Inc., Pointillist, ClickFox, Kitewheel, Quadient, Thunderhead, Genesys, and Servion Global Solutions
Insights from this report would allow marketers and the management authorities of the companies to make informed decisions regarding their future product launches, type up-gradation, market expansion, and marketing tactics
The global customer journey analytics market report caters to various stakeholders in this industry including investors, suppliers, product manufacturers, distributors, new entrants, and financial analysts
Stakeholders would have ease in decision-making through various strategy matrices used in analyzing the global customer journey analytics market
Market Segmentation
- Data Source Insights (Revenue, USD Bn, 2020 - 2032)
- Web
- Social Media
- Mobile
- Application Insights (Revenue, USD Bn, 2020 - 2032)
- Customer Experience Management
- Customer Segmentation and Targeting
- Brand Management
- Others
- Regional Insights (Revenue, USD Bn, 2020 - 2032)
- North America
- U.S.
- Canada
- Latin America
- Brazil
- Argentina
- Mexico
- Rest of Latin America
- Europe
- Germany
- U.K.
- Spain
- France
- Italy
- Russia
- Rest of Europe
- Asia Pacific
- China
- India
- Japan
- Australia
- South Korea
- ASEAN
- Rest of Asia Pacific
- Middle East
- GCC Countries
- Israel
- Rest of Middle East
- Africa
- South Africa
- North Africa
- Central Africa
- Key Players Insights
- Adobe Inc.
- Salesforce.com, Inc.
- IBM Corporation
- SAP SE
- Microsoft Corporation
- Oracle Corporation
- NICE Ltd.
- Verint Systems Inc.
- Pointillist
- ClickFox
- Kitewheel
- Quadient
- Thunderhead
- Genesys
- Servion Global Solutions
Table of Contents
1. Research Objectives and Assumptions
- Research Objectives
- Assumptions
- Abbreviations
2. Market Purview
- Report Description
- Market Definition and Scope
- Executive Summary
- Global Customer Journey Analytics Market, By Data Source
- Global Customer Journey Analytics Market, By Application
- Global Customer Journey Analytics Market, By Region
3. Market Dynamics, Regulations, and Trends Analysis
- Market Dynamics
- Impact Analysis
- Key Highlights
- Regulatory Scenario
- Product Launches/Approvals
- PEST Analysis
- PORTER's Analysis
- Market Opportunities
- Regulatory Scenario
- Key Developments
- Industry Trends
4. Global Customer Journey Analytics Market, By Data Source, 2020-2032, (USD Bn)
- Introduction
- Market Share Analysis, 2025 and 2032 (%)
- Y-o-Y Growth Analysis, 2021 - 2032
- Segment Trends
- Web
- Introduction
- Market Size and Forecast, and Y-o-Y Growth, 2020-2032, (USD Bn)
- Social Media
- Introduction
- Market Size and Forecast, and Y-o-Y Growth, 2020-2032, (USD Bn)
- Mobile
- Introduction
- Market Size and Forecast, and Y-o-Y Growth, 2020-2032, (USD Bn)
- Email
- Introduction
- Market Size and Forecast, and Y-o-Y Growth, 2020-2032, (USD Bn)
5. Global Customer Journey Analytics Market, By Application, 2020-2032, (USD Bn)
- Introduction
- Market Share Analysis, 2025 and 2032 (%)
- Y-o-Y Growth Analysis, 2021 - 2032
- Segment Trends
- Customer Experience Management
- Introduction
- Market Size and Forecast, and Y-o-Y Growth, 2020-2032, (USD Bn)
- Customer Segmentation and Targeting
- Introduction
- Market Size and Forecast, and Y-o-Y Growth, 2020-2032, (USD Bn)
- Brand Management
- Introduction
- Market Size and Forecast, and Y-o-Y Growth, 2020-2032, (USD Bn)
- Others
- Introduction
- Market Size and Forecast, and Y-o-Y Growth, 2020-2032, (USD Bn)
6. Global Customer Journey Analytics Market, By Region, 2020 - 2032, Value (USD Bn)
- Introduction
- Market Share (%) Analysis, 2025, 2028 & 2032, Value (USD Bn)
- Market Y-o-Y Growth Analysis (%), 2021 - 2032, Value (USD Bn)
- Regional Trends
- North America
- Introduction
- Market Size and Forecast, By Data Source, 2020 - 2032, Value (USD Bn)
- Market Size and Forecast, By Application, 2020 - 2032, Value (USD Bn)
- Market Size and Forecast, By Country, 2020 - 2032, Value (USD Bn)
- U.S.
- Canada
- Latin America
- Introduction
- Market Size and Forecast, By Data Source, 2020 - 2032, Value (USD Bn)
- Market Size and Forecast, By Application, 2020 - 2032, Value (USD Bn)
- Market Size and Forecast, By Country, 2020 - 2032, Value (USD Bn)
- Brazil
- Argentina
- Mexico
- Rest of Latin America
- Europe
- Introduction
- Market Size and Forecast, By Data Source, 2020 - 2032, Value (USD Bn)
- Market Size and Forecast, By Application, 2020 - 2032, Value (USD Bn)
- Market Size and Forecast, By Country, 2020 - 2032, Value (USD Bn)
- Germany
- U.K.
- Spain
- France
- Italy
- Russia
- Rest of Europe
- Asia Pacific
- Introduction
- Market Size and Forecast, By Data Source, 2020 - 2032, Value (USD Bn)
- Market Size and Forecast, By Application, 2020 - 2032, Value (USD Bn)
- Market Size and Forecast, By Country, 2020 - 2032, Value (USD Bn)
- China
- India
- Japan
- Australia
- South Korea
- ASEAN
- Rest of Asia Pacific
- Middle East
- Introduction
- Market Size and Forecast, By Data Source, 2020 - 2032, Value (USD Bn)
- Market Size and Forecast, By Application, 2020 - 2032, Value (USD Bn)
- Market Size and Forecast, By Country, 2020 - 2032, Value (USD Bn)
- GCC Countries
- Israel
- Rest of Middle East
- Africa
- Introduction
- Market Size and Forecast, By Data Source, 2020 - 2032, Value (USD Bn)
- Market Size and Forecast, By Application, 2020 - 2032, Value (USD Bn)
- Market Size and Forecast, By Country/Region, 2020 - 2032, Value (USD Bn)
- South Africa
- North Africa
- Central Africa
7. Competitive Landscape
- Adobe Inc.
- Company Highlights
- Product Portfolio
- Key Developments
- Financial Performance
- Strategies
- Salesforce.com, Inc.
- Company Highlights
- Product Portfolio
- Key Developments
- Financial Performance
- Strategies
- IBM Corporation
- Company Highlights
- Product Portfolio
- Key Developments
- Financial Performance
- Strategies
- SAP SE
- Company Highlights
- Product Portfolio
- Key Developments
- Financial Performance
- Strategies
- Microsoft Corporation
- Company Highlights
- Product Portfolio
- Key Developments
- Financial Performance
- Strategies
- Oracle Corporation
- Company Highlights
- Product Portfolio
- Key Developments
- Financial Performance
- Strategies
- NICE Ltd.
- Company Highlights
- Product Portfolio
- Key Developments
- Financial Performance
- Strategies
- Verint Systems Inc.
- Company Highlights
- Product Portfolio
- Key Developments
- Financial Performance
- Strategies
- Pointillist
- ClickFox
- Kitewheel
- Quadient
- Thunderhead
- Genesys
- Servion Global Solutions
8. Analyst Recommendations
- Wheel of Fortune
- Analyst View
- Coherent Opportunity Map
9. References and Research Methodology
- References
- Research Methodology
- About us
 客户旅程管理市场:按组件、部署类型、组织规模和产业划分-2026-2032年全球市场预测
 客户旅程分析市场报告:按组件、触点、部署类型、组织规模、应用、产业垂直领域和地区划分(2026-2034 年)
 2026年全球客户旅程分析市场报告
 客户旅程分析市场分析及预测(至 2035 年):按类型、产品类型、服务、技术、组件、应用、部署类型、最终用户和解决方案划分
 全球客户体验分析市场规模、份额、趋势和成长分析报告(2026-2034)客户旅程分析市场规模、占有率、成长及全球产业分析:依类型、应用和地区划分的洞察与未来预测(2026-2034 年)
 客户旅程分析市场 - 全球产业规模、份额、趋势、机会和预测(按组件、应用、触点、产业垂直领域、地区和竞争格局划分,2021-2031 年预测)日本客户旅程分析市场报告:按组件、触点、实施类型、组织规模、应用、产业和地区划分(2026-2034 年)
 客户旅程分析市场规模、份额、成长分析(按组件、按组织规模、按部署模式、按资料来源、按应用、按垂直行业和按地区)—2025 年至 2032 年行业预测