


 |
市场调查报告书
商品编码
1665376
硅基 OLED (OLEDoS) 市场机会、成长动力、产业趋势分析及 2025 - 2034 年预测OLED-on-Silicon (OLEDoS) Market Opportunity, Growth Drivers, Industry Trend Analysis, and Forecast 2025 - 2034 |
||||||
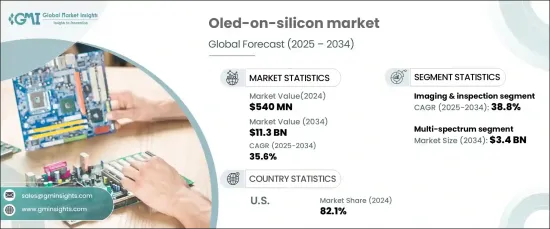
2024 年全球硅基 OLED 市场估值达到 5.4 亿美元,预计将经历显着增长,2025 年至 2034 年的复合年增长率为 35.6%。 这一增长是由对提供卓越清晰度、鲜艳色彩和清晰视觉效果的高性能显示器日益增长的需求推动的。 OLEDoS 技术凭藉其卓越的像素密度和出色的影像质量,在智慧型手机、穿戴式装置和 AR/VR 产品等各种应用领域中广泛应用。
消费性电子产品的小型化、整合化趋势日益增强,进一步加速了市场的扩张。随着设备变得越来越紧凑、轻巧和便携,OLEDoS 成为一种理想的显示解决方案,提供无与伦比的性能而不影响品质。其超薄紧凑的设计非常适合现代消费性电子产品,因为节省空间的组件至关重要。
| 市场范围 | |
|---|---|
| 起始年份 | 2024 |
| 预测年份 | 2025-2034 |
| 起始值 | 5.4亿美元 |
| 预测值 | 113亿美元 |
| 复合年增长率 | 35.6% |
依光谱细分,硅基 OLED 市场涵盖近红外线、红外线、紫外线、多光谱等。预计到 2034 年,多光谱领域的估值将达到 34 亿美元。这些显示器具有出色的亮度、色彩精确度和视觉性能,满足游戏、汽车和医疗保健等行业对生动细緻的视觉效果至关重要的需求。
根据应用,市场分为显示系统、感测和检测、成像和检查、光通讯等。其中,成像和检测领域有望实现令人瞩目的成长,预计到 2034 年将实现 38.8% 的复合年增长率,成为成长最快的类别。然而,由于消费性电子产品和 AR/VR 设备对节能高效能显示器的需求不断增长,显示系统仍占据相当大的市场份额。 OLEDoS 技术以提供丰富的色彩、增强的亮度和低功耗而着称,使其成为紧凑型高解析度显示器系统的首选解决方案。
2024年,美国硅基OLED市场占有率将达到惊人的82.1%,凸显了其主导地位。对最先进的消费性电子产品和 AR/VR 设备的强劲需求增强了这一领导地位。强劲的研发投入,加上政府支持永续和节能技术的倡议,进一步推动了美国对 OLEDoS 的采用,巩固了其在全球市场主要参与者的地位。
目录
第 1 章:方法论与范围
- 市场范围和定义
- 基础估算与计算
- 预测计算
- 资料来源
- 基本的
- 次要
- 付费来源
- 公共资源
第 2 章:执行摘要
第 3 章:产业洞察
- 产业生态系统分析
- 影响价值链的因素
- 利润率分析
- 中断
- 未来展望
- 製造商
- 经销商
- 供应商概况
- 利润率分析
- 重要新闻及倡议
- 监管格局
- 衝击力
- 成长动力
- 高解析度显示器需求不断成长
- 消费性电子产品的小型化和整合化
- 提高效能和成本效率
- 柔性和透明显示技术的进步
- 产业领袖和技术合作伙伴的支持
- 产业陷阱与挑战
- 製造成本高且复杂
- 市场渗透率与消费者认知度有限
- 成长动力
- 成长潜力分析
- 波特的分析
- PESTEL 分析
第四章:竞争格局
- 介绍
- 公司市占率分析
- 竞争定位矩阵
- 战略展望矩阵
第 5 章:市场估计与预测:按光谱,2021 年至 2034 年
- 主要趋势
- 可见光谱(RGB、全彩显示器)
- 近红外线(NIR,700-1400 nm)
- 红外线(IR,700-3000 nm)
- 紫外线(UV,<400 nm)
- 多光谱(可见光 + 红外线 + 近红外线)
- 其他的
第 6 章:市场估计与预测:按应用,2021 年至 2034 年
- 主要趋势
- 显示系统
- 感测与检测
- 影像与检查
- 光通讯
- 其他的
第 7 章:市场估计与预测:依最终用途,2021 年至 2034 年
- 主要趋势
- 航太和国防
- 消费性电子产品
- 工业和製造业
- 医疗保健
- 汽车
- 其他的
第 8 章:市场估计与预测:按地区,2021 年至 2034 年
- 主要趋势
- 北美洲
- 我们
- 加拿大
- 欧洲
- 英国
- 德国
- 法国
- 义大利
- 西班牙
- 俄罗斯
- 亚太地区
- 中国
- 印度
- 日本
- 韩国
- 澳洲
- 拉丁美洲
- 巴西
- 墨西哥
- 中东及非洲
- 南非
- 沙乌地阿拉伯
- 阿联酋
第九章:公司简介
- China Star Optoelectronics Technology (CSOT)
- eMagin Corporation
- Himax Technologies, Inc.
- HOLOEYE Photonics AG
- Innolux Corporation
- JDI (Japan Display Inc.)
- Kopin Corporation
- LG Display Co., Ltd.
- Olightek
- Pixelligent Technologies LLC
- Raystar Optronics Inc.
- Ritek Corporation
- Samsung Electronics Co., Ltd.
- SeeYA Technology
- SiliconCore Technology Inc.
- Sony Corporation
- Tridonic GmbH & Co. KG
- Visionox
- Winstar Display Co., Ltd.
- WiseChip Semiconductor Inc.
The Global OLED-On-Silicon Market achieved a valuation of USD 540 million in 2024 and is projected to experience remarkable growth, registering a CAGR of 35.6% from 2025 to 2034. This surge is propelled by the escalating demand for high-performance displays that deliver exceptional clarity, vibrant colors, and sharp visuals. OLEDoS technology is gaining widespread adoption across diverse applications, including smartphones, wearable devices, and AR/VR products, thanks to its superior pixel density and outstanding image quality.
The growing trend toward miniaturization and integration in consumer electronics is further accelerating the market's expansion. As devices become increasingly compact, lightweight, and portable, OLEDoS emerges as an ideal display solution, offering unparalleled performance without compromising quality. Its ultra-thin and compact design is perfectly suited for modern consumer gadgets, where space-saving components are paramount.
| Market Scope | |
|---|---|
| Start Year | 2024 |
| Forecast Year | 2025-2034 |
| Start Value | $540 Million |
| Forecast Value | $11.3 Billion |
| CAGR | 35.6% |
Segmented by light spectrum, the OLED-on-Silicon market encompasses near-infrared, infrared, ultraviolet, multi-spectrum, and others. The multi-spectrum segment is anticipated to reach a valuation of USD 3.4 billion by 2034. Meanwhile, the visible spectrum segment is set to dominate the market, driven by its extensive use in high-resolution displays for virtual and augmented reality devices, as well as consumer electronics. These displays deliver superior brightness, color accuracy, and visual performance, meeting the needs of industries such as gaming, automotive, and healthcare, where vibrant and detailed visuals are critical.
In terms of application, the market is divided into display systems, sensing and detection, imaging and inspection, optical communication, and others. Among these, the imaging and inspection segment is poised for impressive growth, projected to achieve a CAGR of 38.8% through 2034, making it the fastest-growing category. Display systems, however, continue to hold a significant share of the market, fueled by the rising demand for energy-efficient and high-performance displays in consumer electronics and AR/VR devices. OLEDoS technology distinguishes itself by delivering rich colors, enhanced brightness, and low power consumption, making it the go-to solution for compact and high-resolution display systems.
The U.S. OLED-on-Silicon market claimed an impressive 82.1% share in 2024, underscoring its dominant position. This leadership is bolstered by strong demand for state-of-the-art consumer electronics and AR/VR devices. Robust investments in research and development, coupled with government initiatives supporting sustainable and energy-efficient technologies, are further driving the adoption of OLEDoS in the U.S., solidifying its status as a key player in the global market.
Table of Contents
Chapter 1 Methodology & Scope
- 1.1 Market scope & definitions
- 1.2 Base estimates & calculations
- 1.3 Forecast calculations
- 1.4 Data sources
- 1.4.1 Primary
- 1.4.2 Secondary
- 1.4.2.1 Paid sources
- 1.4.2.2 Public sources
Chapter 2 Executive Summary
- 2.1 Industry synopsis, 2021-2034
Chapter 3 Industry Insights
- 3.1 Industry ecosystem analysis
- 3.1.1 Factor affecting the value chain
- 3.1.2 Profit margin analysis
- 3.1.3 Disruptions
- 3.1.4 Future outlook
- 3.1.5 Manufacturers
- 3.1.6 Distributors
- 3.2 Supplier landscape
- 3.3 Profit margin analysis
- 3.4 Key news & initiatives
- 3.5 Regulatory landscape
- 3.6 Impact forces
- 3.6.1 Growth drivers
- 3.6.1.1 Rising demand for high-resolution displays
- 3.6.1.2 Miniaturization and integration in consumer electronics
- 3.6.1.3 Enhanced performance and cost efficiency
- 3.6.1.4 Advancements in flexible and transparent display technologies
- 3.6.1.5 Support from industry leaders and technological partnerships
- 3.6.2 Industry pitfalls & challenges
- 3.6.2.1 High manufacturing costs and complexity
- 3.6.2.2 Limited market penetration and consumer awareness
- 3.6.1 Growth drivers
- 3.7 Growth potential analysis
- 3.8 Porter’s analysis
- 3.9 PESTEL analysis
Chapter 4 Competitive Landscape, 2024
- 4.1 Introduction
- 4.2 Company market share analysis
- 4.3 Competitive positioning matrix
- 4.4 Strategic outlook matrix
Chapter 5 Market Estimates & Forecast, By Light Spectrum, 2021-2034 (USD Billion) (Units)
- 5.1 Key trends
- 5.2 Visible spectrum (RGB, Full-Color Displays)
- 5.3 Near-infrared (NIR, 700-1400 nm)
- 5.4 Infrared (IR, 700-3000 nm)
- 5.5 Ultraviolet (UV, <400 nm)
- 5.6 Multi-spectrum (Visible + IR + NIR)
- 5.7 Others
Chapter 6 Market Estimates & Forecast, By Application, 2021-2034 (USD Billion) (Units)
- 6.1 Key trends
- 6.2 Display systems
- 6.3 Sensing & detection
- 6.4 Imaging & inspection
- 6.5 Optical communication
- 6.6 Others
Chapter 7 Market Estimates & Forecast, By End Use, 2021-2034 (USD Billion) (Units)
- 7.1 Key trends
- 7.2 Aerospace & defense
- 7.3 Consumer electronics
- 7.4 Industrial & manufacturing
- 7.5 Healthcare & medical
- 7.6 Automotive
- 7.7 Others
Chapter 8 Market Estimates & Forecast, By Region, 2021-2034 (USD Billion) (Units)
- 8.1 Key trends
- 8.2 North America
- 8.2.1 U.S.
- 8.2.2 Canada
- 8.3 Europe
- 8.3.1 UK
- 8.3.2 Germany
- 8.3.3 France
- 8.3.4 Italy
- 8.3.5 Spain
- 8.3.6 Russia
- 8.4 Asia Pacific
- 8.4.1 China
- 8.4.2 India
- 8.4.3 Japan
- 8.4.4 South Korea
- 8.4.5 Australia
- 8.5 Latin America
- 8.5.1 Brazil
- 8.5.2 Mexico
- 8.6 MEA
- 8.6.1 South Africa
- 8.6.2 Saudi Arabia
- 8.6.3 UAE
Chapter 9 Company Profiles
- 9.1 China Star Optoelectronics Technology (CSOT)
- 9.2 eMagin Corporation
- 9.3 Himax Technologies, Inc.
- 9.4 HOLOEYE Photonics AG
- 9.5 Innolux Corporation
- 9.6 JDI (Japan Display Inc.)
- 9.7 Kopin Corporation
- 9.8 LG Display Co., Ltd.
- 9.9 Olightek
- 9.10 Pixelligent Technologies LLC
- 9.11 Raystar Optronics Inc.
- 9.12 Ritek Corporation
- 9.13 Samsung Electronics Co., Ltd.
- 9.14 SeeYA Technology
- 9.15 SiliconCore Technology Inc.
- 9.16 Sony Corporation
- 9.17 Tridonic GmbH & Co. KG
- 9.18 Visionox
- 9.19 Winstar Display Co., Ltd.
- 9.20 WiseChip Semiconductor Inc.
 2032年量子点OLED市场预测:按面板类型、材料、组件、应用和地区进行的全球分析
 PMOLED(被动矩阵OLED)显示器市场,按产品类型、显示器尺寸、应用、最终用户、国家和地区划分 - 2025 年至 2032 年全球产业分析、市场规模、市场份额及预测
 2025年柔性OLED显示器全球市场报告
 全球硅基OLED(OLEDoS)市场OLED 显示器市场规模、份额和趋势分析报告:按显示器尺寸、技术、应用、地区和细分市场预测,2025 年至 2033 年LED和有机发光二极体显示器的全球市场
 OLED 微型显示器市场报告(按类型(近眼式、投影式)、解析度(高清、全高清)、最终用途产业(汽车、医疗保健、消费性电子、军事、执法等)和地区划分,2025 年至 2033 年
 OLED微型显示器:市场占有率分析、产业趋势与统计、成长预测(2025-2030)
 OLED 显示器市场按显示器类型、组件、技术、分销管道、应用和行业细分 - 全球预测 2025-2030OLED 显示器市场:按显示器类型、应用程式、最终用户和地区划分