


 |
市场调查报告书
商品编码
1666887
车载支付服务市场机会、成长动力、产业趋势分析及 2025 - 2034 年预测In-Vehicle Payment Services Market Opportunity, Growth Drivers, Industry Trend Analysis, and Forecast 2025 - 2034 |
||||||
2024 年全球车载支付服务市场价值为 14 亿美元,预计 2025 年至 2034 年期间将实现 26.7% 的强劲增长率。这些创新实现了车辆、支付系统和服务提供者之间的无缝通信,从而更快地采用车载支付解决方案。随着汽车产业透过连网、自动驾驶和电动车进行转型,对高阶支付解决方案的需求比以往任何时候都高。这些技术不仅为消费者提供了更便利、更有效的支付方式,而且还改善了整体驾驶体验。
即时资料处理、语音交易和增强的安全功能所提供的便利性使得车载支付系统对消费者和服务提供者都具有极大的吸引力。此外,电动和自动驾驶汽车的日益普及也增加了对可靠支付解决方案的需求,特别是对于通行费支付和电动车充电等服务。随着道路上电动车的数量不断增加,越来越多的驾驶者寻求无缝、高效的方法来支付旅途中的充电费用,这进一步加速了市场成长。随着这些系统的不断发展,在创新和消费者对简化支付体验的需求的推动下,市场预计未来几年将呈指数级增长。
| 市场范围 | |
|---|---|
| 起始年份 | 2024 |
| 预测年份 | 2025-2034 |
| 起始值 | 14亿美元 |
| 预测值 | 146亿美元 |
| 复合年增长率 | 26.7% |
市场分为两种主要支付方式:钱包和金融卡/信用卡。借记卡/信用卡领域在 2024 年占据了 56% 的显着份额,预计到 2034 年将产生 72 亿美元的收入。金融卡和信用卡支付具有强大的安全功能,包括防诈骗和即时交易监控,因此越来越受到消费者的青睐。此外,这些卡片与各种数位支付生态系统高度相容,成为全球消费者的首选。
在应用方面,市场分为加油/电动车充电、智慧停车、自动收费支付和电子商务。 2024 年,加油和电动车充电领域占据了 40% 的最大市场份额,这得益于这些服务的重要性质,尤其是随着向电动车的转变继续获得动力。由于这些服务对于车辆运行至关重要,因此它们对车内交易量贡献巨大。
2024 年,美国车载支付服务市场占 76% 的主导份额,证明了该国汽车产业的先进性和车联网技术的广泛应用。美国受惠于完善的基础设施,包括庞大的收费系统网路、智慧停车解决方案和不断扩大的电动车充电站。这些因素为车载支付系统的无缝整合创造了理想的环境。此外,消费者对非接触式和便利支付方式的偏好日益增长,加速了这些系统的采用。汽车製造商、金融科技公司和技术供应商之间的强有力合作正在推动持续创新,并确保这些支付解决方案不断发展和扩展。
目录
第 1 章:方法论与范围
- 研究设计
- 研究方法
- 资料收集方法
- 基础估计和计算
- 基准年计算
- 市场估计的主要趋势
- 预测模型
- 初步研究与验证
- 主要来源
- 资料探勘来源
- 市场定义
第 2 章:执行摘要
第 3 章:产业洞察
- 产业生态系统分析
- 行动支付服务提供者
- 银行及金融机构
- 商家和零售商
- 最终用途
- 供应商概况
- 利润率分析
- 技术与创新格局
- 重要新闻及倡议
- 监管格局
- 衝击力
- 成长动力
- 连网汽车的技术进步
- 便利性需求不断成长
- 智慧城市和基础设施的扩展
- 电动车(EV)的普及率不断提高
- 产业陷阱与挑战
- 实施成本高
- 网路安全和资料隐私问题
- 成长动力
- 成长潜力分析
- 波特的分析
- PESTEL 分析
第四章:竞争格局
- 介绍
- 公司市占率分析
- 竞争定位矩阵
- 战略展望矩阵
第 5 章:市场估计与预测:按支付方式,2021 - 2034 年
- 主要趋势
- 钱包
- 金融卡/信用卡
第 6 章:市场估计与预测:按应用,2021 - 2034 年
- 主要趋势
- 加油/电动车充电
- 智慧停车
- 自动支付通行费
- 电子商务
- 其他的
第七章:市场估计与预测:按地区,2021 - 2034 年
- 主要趋势
- 北美洲
- 我们
- 加拿大
- 欧洲
- 英国
- 德国
- 法国
- 西班牙
- 义大利
- 北欧
- 俄罗斯
- 亚太地区
- 中国
- 印度
- 日本
- 韩国
- 澳洲
- 东南亚
- 拉丁美洲
- 巴西
- 墨西哥
- 阿根廷
- 中东及非洲
- 阿联酋
- 南非
- 沙乌地阿拉伯
第八章:公司简介
- Amazon Web Services Inc.
- Daimler AG
- Ford Motor Company
- General Motors
- Google LLC
- Hyundai Motor
- IBM Corporation
- Jaguar Land Rover Automotive PLC
- Mastercard
- ParkMobile
- PayPal
- Shell
- Visa Inc.
- Volkswagen AG
- ZF Friedrichshafen AG
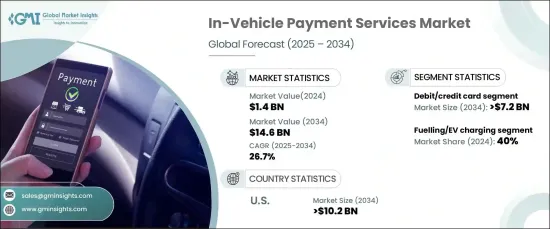
The Global In-Vehicle Payment Services Market was valued at USD 1.4 billion in 2024 and is projected to experience a robust growth rate of 26.7% CAGR from 2025 to 2034. The market expansion is being propelled by the increasing integration of advanced technologies such as the Internet of Things (IoT), 5G, and artificial intelligence (AI) in connected vehicles. These innovations enable seamless communication between vehicles, payment systems, and service providers, leading to faster adoption of in-vehicle payment solutions. With the automotive sector undergoing a transformation through connected, autonomous, and electric vehicles, the demand for advanced payment solutions is higher than ever before. These technologies not only offer consumers a more convenient and efficient way to manage payments but also improve the overall driving experience.
The convenience provided by real-time data processing, voice-activated transactions, and enhanced security features has made in-vehicle payment systems highly appealing to both consumers and service providers. In addition, the growing popularity of electric and autonomous vehicles has amplified the need for reliable payment solutions, particularly for services such as toll payments and EV charging. With the increasing number of electric vehicles on the road, more drivers are seeking seamless, efficient methods to pay for their charging sessions while on the go, further accelerating market growth. As these systems continue to evolve, the market is expected to see exponential growth in the coming years, fueled by innovation and consumer demand for simplified payment experiences.
| Market Scope | |
|---|---|
| Start Year | 2024 |
| Forecast Year | 2025-2034 |
| Start Value | $1.4 Billion |
| Forecast Value | $14.6 Billion |
| CAGR | 26.7% |
The market is divided into two primary payment methods: wallets and debit/credit cards. The debit/credit card segment held a significant share of 56% in 2024 and is projected to generate USD 7.2 billion by 2034. This dominance can be attributed to the widespread acceptance and trust associated with card-based payments. Consumers are increasingly drawn to debit and credit card payments due to their robust security features, including fraud protection and real-time transaction monitoring. Additionally, these cards are highly compatible with a wide range of digital payment ecosystems, making them a preferred choice for consumers globally.
In terms of applications, the market is segmented into fueling/EV charging, smart parking, automated toll payments, and e-commerce. The fueling and EV charging segment captured the largest market share of 40% in 2024, driven by the essential nature of these services, particularly as the shift toward electric vehicles continues to gain momentum. As these services are crucial for vehicle operation, they contribute significantly to the volume of in-vehicle transactions.
The U.S. in-vehicle payment services market held a dominant share of 76% in 2024, a testament to the country's advanced automotive industry and the widespread adoption of connected vehicle technologies. The U.S. benefits from an established infrastructure that includes a vast network of toll systems, smart parking solutions, and expanding EV charging stations. These factors have created an ideal environment for the seamless integration of in-vehicle payment systems. Additionally, the growing preference for contactless and convenient payment options among consumers has accelerated the adoption of these systems. Strong partnerships between automakers, fintech companies, and technology providers are driving ongoing innovation and ensuring that these payment solutions continue to evolve and expand.
Table of Contents
Chapter 1 Methodology & Scope
- 1.1 Research design
- 1.1.1 Research approach
- 1.1.2 Data collection methods
- 1.2 Base estimates and calculations
- 1.2.1 Base year calculation
- 1.2.2 Key trends for market estimates
- 1.3 Forecast model
- 1.4 Primary research & validation
- 1.4.1 Primary sources
- 1.4.2 Data mining sources
- 1.5 Market definitions
Chapter 2 Executive Summary
- 2.1 Industry synopsis, 2021 - 2034
Chapter 3 Industry Insights
- 3.1 Industry ecosystem analysis
- 3.1.1 Mobile payment service providers
- 3.1.2 Banks & financial institutions
- 3.1.3 Merchants & retailers
- 3.1.4 End use
- 3.2 Supplier landscape
- 3.3 Profit margin analysis
- 3.4 Technology & innovation landscape
- 3.5 Key news & initiatives
- 3.6 Regulatory landscape
- 3.7 Impact forces
- 3.7.1 Growth drivers
- 3.7.1.1 Technological advancements in connected vehicles
- 3.7.1.2 Rising demand for convenience
- 3.7.1.3 Expansion of smart cities and infrastructure
- 3.7.1.4 Growing adoption of electric vehicles (EV)
- 3.7.2 Industry pitfalls & challenges
- 3.7.2.1 High implementation costs
- 3.7.2.2 Cybersecurity and data privacy concerns
- 3.7.1 Growth drivers
- 3.8 Growth potential analysis
- 3.9 Porter’s analysis
- 3.10 PESTEL analysis
Chapter 4 Competitive Landscape, 2024
- 4.1 Introduction
- 4.2 Company market share analysis
- 4.3 Competitive positioning matrix
- 4.4 Strategic outlook matrix
Chapter 5 Market Estimates & Forecast, By Payment Mode, 2021 - 2034 ($Bn)
- 5.1 Key trends
- 5.2 Wallet
- 5.3 Debit/Credit card
Chapter 6 Market Estimates & Forecast, By Application, 2021 - 2034 ($Bn)
- 6.1 Key trends
- 6.2 Fuelling/EV charging
- 6.3 Smart parking
- 6.4 Automated toll payments
- 6.5 E-commerce
- 6.6 Others
Chapter 7 Market Estimates & Forecast, By Region, 2021 - 2034 ($Bn)
- 7.1 Key trends
- 7.2 North America
- 7.2.1 U.S.
- 7.2.2 Canada
- 7.3 Europe
- 7.3.1 UK
- 7.3.2 Germany
- 7.3.3 France
- 7.3.4 Spain
- 7.3.5 Italy
- 7.3.6 Nordics
- 7.3.7 Russia
- 7.4 Asia Pacific
- 7.4.1 China
- 7.4.2 India
- 7.4.3 Japan
- 7.4.4 South Korea
- 7.4.5 Australia
- 7.4.6 Southeast Asia
- 7.5 Latin America
- 7.5.1 Brazil
- 7.5.2 Mexico
- 7.5.3 Argentina
- 7.6 MEA
- 7.6.1 UAE
- 7.6.2 South Africa
- 7.6.3 Saudi Arabia
Chapter 8 Company Profiles
- 8.1 Amazon Web Services Inc.
- 8.2 Daimler AG
- 8.3 Ford Motor Company
- 8.4 General Motors
- 8.5 Google LLC
- 8.6 Hyundai Motor
- 8.7 IBM Corporation
- 8.8 Jaguar Land Rover Automotive PLC
- 8.9 Mastercard
- 8.10 ParkMobile
- 8.11 PayPal
- 8.12 Shell
- 8.13 Visa Inc.
- 8.14 Volkswagen AG
- 8.15 ZF Friedrichshafen AG
 车载支付服务市场按支付方式、应用、车辆类型、连接方式和交易类型划分-2025-2032年全球预测
 2032年车载支付服务市场预测:按支付方式、车辆类型、应用和地区进行的全球分析
 2025年全球车用支付服务市场报告
 全球车用支付服务市场
 车载付款服务市场:按付款方式、应用程式和地区划分
 车载付款服务市场规模、份额及成长分析(按付款方式、应用和地区)- 产业预测 2025-2032
 车内付款·ETC的中国市场(2024年)到 2030 年车载付款系统市场预测:按付款类型、车辆类型、技术、应用、最终用户和地区进行全球分析
 车载支付服务市场、份额、规模、趋势、行业分析报告:按支付方式、应用、地区和细分市场预测,2024-2032