


 |
市场调查报告书
商品编码
1667003
电动货车市场机会、成长动力、产业趋势分析及 2025 - 2034 年预测Electric Vans Market Opportunity, Growth Drivers, Industry Trend Analysis, and Forecast 2025 - 2034 |
||||||
2024 年全球电动货车市场价值为 163 亿美元,预计 2025 年至 2034 年期间的复合年增长率为 15.5%。世界各国政府都在推出激励措施来推动电动车的普及,鼓励企业转型为环保车队。电动货车为传统柴油车提供零排放替代品,符合这些监管架构和企业永续发展目标。电池技术的改进也提高了电动货车的可行性,增加了行驶里程并降低了生产成本。这些进步,加上环保意识和监管支持,正在推动各行各业的需求,特别是在配送和物流领域。
电动货车市场依车辆类型分为商用车和个人车。个人汽车市场在 2024 年占据了相当大的份额,这主要是由消费者对环保和经济高效的汽车的偏好所驱动。然而,随着企业采用电动货车来降低营运成本并实现永续发展目标,预计商业领域的成长速度将超过电动货车。扩大充电基础设施和政府激励措施等因素进一步促进了电动货车的商业化应用,使其成为物流和配送车队的实用解决方案。
| 市场范围 | |
|---|---|
| 起始年份 | 2024 |
| 预测年份 | 2025-2034 |
| 起始值 | 163亿美元 |
| 预测值 | 656亿美元 |
| 复合年增长率 | 15.5% |
根据推进方式,市场分为电池电动车 (BEV) 和混合动力电动车 (HEV)。 2024 年,混合动力汽车由于其燃油效率和便利性的平衡而占据了市场的主导地位,因为它们并不完全依赖电力充电基础设施。儘管如此,由于电池技术的进步,纯电动车 (BEV) 的续航里程增加、充电时间减少,其发展势头仍旧强劲。价格承受能力的提高和充电网路的扩大使得纯电动车成为个人消费者和企业更有吸引力的选择。随着这些改进的不断进行,预计未来纯电动车将实现显着成长并占据更多的市场份额。
美国是电动货车市场的主要参与者,占 2024 年收入的很大份额,预计到 2034 年将超过 350 亿美元。主要电动汽车製造商的存在和对先进技术的投资进一步推动了创新和生产。此外,该国充电基础设施的扩建增强了广泛应用电动车的可行性,满足了对永续交通解决方案日益增长的需求。美国市场有能力引领更清洁的商业运输的转变,这反映了全球向电动车转变的广泛趋势。
目录
第 1 章:方法论与范围
- 研究设计
- 研究方法
- 资料收集方法
- 基础估计和计算
- 基准年计算
- 市场估计的主要趋势
- 预测模型
- 初步研究与验证
- 主要来源
- 资料探勘来源
- 市场定义
第 2 章:执行摘要
第 3 章:产业洞察
- 产业生态系统分析
- 供应商概况
- 电动货车製造商
- 经销商
- 最终用途
- 利润率分析
- 定价分析
- 专利格局
- 成本明细
- 专利格局
- 技术与创新格局
- 重要新闻及倡议
- 监管格局
- 衝击力
- 成长动力
- 提高对环境问题的认识和减少温室气体排放的必要性
- 政府推动汽车电气化的倡议
- 企业和车队营运商正在製定永续发展目标并引入电动车
- 整合智慧技术,提高效率
- 产业陷阱与挑战
- 前期成本高
- 充电基础设施有限
- 成长动力
- 成长潜力分析
- 波特的分析
- PESTEL 分析
第四章:竞争格局
- 介绍
- 公司市占率分析
- 竞争定位矩阵
- 战略展望矩阵
第 5 章:市场估计与预测:按推进方式,2021 - 2034 年
- 主要趋势
- 纯电动车
- 油电混合车
- 燃料电池汽车
- 插电式混合动力汽车
第六章:市场估计与预测:按范围,2021 - 2034 年
- 主要趋势
- 最多 100 英里
- 100 至 200 英里
- 200 英里以上
第七章:市场估计与预测:依车型,2021 - 2034 年
- 主要趋势
- 搭乘用车
- 商用车
第 8 章:市场估计与预测:按电池,2021 - 2034 年
- 主要趋势
- 密封铅酸
- 镍氢电池 (NiMH)
- 锂离子
第 9 章:市场估计与预测:按地区,2021 - 2034 年
- 主要趋势
- 北美洲
- 我们
- 加拿大
- 欧洲
- 英国
- 德国
- 法国
- 西班牙
- 义大利
- 俄罗斯
- 北欧
- 亚太地区
- 中国
- 印度
- 日本
- 韩国
- 澳新银行
- 东南亚
- 拉丁美洲
- 巴西
- 墨西哥
- 阿根廷
- 中东及非洲
- 阿联酋
- 南非
- 沙乌地阿拉伯
第十章:公司简介
- Ashok Leyland
- Ford Motor
- General Motors
- Hyundai
- Isuzu
- IVECO
- JAC Motors
- Mahindra
- Maxus
- Mercedes-Benz Group
- Nissan Motor
- Renault
- Stellantis
- TOYOTA MOTOR
- Volkswagen
- Arrival
- Canoo
- Bollinger Motors
- Rivian Automotive
- Workhorse Group
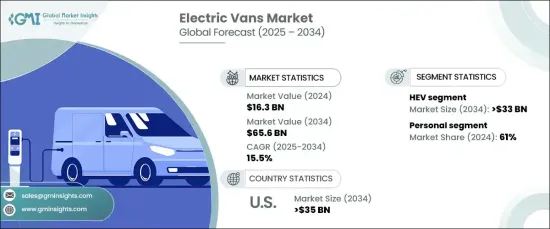
The Global Electric Vans Market, valued at USD 16.3 billion in 2024, is projected to expand at a CAGR of 15.5% between 2025 and 2034. This growth stems from increasing global efforts to combat climate change and reduce air pollution, alongside stricter government regulations on emissions. Governments worldwide are introducing incentives to promote electric vehicle adoption, encouraging businesses to transition to eco-friendly fleets. Electric vans, offering zero-emission alternatives to conventional diesel-powered vehicles, align with these regulatory frameworks and corporate sustainability goals. Improvements in battery technology are also enhancing the viability of electric vans by increasing range and decreasing production costs. These advancements, combined with environmental awareness and regulatory support, are driving demand across industries, particularly in the delivery and logistics sectors.
The electric vans market is segmented by vehicle type into commercial and personal categories. The personal segment, which held a significant share in 2024, is driven by consumer preferences for eco-friendly and cost-efficient vehicles. However, the commercial segment is anticipated to outpace it in growth as businesses adopt electric vans to reduce operating costs and meet sustainability targets. Factors such as expanded charging infrastructure and government incentives further bolster the commercial adoption of electric vans, making them a practical solution for logistics and delivery fleets.
| Market Scope | |
|---|---|
| Start Year | 2024 |
| Forecast Year | 2025-2034 |
| Start Value | $16.3 Billion |
| Forecast Value | $65.6 Billion |
| CAGR | 15.5% |
By propulsion, the market is divided into battery electric vehicles (BEVs) and hybrid electric vehicles (HEVs). In 2024, HEVs held a dominant share of the market due to their balance of fuel efficiency and convenience, as they do not solely rely on electric charging infrastructure. Despite this, BEVs are gaining traction due to advancements in battery technology, which improve range and decrease charging times. Increasing affordability and expanding charging networks are making BEVs a more attractive choice for both individual consumers and businesses. As these improvements continue, BEVs are expected to experience significant growth and capture more market share in the future.
The US is a key player in the electric vans market, accounting for a substantial share of revenue in 2024, and is projected to exceed USD 35 billion by 2034. This growth is supported by favorable government policies, tax incentives, and grants aimed at promoting electric vehicle adoption. The presence of major EV manufacturers and investments in advanced technologies further drive innovation and production. Additionally, the expansion of the country's charging infrastructure enhances the feasibility of widespread EV adoption, meeting the rising demand for sustainable transportation solutions. The US market is well-positioned to lead the transition toward cleaner commercial transportation, reflecting the broader global shift toward electric mobility.
Table of Contents
Chapter 1 Methodology & Scope
- 1.1 Research design
- 1.1.1 Research approach
- 1.1.2 Data collection methods
- 1.2 Base estimates and calculations
- 1.2.1 Base year calculation
- 1.2.2 Key trends for market estimates
- 1.3 Forecast model
- 1.4 Primary research & validation
- 1.4.1 Primary sources
- 1.4.2 Data mining sources
- 1.5 Market definitions
Chapter 2 Executive Summary
- 2.1 Industry 3600 synopsis, 2021 - 2034
Chapter 3 Industry Insights
- 3.1 Industry ecosystem analysis
- 3.2 Supplier landscape
- 3.2.1 Electric van manufacturers
- 3.2.2 Distributors
- 3.2.3 End use
- 3.3 Profit margin analysis
- 3.4 Pricing analysis
- 3.5 Patent Landscape
- 3.6 Cost Breakdown
- 3.7 Patent Landscape
- 3.8 Technology & innovation landscape
- 3.9 Key news & initiatives
- 3.10 Regulatory landscape
- 3.11 Impact forces
- 3.11.1 Growth drivers
- 3.11.1.1 Increasing awareness about environmental issues and the need to reduce greenhouse gas emissions
- 3.11.1.2 Government initiatives towards electrification of vehicles
- 3.11.1.3 Businesses and fleet operators are setting sustainability goals and incorporating electric vehicles
- 3.11.1.4 Integration of smart technologies for enhanced efficiency
- 3.11.2 Industry pitfalls & challenges
- 3.11.2.1 High initial upfront costs
- 3.11.2.2 Limited charging infrastructure
- 3.11.1 Growth drivers
- 3.12 Growth potential analysis
- 3.13 Porter’s analysis
- 3.14 PESTEL analysis
Chapter 4 Competitive Landscape, 2024
- 4.1 Introduction
- 4.2 Company market share analysis
- 4.3 Competitive positioning matrix
- 4.4 Strategic outlook matrix
Chapter 5 Market Estimates & Forecast, By Propulsion, 2021 - 2034 ($Bn, Units)
- 5.1 Key trends
- 5.2 BEV
- 5.3 HEV
- 5.3.1 FCEV
- 5.3.2 PHEV
Chapter 6 Market Estimates & Forecast, By Range, 2021 - 2034 ($Bn, Units)
- 6.1 Key trends
- 6.2 Upto 100 miles
- 6.3 100 to 200 miles
- 6.4 Above 200 miles
Chapter 7 Market Estimates & Forecast, By Vehicle, 2021 - 2034 ($Bn, Units)
- 7.1 Key trends
- 7.2 Passenger vehicle
- 7.3 Commercial vehicle
Chapter 8 Market Estimates & Forecast, By Battery, 2021 - 2034 ($Bn, Units)
- 8.1 Key trends
- 8.2 Sealed lead acid
- 8.3 Nickel Metal Hydride (NiMH)
- 8.4 Lithium Ion
Chapter 9 Market Estimates & Forecast, By Region, 2021 - 2034 ($Bn, Units)
- 9.1 Key trends
- 9.2 North America
- 9.2.1 U.S.
- 9.2.2 Canada
- 9.3 Europe
- 9.3.1 UK
- 9.3.2 Germany
- 9.3.3 France
- 9.3.4 Spain
- 9.3.5 Italy
- 9.3.6 Russia
- 9.3.7 Nordics
- 9.4 Asia Pacific
- 9.4.1 China
- 9.4.2 India
- 9.4.3 Japan
- 9.4.4 South Korea
- 9.4.5 ANZ
- 9.4.6 Southeast Asia
- 9.5 Latin America
- 9.5.1 Brazil
- 9.5.2 Mexico
- 9.5.3 Argentina
- 9.6 MEA
- 9.6.1 UAE
- 9.6.2 South Africa
- 9.6.3 Saudi Arabia
Chapter 10 Company Profiles
- 10.1 Ashok Leyland
- 10.2 Ford Motor
- 10.3 General Motors
- 10.4 Hyundai
- 10.5 Isuzu
- 10.6 IVECO
- 10.7 JAC Motors
- 10.8 Mahindra
- 10.9 Maxus
- 10.10 Mercedes-Benz Group
- 10.11 Nissan Motor
- 10.12 Renault
- 10.13 Stellantis
- 10.14 TOYOTA MOTOR
- 10.15 Volkswagen
- 10.16 Arrival
- 10.17 Canoo
- 10.18 Bollinger Motors
- 10.19 Rivian Automotive
- 10.20 Workhorse Group
 电动货车市场:2026-2032年全球市场预测(按车辆类型、应用、续航里程、电池容量、充电基础设施和动力系统划分)
 2026年全球电动货车市场报告
 电动货车市场规模、份额、成长及全球产业分析:按类型、应用和地区分類的洞察,2026-2034 年预测
 电动货车市场-全球产业规模、份额、趋势、机会与预测:动力系统、续航里程、电池容量、区域及竞争格局,2021-2031年
 全球电动货车市场
 电动货车市场规模、份额、成长分析、按距离、按电池容量、按电池类型、按地区 - 产业预测,2024-2031 年
 电动货车市场,按推进力、按应用、按里程、按电池、按国家和地区 - 2024-2032 年行业分析、市场规模、市场份额和预测
 电动货车市场规模、份额、趋势分析报告:按推进力、按距离、按电池、按应用、按地区、细分市场预测,2024-2030