


 |
市场调查报告书
商品编码
1698282
电动商用车市场机会、成长动力、产业趋势分析及 2025 - 2034 年预测Electric Commercial Vehicle Market Opportunity, Growth Drivers, Industry Trend Analysis, and Forecast 2025 - 2034 |
||||||
2024 年全球电动商用车市场价值为 723 亿美元,预计 2025 年至 2034 年期间的复合年增长率将达到 12.7%。世界各国政府正在透过补贴、税收抵免和鼓励采用的政策来推动这一成长。减排目标、碳中和承诺和监管激励措施正在促使企业和车队营运商投资电动车队。补贴充电基础设施、道路税减免和财政支持计画使电动商用车成为传统燃料驱动车的经济高效的替代品。
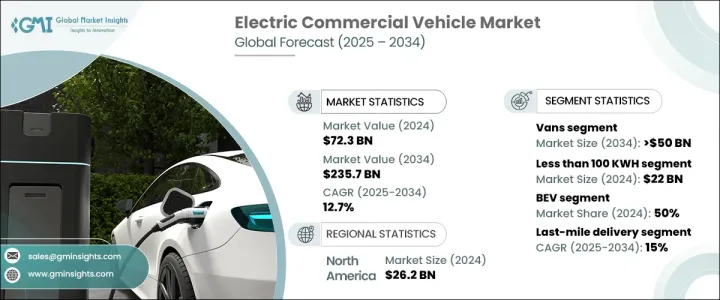
由于技术进步和材料管理的改进,电池成本下降,提高了可负担性。电池效率提高,从而延长行驶里程并提高车辆性能。扩大充电网路和电池更换技术的进步进一步促进了更广泛的应用。公共和私营部门对快速充电解决方案和再生能源整合的投资使电动商用车更加实用。 2024 年电动车充电站市场价值为 397 亿美元,预计到 2034 年将超过 3,500 亿美元。
| 市场范围 | |
|---|---|
| 起始年份 | 2024 |
| 预测年份 | 2025-2034 |
| 起始值 | 723亿美元 |
| 预测值 | 2357亿美元 |
| 复合年增长率 | 12.7% |
电动商用车包括皮卡车、卡车、货车和巴士。厢型车占了超过 36% 的市场份额,预计到 2034 年其市场规模将超过 500 亿美元。厢型车体积小巧、机动性强,是城市物流和最后一哩配送的理想选择。企业正在转向电动货车,以降低燃料和维护成本,同时遵守低排放区法规。财政激励和税收减免进一步提高了车队营运商的承受能力。
电池容量细分包括低于100kWh、101-250kWh、251-400kWh、401-550kWh、以及高于550kWh。 2024 年,100 千瓦时以下类别占据主导地位,创造了 220 亿美元的收入。更轻的电池组提高了能源效率、车辆操控性和性能。它们的充电速度也更快,使其与大多数充电网路相容。每次充电 250-400 英里的最佳续航里程平衡了实用性和成本效益,使小型电池组成为城市交通和商用货车的首选。
电动商用车分为电池电动车(BEV)、燃料电池电动车(FCEV)、混合动力商用电动车(HCEV)。由于维护成本较低且营运效率较高,纯电动车将在 2024 年占据 50% 的市场。与混合动力车或燃料电池汽车相比,纯电动车的运动部件更少,因此可以降低个人和车队营运商的长期开支。政府补贴和更严格的排放法规进一步推动了纯电动车的普及。城市零排放区的扩张正在加速这一趋势,使纯电动车成为商用车队的首选。
根据最终用途应用,市场细分包括最后一哩交付、现场服务、配送服务、长途运输和垃圾车。受电子商务扩张和对具有成本效益的可持续运输解决方案的需求增加的推动,最后一英里配送行业预计将以 15% 的复合年增长率最快增长。电动运输车辆的燃料和维护成本较低,易于在拥挤地区行驶,并符合低排放法规。它们能够优化规划路线和安排充电,从而减少停机时间并提高营运效率。
北美以 36% 的份额领先全球电动商用车市场,其中美国在 2024 年创造了 262 亿美元的收入。优惠政策、税收抵免、补助和基础设施投资推动了电动商用车的采用。政府措施鼓励车队转向使用电力,而联邦资金则支持全国范围内的电动车充电站扩建。因此,美国继续成为全球向永续交通转变的主要参与者。
目录
第一章:方法论与范围
- 研究设计
- 研究方法
- 资料收集方法
- 基础估算与计算
- 基准年计算
- 市场评估的主要趋势
- 预测模型
- 初步研究和验证
- 主要来源
- 资料探勘来源
- 市场范围和定义
第二章:执行摘要
第三章:行业洞察
- 产业生态系统分析
- 供应商格局
- 原物料供应商
- 零件供应商
- 製造商
- 技术提供者
- 最终用途
- 利润率分析
- 供应商格局
- 技术与创新格局
- 专利分析
- 监管格局
- 价格趋势
- 衝击力
- 成长动力
- 政府政策和激励措施
- 电池成本下降
- 企业永续发展目标与 ESG 合规性
- 城市化和最后一哩配送的成长
- 技术进步
- 产业陷阱与挑战
- 监管和法律障碍
- 开发成本高
- 成长动力
- 成长潜力分析
- 波特的分析
- PESTEL 分析
第四章:竞争格局
- 介绍
- 公司市占率分析
- 竞争定位矩阵
- 战略展望矩阵
第五章:市场估计与预测:依车型,2021 - 2034 年
- 主要趋势
- 皮卡车
- 卡车
- 货车
- 公车和长途客车
第六章:市场估计与预测:以推进方式,2021 - 2034 年
- 主要趋势
- 纯电动车
- 燃料电池电动车
- 丙型肝炎病毒
第七章:市场估计与预测:按电池容量,2021 - 2034 年
- 主要趋势
- 少于100度
- 101-250千瓦时
- 251-400千瓦时
- 401-550千瓦时
- 超过550度
第八章:市场估计与预测:依最终用途,2021 - 2034 年
- 主要趋势
- 最后一哩配送
- 现场服务
- 配送服务
- 长途运输
- 垃圾车
第九章:市场估计与预测:按地区,2021 - 2034 年
- 主要趋势
- 北美洲
- 我们
- 加拿大
- 欧洲
- 英国
- 德国
- 法国
- 义大利
- 西班牙
- 俄罗斯
- 北欧人
- 亚太地区
- 中国
- 印度
- 日本
- 澳洲
- 韩国
- 东南亚
- 拉丁美洲
- 巴西
- 墨西哥
- 阿根廷
- 中东及非洲
- 阿联酋
- 南非
- 沙乌地阿拉伯
第十章:公司简介
- AB Volvo
- Bollinger Motors
- BYD
- Dongfeng Motor
- Ford Motor
- Irizar Group
- Isuzu Motors
- IVECO
- Mercedes Benz
- Nikola
- Paccar
- Proterra
- Renault
- Rivian
- Scania
- Tata Motors
- Tesla
- VDL Groep
- Workhorse Group
- Yutong
The Global Electric Commercial Vehicle Market, valued at USD 72.3 billion in 2024, is expected to expand at a 12.7% CAGR between 2025 and 2034. Governments worldwide are driving this growth through subsidies, tax credits, and policies designed to encourage adoption. Emission reduction targets, carbon neutrality commitments, and regulatory incentives are prompting businesses and fleet operators to invest in electric fleets. Subsidized charging infrastructure, road tax exemptions, and financial support programs make electric commercial vehicles a cost-effective alternative to conventional fuel-powered options.
The declining cost of batteries due to technological advancements and improved material management has enhanced affordability. Battery efficiency has increased, leading to longer ranges and improved vehicle performance. Expanding charging networks and advancements in battery-swapping technology are further enabling wider adoption. Investments from public and private sectors in fast-charging solutions and renewable energy integration make electric commercial vehicles more practical. The EV charging station market, valued at USD 39.7 billion in 2024, is projected to surpass USD 350 billion by 2034.
| Market Scope | |
|---|---|
| Start Year | 2024 |
| Forecast Year | 2025-2034 |
| Start Value | $72.3 Billion |
| Forecast Value | $235.7 Billion |
| CAGR | 12.7% |
Electric commercial vehicles include pickup trucks, trucks, vans, and buses. Vans, accounting for over 36% of the market, are expected to exceed USD 50 billion by 2034. Their compact size and maneuverability make them ideal for urban logistics and last-mile deliveries. Businesses are transitioning to electric vans to lower fuel and maintenance costs while complying with low-emission zone regulations. Financial incentives and tax exemptions further enhance affordability for fleet operators.
Battery capacity segmentation includes less than 100 kWh, 101-250 kWh, 251-400 kWh, 401-550 kWh, and more than 550 kWh. The sub-100 kWh category dominated in 2024, generating USD 22 billion in revenue. Lighter battery packs enhance energy efficiency, vehicle handling, and performance. They also charge faster, making them compatible with most charging networks. The optimal range of 250-400 miles per charge balances practicality and cost-effectiveness, making smaller battery packs the preferred choice for urban mobility and commercial vans.
Electric commercial vehicles are classified into battery electric vehicles (BEV), fuel cell electric vehicles (FCEV), and hybrid commercial electric vehicles (HCEV). BEVs accounted for 50% of the market in 2024 due to lower maintenance costs and operational efficiency. With fewer moving parts than hybrids or fuel cell vehicles, BEVs reduce long-term expenses for both individuals and fleet operators. Government subsidies and stricter emission regulations further drive BEV adoption. The expansion of zero-emission zones in urban areas is accelerating this trend, making BEVs the primary choice for commercial fleets.
By end-use application, the market segments include last-mile delivery, field services, distribution services, long-haul transportation, and refuse trucks. The last-mile delivery sector is set to grow at the fastest rate of 15% CAGR, driven by e-commerce expansion and increased demand for cost-effective, sustainable transport solutions. Electric delivery vehicles offer lower fuel and maintenance costs, easy navigation in congested areas, and compliance with low-emission regulations. Their ability to optimize planned routes and schedule charging reduces downtime and enhances operational efficiency.
North America leads the global electric commercial vehicle market with a 36% share, with the U.S. generating USD 26.2 billion in revenue in 2024. Favorable policies, tax credits, grants, and infrastructure investments fuel adoption. Government initiatives encourage fleet transitions to electric power, while federal funding supports nationwide EV charging station expansion. As a result, the U.S. continues to be a major player in the global shift toward sustainable transportation.
Table of Contents
Chapter 1 Methodology & Scope
- 1.1 Research design
- 1.1.1 Research approach
- 1.1.2 Data collection methods
- 1.2 Base estimates & calculations
- 1.2.1 Base year calculation
- 1.2.2 Key trends for market estimation
- 1.3 Forecast model
- 1.4 Primary research and validation
- 1.4.1 Primary sources
- 1.4.2 Data mining sources
- 1.5 Market scope & definition
Chapter 2 Executive Summary
- 2.1 Industry 3600 synopsis, 2021 - 2034
Chapter 3 Industry Insights
- 3.1 Industry ecosystem analysis
- 3.1.1 Supplier landscape
- 3.1.1.1 Raw material suppliers
- 3.1.1.2 Component suppliers
- 3.1.1.3 Manufacturers
- 3.1.1.4 Technology providers
- 3.1.1.5 End use
- 3.1.2 Profit margin analysis
- 3.1.1 Supplier landscape
- 3.2 Technology & innovation landscape
- 3.3 Patent analysis
- 3.4 Regulatory landscape
- 3.5 Price trend
- 3.6 Impact forces
- 3.6.1 Growth drivers
- 3.6.1.1 Government policies & incentives
- 3.6.1.2 Declining battery costs
- 3.6.1.3 Corporate sustainability goals & ESG compliance
- 3.6.1.4 Urbanization & last-mile delivery growth
- 3.6.1.5 Technological advancements
- 3.6.2 Industry pitfalls & challenges
- 3.6.2.1 Regulatory and legal hurdles
- 3.6.2.2 High development costs
- 3.6.1 Growth drivers
- 3.7 Growth potential analysis
- 3.8 Porter's analysis
- 3.9 PESTEL analysis
Chapter 4 Competitive Landscape, 2024
- 4.1 Introduction
- 4.2 Company market share analysis
- 4.3 Competitive positioning matrix
- 4.4 Strategic outlook matrix
Chapter 5 Market Estimates & Forecast, By Vehicle, 2021 - 2034 ($Bn, Units)
- 5.1 Key trends
- 5.2 Pickup trucks
- 5.3 Trucks
- 5.4 Vans
- 5.5 Buses & coaches
Chapter 6 Market Estimates & Forecast, By Propulsion, 2021 - 2034 ($Bn, Units)
- 6.1 Key trends
- 6.2 BEV
- 6.3 FCEV
- 6.4 HCEV
Chapter 7 Market Estimates & Forecast, By Battery Capacity, 2021 - 2034 ($Bn, Units)
- 7.1 Key trends
- 7.2 Less than 100 KWH
- 7.3 101-250 KWH
- 7.4 251-400 KWH
- 7.5 401-550 KWH
- 7.6 More than 550 KWH
Chapter 8 Market Estimates & Forecast, By End Use, 2021 - 2034 ($Bn, Units)
- 8.1 Key trends
- 8.2 Last-mile delivery
- 8.3 Field services
- 8.4 Distribution services
- 8.5 Long-haul transportation
- 8.6 Refuse trucks
Chapter 9 Market Estimates & Forecast, By Region, 2021 - 2034 ($Bn, Units)
- 9.1 Key trends
- 9.2 North America
- 9.2.1 U.S.
- 9.2.2 Canada
- 9.3 Europe
- 9.3.1 UK
- 9.3.2 Germany
- 9.3.3 France
- 9.3.4 Italy
- 9.3.5 Spain
- 9.3.6 Russia
- 9.3.7 Nordics
- 9.4 Asia Pacific
- 9.4.1 China
- 9.4.2 India
- 9.4.3 Japan
- 9.4.4 Australia
- 9.4.5 South Korea
- 9.4.6 Southeast Asia
- 9.5 Latin America
- 9.5.1 Brazil
- 9.5.2 Mexico
- 9.5.3 Argentina
- 9.6 MEA
- 9.6.1 UAE
- 9.6.2 South Africa
- 9.6.3 Saudi Arabia
Chapter 10 Company Profiles
- 10.1 AB Volvo
- 10.2 Bollinger Motors
- 10.3 BYD
- 10.4 Dongfeng Motor
- 10.5 Ford Motor
- 10.6 Irizar Group
- 10.7 Isuzu Motors
- 10.8 IVECO
- 10.9 Mercedes Benz
- 10.10 Nikola
- 10.11 Paccar
- 10.12 Proterra
- 10.13 Renault
- 10.14 Rivian
- 10.15 Scania
- 10.16 Tata Motors
- 10.17 Tesla
- 10.18 VDL Groep
- 10.19 Workhorse Group
- 10.20 Yutong
 全球电动商用车市场:预测(至2032年)-按车辆类型、推进系统、零件、电池容量、续航里程、应用和地区进行分析
 电动商用车市场(按车辆类型、动力类型、应用、续航里程和充电基础设施划分)-全球预测,2025-2032年电动商用车牵引马达市场:依技术、应用、功率范围、冷却系统、电压等级及马达转速划分-2025-2032年全球预测
 电动商用车市场,依车辆类型、推进类型、驱动类型、车速、国家及地区划分-2025 年至 2032 年全球产业分析、市场规模、市场份额及预测轻型电动商用车市场(按动力传动系统类型、车辆类型、电池容量、续航里程、传动系统和销售管道)——2025-2030 年全球预测
 全球电动轻型商用车市场(按车型、动力系统、车辆总重、电池类型、电池容量、续航里程、最终用途和地区划分)- 预测至 2032 年电动商用车 MRO 市场,按车辆类型、服务类型、服务提供者、最终用户、国家和地区划分 - 2025 年至 2032 年全球产业分析、市场规模、市场份额及预测
 全球工业电动车市场研究报告 - 产业分析、规模、份额、成长、趋势及 2025 年至 2033 年预测全球电动商用车市场研究报告 - 产业分析、规模、份额、成长、趋势及 2025 年至 2033 年预测
 电动轻型商用车市场-全球产业规模、份额、趋势、机会和预测,按车辆类型(轻型卡车、电动敞篷小货车、电动货车)、按推进方式(BEV、HEV、PHEV、FCEV)、按地区和竞争情况划分,2020-2030 年预测