


 |
市场调查报告书
商品编码
1698568
包装标籤市场机会、成长动力、产业趋势分析及 2025-2034 年预测Packaging Labels Market Opportunity, Growth Drivers, Industry Trend Analysis, and Forecast 2025-2034 |
||||||
2024 年全球包装标籤市场价值为 556 亿美元,预计 2025 年至 2034 年的复合年增长率为 4.6%。电子商务的快速扩张是一个重要驱动力,推动了电子、食品、时尚和製药等各行业对包装标籤的需求。随着网路零售的扩张,对清晰、耐用且符合法规要求的标籤的需求不断增加。随着企业致力于减少碳足迹,该行业也正在转向永续标籤解决方案。可重复使用和环保包装正变得越来越普遍,企业整合可回收材料并采用智慧标籤技术来增强产品可追溯性和消费者参与度。
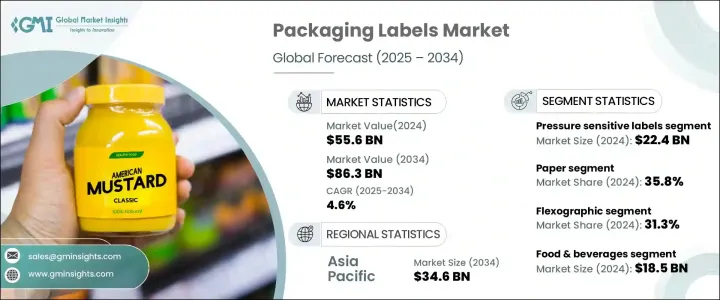
市场按标籤类型细分,包括压敏标籤、收缩标籤、拉伸标籤和湿胶标籤。 2024年,压敏标籤的市场规模为224亿美元,由于其跨产业的适应性,将继续广泛的应用。收缩标籤预计到 2034 年将达到 229 亿美元,因其能够适应复杂的包装形状并提供全面的品牌覆盖而受到青睐。拉伸标籤的复合年增长率为 4.3%,通常用于防篡改包装,而湿胶标籤预计到 2034 年将达到 89 亿美元,在高檔食品和饮料产品中很受欢迎。采用整合 RFID 和数位印刷技术的智慧标籤进一步增强了品牌推广、认证和可追溯性。
| 市场范围 | |
|---|---|
| 起始年份 | 2024 |
| 预测年份 | 2025-2034 |
| 起始值 | 556亿美元 |
| 预测值 | 863亿美元 |
| 复合年增长率 | 4.6% |
根据材料类型,市场分为纸质标籤、塑胶标籤和金属标籤。 2024 年,纸质标籤占据了 35.8% 的市场份额,反映出人们开始转向无塑胶替代品。塑胶标籤的复合年增长率为 5.1%,正在采用可生物降解的材料以符合永续发展目标。金属标籤因其耐用性和耐恶劣环境条件的特异性,预计到 2034 年其市场价值将达到 91 亿美元。
印刷技术的进步正在重塑这个产业。柔版印刷到 2024 年将占据 31.3% 的市场份额,仍然是高速、大量生产的首选。由于其卓越的影像品质和色彩一致性,预计到 2034 年凹版印刷的市场规模将达到 209 亿美元。数位印刷的复合年增长率为 4.8%,支援更短的生产週期和定制,而胶印预计到 2034 年将达到 48 亿美元,仍然是中型到大型印刷的首选。混合印刷结合了传统技术和数位技术,其复合年增长率为 2.6%。
食品和饮料、製药、消费品和汽车等终端行业正在推动市场扩张。 2024 年,食品和饮料产业的价值将达到 185 亿美元,严格的标籤法规将增强需求。製药业的复合年增长率为 6.2%,正在利用智慧标籤来改善产品的认证和可追溯性。预计到 2034 年,消费品市场规模将达到 128 亿美元,消费品越来越注重美观且资讯丰富的标籤。汽车和工业领域越来越多地整合 RFID 解决方案用于库存追踪和供应链管理。
亚太地区将主导市场,到 2034 年将达到 346 亿美元。该地区蓬勃发展的电子商务行业和智慧标籤解决方案的采用是关键的成长因素。对永续包装解决方案的需求不断推动创新,塑造全球包装标籤市场的未来。
目录
第一章:方法论与范围
- 市场范围和定义
- 基础估算与计算
- 预测参数
- 资料来源
- 基本的
- 次要
- 付费来源
- 公共资源
第二章:执行摘要
第三章:行业洞察
- 产业生态系统分析
- 供应商矩阵
- 技术与创新格局
- 专利分析
- 重要新闻和倡议
- 监管格局
- 衝击力
- 成长动力
- 电子商务领域蓬勃发展
- 消费者对永续包装的偏好日益增强
- 技术进步
- 监管要求
- 食品和饮料行业的成长
- 产业陷阱与挑战
- 环境问题
- 监管限制
- 成长动力
- 成长潜力分析
- 波特的分析
- PESTEL分析
第四章:竞争格局
- 公司市占率分析
- 竞争定位矩阵
- 战略展望矩阵
第五章:市场估计与预测:按标籤类型,2021 - 2032 年
- 主要趋势
- 压力标籤
- 收缩标籤
- 拉伸标籤
- 湿胶标籤
- 其他的
第六章:市场估计与预测:依资料,2021 年至 2032 年
- 主要趋势
- 纸
- 塑胶
- 金属
- 其他的
第七章:市场估计与预测:依印刷技术,2021 年至 2032 年
- 主要趋势
- 柔版印刷
- 轮转凹版印刷/凹印
- 数位印刷
- 胶印
- 混合印刷
第八章:市场估计与预测:依最终用途,2021 年至 2032 年
- 主要趋势
- 食品和饮料
- 烘焙和糖果
- 乳製品
- 冷冻食品
- 酒精
- 非酒精性
- 其他的
- 製药
- 片剂/胶囊
- 乳膏和软膏
- 液体糖浆
- 其他的
- 消费品
- 化学品
- 汽车
- 工业的
- 其他的
第九章:市场估计与预测:按地区,2021 - 2032 年
- 主要趋势
- 北美洲
- 我们
- 加拿大
- 欧洲
- 英国
- 德国
- 法国
- 义大利
- 西班牙
- 欧洲其他地区
- 亚太地区
- 中国
- 印度
- 日本
- 韩国
- 澳新银行
- 亚太其他地区
- 拉丁美洲
- 巴西
- 墨西哥
- 拉丁美洲其他地区
- MEA
- 阿联酋
- 沙乌地阿拉伯
- 南非
- MEA 其余地区
第十章:公司简介
- 3M Company
- Amcor plc
- Anchor Printing
- Avery Dennison Corporation
- Berry Global
- CCL Industries Inc.
- Constantia Flexibles Group GmbH
- Coveris Holding SA
- Fort Dearborn Company
- Fuji Seal International, Inc.
- HERMA GmbH
- Honeywell International Inc.
- Huhtamaki Group
- ID Images
- Klöckner Pentaplast Europe GmbH & Co KG
- KRIS FLEXIPACKS PVT. LTD.
- Lintec Corporation
- Mondi Plc
- Multi-Color Corporation
- Neenah, Inc
- Resource Label Group, LLC
- Sato Holdings Corporation
- Taghleef Industries Inc.
- UPM Raflatac
- WestRock Company
The Global Packaging Labels Market was valued at USD 55.6 billion in 2024 and is expected to grow at a CAGR of 4.6% from 2025 to 2034. The rapid expansion of e-commerce is a significant driver, fueling the demand for packaging labels across various industries, including electronics, food, fashion, and pharmaceuticals. As online retail expands, the need for clear, durable, and regulatory-compliant labeling continues to rise. The industry is also shifting towards sustainable labeling solutions as companies aim to reduce their carbon footprint. Reusable and eco-friendly packaging is becoming more prevalent, with businesses integrating recyclable materials and adopting smart labeling technologies to enhance product traceability and consumer engagement.
The market is segmented by label type, including pressure-sensitive labels, shrink labels, stretch labels, and wet glue labels. Pressure-sensitive labels accounted for USD 22.4 billion in 2024 and continue to be widely used due to their adaptability across industries. Shrink labels, projected to reach USD 22.9 billion by 2034, are preferred for their ability to conform to complex packaging shapes, offering full branding coverage. Stretch labels, growing at a CAGR of 4.3%, are commonly used for tamper-evident packaging, while wet glue labels, expected to reach USD 8.9 billion by 2034, are popular in premium food and beverage products. The adoption of smart labels integrated with RFID and digital printing technologies is further enhancing branding, authentication, and traceability.
| Market Scope | |
|---|---|
| Start Year | 2024 |
| Forecast Year | 2025-2034 |
| Start Value | $55.6 Billion |
| Forecast Value | $86.3 Billion |
| CAGR | 4.6% |
By material type, the market is classified into paper, plastic, and metal labels. Paper labels held a 35.8% market share in 2024, reflecting a shift toward plastic-free alternatives. Plastic labels, growing at a CAGR of 5.1%, are incorporating biodegradable materials to align with sustainability goals. Metal labels, anticipated to reach USD 9.1 billion by 2034, remain in demand for their durability and resistance to harsh environmental conditions.
Advancements in printing technology are reshaping the industry. Flexographic printing, holding a 31.3% market share in 2024, remains the leading choice for high-speed, large-volume production. Rotogravure printing is expected to reach USD 20.9 billion by 2034 due to its superior image quality and color consistency. Digital printing, growing at a CAGR of 4.8%, supports shorter production runs and customization, while offset printing, projected to reach USD 4.8 billion by 2034, remains a preferred option for medium to large-scale printing. Hybrid printing, combining traditional and digital techniques, is expanding at a CAGR of 2.6%.
End-use industries such as food and beverages, pharmaceuticals, consumer goods, and automotive are driving market expansion. The food and beverage segment was valued at USD 18.5 billion in 2024, with stringent labeling regulations enhancing demand. The pharmaceutical industry, growing at a CAGR of 6.2%, is leveraging smart labels for improved product authentication and traceability. Consumer goods, projected to reach USD 12.8 billion by 2034, are focusing on aesthetic and informative labeling. The automotive and industrial sectors are increasingly integrating RFID solutions for inventory tracking and supply chain management.
Asia Pacific is set to dominate the market, reaching USD 34.6 billion by 2034. The region's booming e-commerce sector and adoption of smart labeling solutions are key growth factors. The demand for sustainable packaging solutions continues to drive innovation, shaping the future of the global packaging labels market.
Table of Contents
Chapter 1 Methodology & Scope
- 1.1 Market scope & definition
- 1.2 Base estimates & calculations
- 1.3 Forecast parameters
- 1.4 Data sources
- 1.4.1 Primary
- 1.4.2 Secondary
- 1.4.2.1 Paid sources
- 1.4.2.2 Public sources
Chapter 2 Executive Summary
- 2.1 Industry 3600 synopsis, 2021 - 2032
Chapter 3 Industry Insights
- 3.1 Industry ecosystem analysis
- 3.2 Vendor matrix
- 3.3 Technology & innovation landscape
- 3.4 Patent analysis
- 3.5 Key news and initiatives
- 3.6 Regulatory landscape
- 3.7 Impact forces
- 3.7.1 Growth drivers
- 3.7.1.1 Growing E-Commerce sector
- 3.7.1.2 Rising consumer preference for sustainable packaging
- 3.7.1.3 Technological advancements
- 3.7.1.4 Regulatory requirements
- 3.7.1.5 Growth in the food and beverage industry
- 3.7.2 Industry pitfalls & challenges
- 3.7.2.1 Environmental concerns
- 3.7.2.2 Regulatory restrictions
- 3.7.1 Growth drivers
- 3.8 Growth potential analysis
- 3.9 Porter's analysis
- 3.9.1 Supplier power
- 3.9.2 Buyer power
- 3.9.3 Threat of new entrants
- 3.9.4 Threat of substitutes
- 3.9.5 Industry rivalry
- 3.10 PESTEL analysis
Chapter 4 Competitive Landscape, 2023
- 4.1 Company market share analysis
- 4.2 Competitive positioning matrix
- 4.3 Strategic outlook matrix
Chapter 5 Market Estimates & Forecast, By Label Type, 2021 - 2032 (USD Million)
- 5.1 Key trends
- 5.2 Pressure sensitive labels
- 5.3 Shrink labels
- 5.4 Stretch labels
- 5.5 Wet glue labels
- 5.6 Others
Chapter 6 Market Estimates & Forecast, By Material, 2021 – 2032 (USD Million)
- 6.1 Key trends
- 6.2 Paper
- 6.3 Plastic
- 6.4 Metal
- 6.5 Others
Chapter 7 Market Estimates & Forecast, By Printing Technology, 2021 – 2032 (USD Million)
- 7.1 Key trends
- 7.2 Flexographic
- 7.3 Rotogravure/Gravure
- 7.4 Digital printing
- 7.5 Offset printing
- 7.6 Hybrid printing
Chapter 8 Market Estimates & Forecast, By End-Use, 2021 – 2032 (USD Million)
- 8.1 Key trends
- 8.2 Food & beverages
- 8.2.1 Bakery & confectionery
- 8.2.2 Dairy products
- 8.2.3 Frozen food
- 8.2.4 Alcoholic
- 8.2.5 Non-Alcoholic
- 8.2.6 Others
- 8.3 Pharmaceutical
- 8.3.1 Tablet/Capsules
- 8.3.2 Cream & ointment
- 8.3.3 Liquid syrup
- 8.3.4 Others
- 8.4 Consumer goods
- 8.5 Chemicals
- 8.6 Automotive
- 8.7 Industrial
- 8.8 Others
Chapter 9 Market Estimates & Forecast, By Region, 2021 - 2032 (USD Million)
- 9.1 Key trends
- 9.2 North America
- 9.2.1 U.S.
- 9.2.2 Canada
- 9.3 Europe
- 9.3.1 UK
- 9.3.2 Germany
- 9.3.3 France
- 9.3.4 Italy
- 9.3.5 Spain
- 9.3.6 Rest of Europe
- 9.4 Asia Pacific
- 9.4.1 China
- 9.4.2 India
- 9.4.3 Japan
- 9.4.4 South Korea
- 9.4.5 ANZ
- 9.4.6 Rest of Asia Pacific
- 9.5 Latin America
- 9.5.1 Brazil
- 9.5.2 Mexico
- 9.5.3 Rest of Latin America
- 9.6 MEA
- 9.6.1 UAE
- 9.6.2 Saudi Arabia
- 9.6.3 South Africa
- 9.6.4 Rest of MEA
Chapter 10 Company Profiles
- 10.1 3M Company
- 10.2 Amcor plc
- 10.3 Anchor Printing
- 10.4 Avery Dennison Corporation
- 10.5 Berry Global
- 10.6 CCL Industries Inc.
- 10.7 Constantia Flexibles Group GmbH
- 10.8 Coveris Holding S.A.
- 10.9 Fort Dearborn Company
- 10.10 Fuji Seal International, Inc.
- 10.11 HERMA GmbH
- 10.12 Honeywell International Inc.
- 10.13 Huhtamaki Group
- 10.14 ID Images
- 10.15 Klöckner Pentaplast Europe GmbH & Co KG
- 10.16 KRIS FLEXIPACKS PVT. LTD.
- 10.17 Lintec Corporation
- 10.18 Mondi Plc
- 10.19 Multi-Color Corporation
- 10.20 Neenah, Inc
- 10.21 Resource Label Group, LLC
- 10.22 Sato Holdings Corporation
- 10.23 Taghleef Industries Inc.
- 10.24 UPM Raflatac
- 10.25 WestRock Company
 工业标籤市场规模、份额和成长分析(按材料、类型、印刷技术、最终用途产业和地区划分)-2026-2033年产业预测
 工业标籤:全球市场份额和排名、总收入和需求预测(2025-2031年)自动贴标机(列印贴标系统)-全球市占率及排名、总收入及需求预测(2025-2031年)
 包装标籤市场分析及预测(至2034年):类型、产品、技术、材料类型、应用、形式、最终用户、组成部分和功能
 全球时温指示器市场:预测至 2032 年 - 按产品类型、回应机制、阈值、技术、应用、最终用户和地区进行分析标籤市场分析及预测(2034年):类型、产品、技术、应用、材料类型、组件、最终用户、形式和解决方案
 2025年全球医疗设备标籤市场报告
 增强型文字标籤市场:依最终使用者产业、部署模式、产品类别、组织规模和技术类型划分-全球预测,2025-2032年工业标籤市场:压敏标籤、收缩套标标籤、套模、环绕标籤和转印标籤-2025-2032年全球预测
 全球全像标籤市场:市场规模、份额、趋势分析(按材料、应用、最终用途和地区)、细分市场预测(2025-2033)